Pine Lake 2017 Updated May 11, 2021 - Alberta Lake Management Society
←
→
Page content transcription
If your browser does not render page correctly, please read the page content below

Pine Lake
2017
Updated May 11, 2021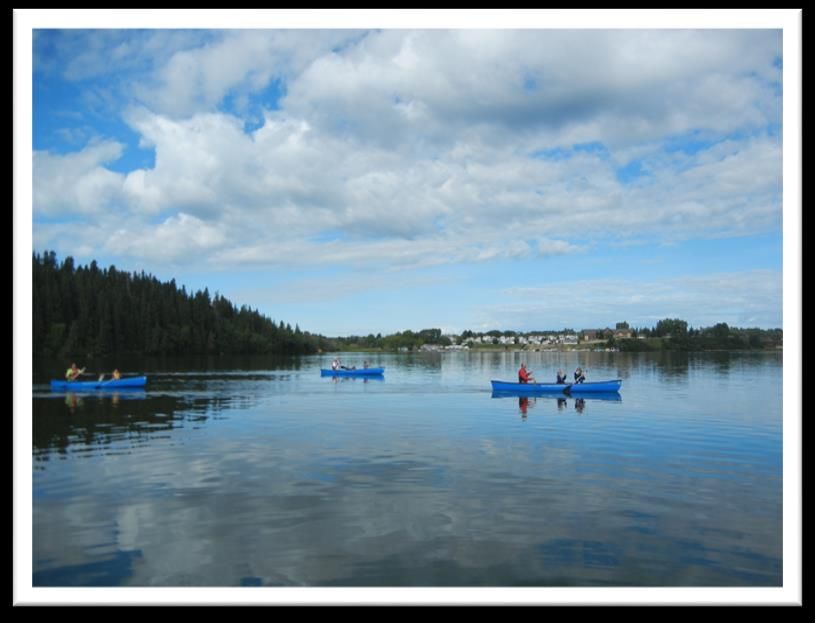
ALBERTA LAKE MANAGEMENT
                             SOCIETY’S LAKEWATCH PROGRAM
                             LakeWatch has several important objectives, one of which is to collect and interpret
                             water quality data on Alberta Lakes. Equally important is educating lake users about
                             their aquatic environment, encouraging public involvement in lake management, and
                             facilitating cooperation and partnerships between government, industry, the
                             scientific community and lake users. LakeWatch Reports are designed to summarize
                             basic lake data in understandable terms for a lay audience and are not meant to be a
                             complete synopsis of information about specific lakes. Additional information is
                             available for many lakes that have been included in LakeWatch and readers requiring
                             more information are encouraged to seek those sources.
                             ALMS would like to thank all who express interest in Alberta’s aquatic environments
                             and particularly those who have participated in the LakeWatch program. These
                             people prove that ecological apathy can be overcome and give us hope that our water
                             resources will not be the limiting factor in the health of our environment.

                             ALMS is happy to discuss the results of this report with our stakeholders. If you would
                             like information or a public presentation, contact us at info@alms.ca.

               ACKNOWLEDGEMENTS
The LakeWatch program is made possible through the dedication of its volunteers. We
would like to extend a special thanks to Ed Lawrence for the time and energy put into
sampling Pine Lake in 2017. We would also like to thank Elashia Young and Melissa
Risto who were summer technicians in 2017. Executive Director Bradley Peter and
LakeWatch Coordinator Laura Redmond was instrumental in planning and organizing
the field program. This report was prepared by Laura Redmond and Bradley Peter. The
Beaver River Watershed, the Red Deer River Watershed Alliance, the Lakeland
Industry and Community Association, Environment Canada, and Alberta Environment
and Parks are major sponsors of the LakeWatch program.
PINE LAKE
Pine Lake is a small eutrophic
lake southeast of Red Deer,
Alberta. Pine Lake is subject to
cyanobacterial blooms and
public       concern       over
deteriorating water quality
prompted       the      Alberta
government to initiate a lake
restoration program in 1991.
The Pine Lake Restoration
Program was designed as a pilot
project for future lake and
watershed projects in Alberta.

An advisory committee that                       Pine Lake—photo by Jessica 2011
represented all members of the
community      directed     early
planning and problem diagnosis by the Alberta government. A diagnostic study in 1992 determined
that approximately 61% of the total phosphorus (TP) loading was from sediment release and other
internal sources, while about 36% was from surface runoff. Monitoring of Pine Lake determined that
algal growth was mainly limited by the supply of phosphorus1. Four critical areas for watershed
restoration were identified on four streams affected by livestock operations and sewage release.
These streams contributed 72% of the phosphorus loading in 1992.

The advisory committee later formed the Pine Lake Restoration Society, a non-profit organization with
representatives from all stakeholders which raised funds and worked with technical advisors from the
Alberta government. The Pine Lake Restoration Society implemented a four-year work plan in 1995
that addressed phosphorus loading from all sources. The main objective of the restoration program
was to restore Pine Lake to a ‘natural’ level of algal productivity (as determined by paleolimnology).
The Pine Lake Restoration Society and other individuals in the basin completed beneficial management
practice (BMP) projects at various agricultural sites. Other organizations also improved wastewater
treatment at a resort and two camps near the shoreline of Pine Lake.

Following an evaluation of the different alternatives to remove or treat phosphorus released from lake
sediments, hypolimnetic withdrawal was selected as the preferred method of treatment. Hypolimnetic
withdrawal has been successfully used to reduce TP concentration in various lakes, mainly in Europe,
but had never been attempted in Alberta. The hypolimnetic withdrawal system at Pine Lake, installed
in 1998, consists of a weir that regulates lake levels, and a gravity-fed pipeline that withdraws cool,
phosphorus-rich water from near the bottom of the lake (the hypolimnion) of the south basin and
discharges it through a vault with control valves to a stilling basin on Ghostpine Creek.

1
 Sosiak, A. J and Trew, D.O. (1996). Pine Lake restoration project. Diagnostic Study (1992). Obtained from:
http://environment.gov.ab.ca/info/library/7764.pdf

METHODS
Profiles: Profile data is measured at the deepest spot in the main basin of the lake. At the profile site,
temperature, dissolved oxygen, pH, conductivity and redox potential are measured at 0.5- 1.0 m intervals.
Additionally, Secchi depth is measured at the profile site and used to calculate the euphotic zone. On one visit
per season, metals are collected at the profile site by hand grab from the surface and at some lakes, 1 m off
bottom using a Kemmerer.

Composite samples: At 10-sites across the lake, water is collected from the euphotic zone and combined across
sites into one composite sample. This water is collected for analysis of water chemistry, chlorophyll-a, nutrients
and microcystin. Quality control (QC) data for total phosphorus was taken as a duplicate true split on one
sampling date. ALMS uses the following accredited labs for analysis: Routine water chemistry and nutrients are
analyzed by Maxxam Analytics, chlorophyll-a and metals are analyzed by Alberta Innovates Technology Futures
(AITF), and microcystin is analyzed by the Alberta Centre for Toxicology (ACTF). In lakes where mercury samples
are taken, they are analyzed by the Biogeochemical Analytical Service Laboratory (BASL).

Invasive Species: Monitoring for invasive quagga and zebra mussels involved two components: monitoring for
juvenile mussel veligers using a 63 μm plankton net at three sample sites and monitoring for attached adult
mussels using substrates installed at each lake.

Data Storage and Analysis: Data is stored in the Water Data System (WDS), a module of the Environmental
Management System (EMS) run by Alberta Environment and Parks (AEP). Data goes through a complete
validation process by ALMS and AEP. Users should use caution when comparing historical data, as sampling
and laboratory techniques have changed over time (e.g. detection limits). For more information on data
storage, see AEP Surface Water Quality Data Reports at aep.alberta.ca/water.

Data analysis is done using the program R.1 Data is reconfigured using packages tidyr 2 and dplyr 3 and figures
are produced using the package ggplot2 4. Trophic status for each lake is classified based on lake water
characteristics using values from Nurnberg (1996)5. The Canadian Council for Ministers of the Environment
(CCME) guidelines for the Protection of Aquatic Life are used to compare heavy metals and dissolved oxygen
measurements. Pearson’s Correlation tests are used to examine relationships between TP, chlorophyll-a, TKN
and Secchi depth, providing a correlation coefficient (r) to show the strength (0-1) and a p-value to assess
significance of the relationship. For lakes with >10 years of long term data, trend analysis is done with
nonparametric methods. The seasonal Kendall test estimates the presence of monotonic (unidirectional)
trends across individual seasons (months) and is summed to give an overall trend over time. For lakes that had
multiple samplings in a single month, the value closest to the middle of the month was used in analysis.

1R Core Team (2016). R: A language and environment for statistical computing. R Foundation for Statistical Computing, Vienna,
Austria. URL https://www.R-project.org/.
2 Wickman, H. and Henry, L. (2017). tidyr: Easily Tidy Data with ‘spread ( )’ and ‘gather ( )’ Functions. R package version 0.7.2.

https://CRAN.R-project.org/package=tidyr.
3 Wickman, H., Francois, R., Henry, L. and Muller, K. (2017). dplyr: A Grammar of Data Manipulation. R package version 0.7.4.

http://CRAN.R-project.org/package=dplyr.
4 Wickham, H. (2009). ggplot2: Elegant Graphics for Data Analysis. Springer-Verlag New York.
5Nurnberg, G.K. (1996). Trophic state of clear and colored, soft- and hardwater lakes with special consideration of nutrients,

anoxia, phytoplankton and fish. Lake and Reservoir Management 12: 432-447.

BEFORE READING THIS REPORT, CHECK
                                                                           OUT A BRIEF INTRODUCTION TO
                                                                          LIMNOLOGY AT ALMS.CA/REPORTS

WATER CHEMISTRY
ALMS measures a suite of water chemistry parameters. Phosphorus, nitrogen, and chlorophyll-a are
important because they are indicators of eutrophication, or excess nutrients, which can lead to harmful
algal/cyanobacteria blooms. One direct measure of harmful cyanobacteria blooms are Microcystins, a
common group of toxins produced by cyanobacteria. See Table 2 for a complete list of parameters.

The average total phosphorus (TP) concentration for Pine Lake was 78.8 μg/L (Table 2), falling into the
eutrophic, or productive, trophic classification. This value falls well within the range of historical averages. TP
was relatively stable over the course of the sampling season (Figure 1).

Average chlorophyll-a concentration in 2017 was 38.0 μg/L (Table 2), putting Pine Lake into the hypereutrophic,
or very productive classification. This is the highest average concentration of chlorophyll-a measured since
1992. Chlorophyll-a peaked on August 30, measuring 53.2 μg/L (Figure 1).

Finally, average TKN concentration was 1.9 mg/L (Table 2). TKN concentrations varied throughout the sampling
season, peaking on August 30. Chlorophyll-a and TKN were positively correlated, but this trend was not
significant (r = 0.86, p = 0.06).

Average pH was measured as 8.77 in 2017, buffered by moderate alkalinity (312 mg/L CaCO3) and bicarbonate
(336 mg/L HCO3). Sodium and sulphate were the dominant ions contributing to a moderate conductivity of 742
μS/cm (Table 2).

METALS
Samples were analyzed for metals (Table 3). In total, 27 metals were sampled for. It should be noted that
many metals are naturally present in aquatic environments due to the weathering of rocks and may only
become toxic at higher levels.

Metals were measured on August 30 at Pine Lake at the surface. Arsenic was measured as above the
recommended guideline measuring 7.11 μg/L. Copper and selenium also exceeded the recommended
guideline. Historically, no metals have exceeded guidelines at Pine Lake. In 2017, all other measured values fell
within their respective guidelines (Table 3).
Figure 1- Total Phosphorus (TP), Total Kjeldahl Nitrogen (TKN), and Chlorophyll-a concentrations measured five times over the course of the summer at Pine Lake. WATER CLARITY AND SECCHI DEPTH Water clarity is influenced by suspended materials, both living and dead, as well as dissolved colored compounds in the water column. During the melting of snow and ice in spring, lake water can become turbid (cloudy) from silt transported into the lake. Lake water usually clears in late spring but then becomes more turbid with increased algal growth as the summer progresses. The easiest and most widely used measure of lake water clarity is the Secchi depth. Two times the Secchi depth equals the euphotic depth – the depth to which there is enough light for photosynthesis. The average Secchi depth of Pine Lake in 2017 was 1.4 m (Table 2). Water clarity measured as Secchi depth was highest on June 24, and decreased to around 1 m for the remainder of the season. Secchi disk depth was negatively associated with chlorophyll-a (r = -0.9, p = 0.04). The decreasing water clarity could therefore be associated with increasing algae biomass in the warmer months of the summer.
Figure 2 – Secchi depth values measured five times over the course of the summer at Pine Lake in 2017.

WATER TEMPERATURE AND DISSOLVED OXYGEN
Water temperature and dissolved oxygen profiles in the water column can provide information on water
quality and fish habitat. The depth of the thermocline is important in determining the depth to which
dissolved oxygen from the surface can be mixed. Please refer to the end of this report for descriptions of
technical terms.

Temperatures of Pine Lake varied throughout the summer, with a maximum temperature of 21.3 °C measured
at the surface on August 11 (Figure 3a). Pine Lake was weakly thermally stratified on July 19 and August 11. By
September 26, the entire water column was around 12 °C.

Pine Lake remained well oxygenated at the surface throughout the summer, measuring above the CCME
guidelines of 6.5 mg/L for the Protection of Aquatic Life (Figure 3b). During thermal stratification, oxygen levels
decreased near the bottom because it is cut off from atmospheric oxygen that is circulated at the water surface.
Decreasing dissolved oxygen near the bottom on August 30 may also be associated with decomposition.
Figure 3 – a) Temperature (°C) and b) dissolved oxygen (mg/L) profiles for Pine Lake measured five times over
the course of the summer of 2017.

MICROCYSTIN
Microcystins are toxins produced by cyanobacteria (blue-green algae) which, when ingested, can cause
severe liver damage. Microcystins are produced by many species of cyanobacteria which are common to
Alberta’s Lakes, and are thought to be the one of the most common cyanobacteria toxins. In Alberta,
recreational guidelines for microcystin are set at 20 µg/L. Blue-green algae advisories are managed by
Alberta Health Services. Recreating in algal blooms, even if microcystin concentrations are not above
guidelines, is not recommended.

Microcystin levels in Pine Lake fell below the recreational guideline for the entire sampling period of 2017
(Table 1).
Table 1 – Microcystin concentrations measured five times at Pine Lake in 2017.

 Date                                                  Microcystin Concentration (µg/L)
 Jun-24-17                                             0.85
 Jul-19-17                                             1.97
 Aug-11-17                                             2.82
 Aug-30-17                                             3.2
 Sep-26-17                                             2.43
 Average                                               2.25

INVASIVE SPECIES MONITORING
Dreissenid mussels pose a significant concern for Alberta because they impair the function of water
conveyance infrastructure and adversely impact the aquatic environment. These invasive mussels have been
linked to creating toxic algae blooms, decreasing the amount of nutrients needed for fish and other native
species, and causing millions of dollars in annual costs for repair and maintenance of water-operated
infrastructure and facilities.

Monitoring involved two components: monitoring for juvenile mussel veligers using a plankton net and
monitoring for attached adult mussels using substrates installed in each lake. No mussels have been detected
in Pine Lake since invasive species monitoring began in 2013.

WATER LEVELS
There are many factors influencing water quantity. Some of these factors include the size of the lake’s
drainage basin, precipitation, evaporation, water consumption, ground water influences, and the efficiency
of the outlet channel structure at removing water from the lake. Requests for water quantity monitoring
should go through Alberta Environment and Parks Monitoring and Science division.

Pine Lake water levels have been monitored by volunteers along with Alberta Environment since 2007 and
have fluctuated within less than half a metre in this time. Pine Lake water levels are controlled by a weir system.
889.65

                       889.6

                      889.55

                       889.5
  Elevation (m asl)

                      889.45

                       889.4

                      889.35

                       889.3

                      889.25

                       889.2
                               2007   2008   2009   2010   2011   2012   2013   2014   2015   2016   2017
                                                                  Year

Figure 4- Average yearly water levels measured in metres above sea level (m asl) from 2007-2017.
Data retrieved from Alberta Environment and Parks.
Table 2: Average Secchi depth and water chemistry values for Pine Lake. Historical values are given as reference. Parameter 1979 1984 1992 1996 2002 2003 2004 2005 2006 2008 2009 2011 2013 2015 2017 TP (μg/L) / 56 84.7 104 49.3 55 79 70 81.2 78.8 68 92.8 72.75 69 78.8 TDP (μg/L) / / 38.6 57.9 18.4 26.2 26.2 33.3 32.4 33.8 34.5 31.4 42.25 30 24.6 Chlorophyll-a (μg/L) 11.3 26.3 50.4 22.1 15.6 17.9 37.8 19.3 32.7 37.2 22.5 30.8 17.82 26.7 38.0 Secchi depth (m) 3.4 1.8 1.8 2.1 1.7 3.1 1.7 2.5 1.8 1.2 1.86 1.29 1.94 1.75 1.4 TKN (mg/L) 1.3 1.3 2.1 1.4 1.4 1.5 1.9 1.8 1.9 1.9 1.8 1.9 1.7 2.9* 1.9 NO2-N and NO3-N (μg/L) 13
Table 3: Concentrations of metals measured in Pine Lake. The CCME heavy metal Guidelines for the
       Protection of Freshwater Aquatic Life (unless otherwise indicated) are presented for reference.
        Metals (Total Recoverable)     2003       2004        2013      2015     2017     Guidelines
        Aluminum μg/L                  24.9       30.55       26.2      49.15    97.1     100a
        Antimony μg/L                  0.057      0.078       0.0915    0.0955   0.52     /
        Arsenic μg/L                   1.14       1.145       1.37      1.395    7.11     5
        Barium μg/L                    56.2       58.6        59.7      52.2     298      /
        Beryllium μg/L                 0.17       0.00225     0.0015    0.006    0.0055   100c,d
        Bismuth μg/L                   0.0065     0.00115     0.115     0.031    0.0055   /
        Boron μg/L                     67.7       80.3        85.8      89.8     469      1500
        Cadmium μg/L                   0.01       0.0037      0.0039    0.0085   0.025    0.26b
        Chromium μg/L                  0.36       0.334       0.402     0.615    0.25     /
        Cobalt μg/L                    0.065      0.063       0.115     0.12     0.641    1000d
        Copper μg/L                    0.83       1.57        0.468     1.265    4.29     4b
        Iron μg/L                      /          9           36.2      47.7     105      300
        Lead μg/L                      0.165      0.12665     0.0544    0.0945   0.165    7b
        Lithium μg/L                   34.8       43.55       35.5      38       196      2500e
        Manganese μg/L                 10.86      10.475      7.42      12.8     66.4     200e
        Molybdenum μg/L                0.68       0.7         0.835     0.923    5.06     73c
        Nickel μg/L                    0.045      0.195       0.527     0.5595   2.38     150b
        Selenium μg/L                  0.35       0.05        0.177     0.15     2.3      1
        Silver μg/L                    0.0025     0.00025     0.0277    0.004    0.01     0.25
        Strontium μg/L                 255.67     283.5       284       264      1420     /
        Thallium μg/L                  0.033      0.0007      0.0005    0.0052   0.016    0.8
        Thorium μg/L                   0.0015     0.00555     0.0966    0.1132   0.083    /
        Tin μg/L                       0.05       0.015       0.0352    0.0365   0.15     /
        Titanium μg/L                  1.7        1.32        0.95      1.795    4.7      /
        Uranium μg/L                   0.71       0.7565      1.25      1.27     6.38     15
        Vanadium μg/L                  0.397      0.3755      0.573     0.655    2.95     100d,e
         Zinc μg/L                      4.36        7.69        0.772   0.85     3.3      30
Values represent means of total recoverable metal concentrations.
a
  Based on pH ≥ 6.5
b
  Based on water hardness > 180mg/L (as CaCO3 )
c
  CCME interim value.
d
  Based on CCME Guidelines for Agricultural use (Livestock Watering).
e
  Based on CCME Guidelines for Agricultural Use (Irrigation).
A forward slash (/) indicates an absence of data or guidelines.
LONG TERM TRENDS
Trend analysis was conducted on the parameters total phosphorus (TP), chlorophyll-a, total dissolved solids
(TDS) and Secchi depth to look for changes over time in Pine Lake. In sum, non-significant increases were
observed in chlorophyll-a and significant increasing trends were observed in TP. Significant decreases were
observed in TDS and Secchi depth. Secchi depth can be subjective and is sensitive to variation in weather -
trend analysis must be interpreted with caution. Data is presented below as both a line graph (all data points
used in analysis) and a box-and-whisker plot. Detailed methods are available in the ALMS Guide to Trend
Analysis on Alberta Lakes.
Table 1: Summary table of trend analysis on Pine Lake data from 2003 to 2017.
Parameter Date Range Trend Probability
Total Phosphorus 2003-2017 Increasing Significant
Chlorophyll-a 2003-2017 Increasing Non-significant
Total Dissolved Solids 2003-2017 Decreasing Significant
Secchi Depth 2003-2017 Decreasing Significant
Definitions:
Median: the value in a range of ordered numbers that falls in the middle.
Trend: a general direction in which something is changing.
Monotonic trend: a gradual change in a single direction.
Statistically significant: The likelihood that a relationship between variables is caused by something other
than random chance. This is indicated by a p-value ofTotal Phosphorus (TP) Since 2003, TP has significantly increased (Tau= -0.32, p = 0.013). Figure 1-Monthly total phosphorus (TP) concentrations measured between June and September over the long term sampling dates between 2003 and 2017 (n = 38). The value closest to the 15th day of the month was chosen to represent the monthly value in cases with multiple monthly samples.
Chlorophyll-a
Chlorophyll-a has not significantly changed in Pine Lake since 2003 (Tau = 0.32, p = 0.115). Chlorophyll-a is
moderately correlated with TP (r = 0.55, p = 0.0004).

Figure 2-Monthly chlorophyll-a concentrations measured between June and September over the long term
sampling dates between 2003 and 2017 (n = 38). The value closest to the 15th day of the month was chosen to
represent the monthly value in cases with multiple monthly samples. Line graph is overlain by TP concentrations.
Total Dissolved Solids (TDS)

TDS has significantly decreased in Pine Lake (Tau =-0.46, p = 0.003).

Figure 3-Monthly TDS concentrations (mg/L) measured between June and September over the long term
sampling dates between 2003 and 2017 (n = 30). The value closest to the 15th day of the month was chosen to
represent the monthly value in cases with multiple monthly samples.
Secchi Depth

Water clarity has decreased significantly in Pine Lake since 2003 (Tau = -0.34, p = 0.009).

Figure 4-Monthly Secchi depth values measured between June and September over the long term sampling
dates between 2003 and 2017 (n = 38). The value closest to the 15th day of the month was chosen to represent
the monthly value in cases with multiple monthly samples.
Table 2- Results of Seasonal Kendall and Mann-Kendall Trend tests using monthly total phosphorus (TP),
chlorophyll-a, total dissolved solids (TDS) and Secchi depth data from June to September on Pine Lake data.

                                         Total                                Total
   Definition           Unit          Phosphorus       Chlorophyll-a       Dissolved       Secchi Depth
                                         (TP)                             Solids (TDS)
   Statistical                          Seasonal         Seasonal          Seasonal          Seasonal
                          -
    Method                               Kendall          Kendall           Kendall           Kendall
  The strength
  and direction
  (+ or -) of the
                         Tau              0.32              0.22             -0.46             -0.36
      trend
   between 0
      and 1
  The extent of
                        Slope             1.29              0.50              -4.8            -0.067
    the trend
  The statistic
  used to find
                            Z             2.48              1.57             -3.00             -2.70
 significance of
    the trend
   Number of
     samples                n              38                38               30                38
     included
        The
 significance of            p            0.013*            0.115            0.003*            0.007*
    the trend
*p < 0.05 is significant within 95%
You can also read