Lower crustal resistivity signature of an orogenic gold system
←
→
Page content transcription
If your browser does not render page correctly, please read the page content below
www.nature.com/scientificreports
OPEN Lower crustal resistivity signature
of an orogenic gold system
Graham Heinson1*, Jingming Duan2, Alison Kirkby2, Kate Robertson1,3, Stephan Thiel1,3,
Sasha Aivazpourporgou4 & Wolfgang Soyer5
Orogenic gold deposits provide a significant source of the world’s gold and form along faults over
a wide range of crustal depths spanning sub-greenschist to granulite grade faces, but the source
depths of the gold remains poorly understood. In this paper we compiled thirty years of long-period
magnetotelluric (MT) and geomagnetic depth sounding (GDS) data across western Victoria and south-
eastern South Australia that have sensitivity to the electrical resistivity of the crust and mantle, which
in turn depend on past thermal and fluid processes. This region contains one of the world’s foremost
and largest Phanerozoic (440 Ma) orogenic gold provinces that has produced 2% of historic worldwide
gold production. Three-dimensional inversion of the long-period MT and GDS data shows a remarkable
correlation between orogenic gold deposits with > 1 t production and a < 20 Ω m low-resistivity region
at crustal depths > 20 km. This low-resistivity region is consistent with seismically-imaged tectonically
thickened marine sediments in the Lachlan Orogen that contain organic carbon (C), sulphides such
as pyrite (FeS2) and colloidal gold (Au). Additional heat sources at 440 Ma due to slab break-off after
subduction have been suggested to rapidly increase the temperature of the marine sediments at
mid to lower crustal depth, releasing HS− ligands for Au, and CO2. We argue that the low electrical
resistivity signature of the lower crust we see today is from a combination of flake graphite produced
in situ from the amphibolite grade metamorphism of organic-carbon in the marine sediments, and
precipitated graphite through retrograde hydration reactions of CO2 released during the rapid heating
of the sediments. Thus, these geophysical data image a fossil source and pathway zone for one of the
world’s richest orogenic gold provinces.
Orogenic gold deposits in upper crustal settings are a significant source of the world’s gold resources, but their
origin depth is contentious 1–5,6,7,8 The 440 Ma orogenic belt in south eastern Australia is one of the largest global
gold provinces and had been widely researched in terms of its structural and geodynamic setting 9,10–12 but the
3D crustal architecture is poorly constrained13. To provide new insight on the crustal structure beneath this
gold province, we have compiled 30 years of broadband and long-period MT and GDS surveys across western
Victoria and south-eastern South Australia 20,21. Since 2013, high-quality long-period MT data have been col-
lected in the Australian Lithospheric Architecture Magnetotelluric Project (AusLAMP) with site spacing of
approximately 55 k m22,23 that covers all of South Australia and Victoria. After removal of poor-quality sites, 123
long-period MT and GDS sites, 252 broadband MT (mostly with GDS data) and 40 long-period GDS sites were
identified as a composite database, covering an area approximately 800 km east–west and 500 km north–south,
as shown in Fig. 1.
Three-dimensional inversion of all long-period MT (123 sites) and long-period GDS (40 sites) data, including
bathymetry and topography, produced a model that fits the full tensor data to an RMS misfit of 2.1, with error
floors of 5% for each impedance element and 0.02 for magnetic transfer functions. A number of different inver-
sions were undertaken, testing: (a) models with and without inversion for distortion; (b) changes in the depth-
weighting of smoothness parameters; (c) varying levels of horizontal and vertical regularization; and (d) models
with and without near-surface (top 3 km and top 500 m) smoothing. Broadband MT data were not included in
the three-dimensional inversion as they have quite a different spatial and frequency s ampling14–17,18,19. However,
we use these data to verify the results from the three-dimensional inversion in the Supplementary Information.
Figure 2 shows three depth slices from the preferred model at lower-crustal depths of (a) 20 and (b) 30 km,
and (c) at the lithosphere-asthenosphere boundary depth of ~ 150 km. Details of the 3D inversion parameters
are provided in the Supplementary Information and Fig. S1. Additional slices at 5, 10, 40, and 100 km are also
1
Department of Earth Sciences, University of Adelaide, Adelaide, SA 5005, Australia. 2Geoscience Australia,
Canberra, ACT 2601, Australia. 3Geological Survey of South Australia, Adelaide, SA 5001, Australia. 4WH
Bryan Mining and Geology Research Centre, University of Queensland, Brisbane, QLD 4068, Australia. 5CGG
Multi-Physics Imaging, Milan, Italy. *email: Graham.Heinson@adelaide.edu.au
Scientific Reports | (2021) 11:15807 | https://doi.org/10.1038/s41598-021-94531-8 1
Vol.:(0123456789)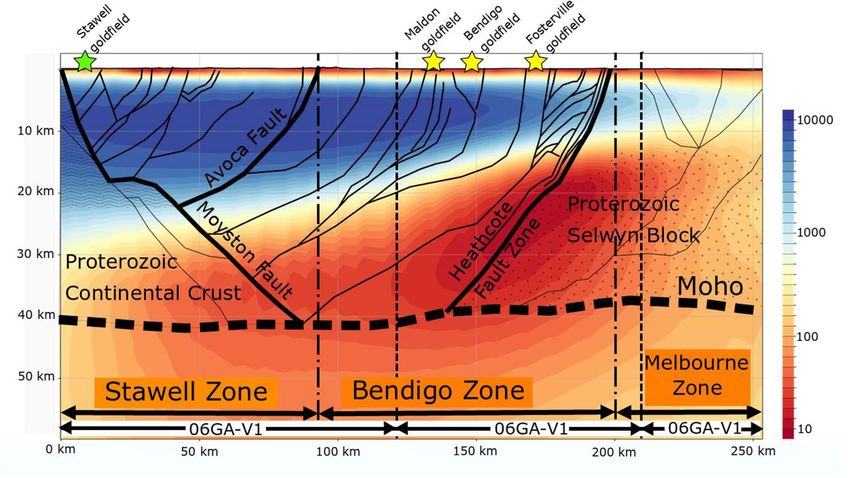
www.nature.com/scientificreports/
Figure 1. Distribution of MT and GDS sites across south-eastern South Australia and western Victoria, plotted
on sun-shaded topography with illumination from the northeast, the coastline and depth contours in 1000 m
intervals as solid white lines. Phase tensors at a period of 50 s are colour-filled with the minimum phase: warm-
red colours indicate a decrease in resistivity with crustal depth, and cold-blue colours indicate an increase in
resistivity. Real (in-phase) induction arrows that in the Parkinson convention point towards conductors are also
shown for a period of 300 s. Large yellow circles represent gold mines with production > 1 t; smaller white circles
show production < 1 t. Tectonic domains are shown by solid black lines (adapted f rom24). Larger cities are shown
(black squares), with Ballarat and Bendigo being centres of historic gold mining. Figure created using CGG
Electromagnetics (Italy) Srl Geotools software (version 2.02.12400 www.cgg.com) and Inkscape (version 1.1
inkscape.org). Topography data were obtained from Geoscience Australia Geophysical Archive Data Delivery
System under Creative Commons Attribution 4.0 International Licence (portal.ga.gov.au/persona/gadds).
shown in Supplementary Information, Fig. S2a–d. At 30 km, there is a strong spatial correlation between major
orogenic gold deposits around Ballarat and Bendigo and low-resistivity regions < 20 Ωm.
Such low crustal resistivities in silicate minerals are unlikely to be solely due to temperature, even if minerals
are significantly hydrated25, so another mechanism to enhance conduction is required26. Such additional con-
duction is generally argued to be g raphite26,27, magnetite and sulphides25,28, or sometimes free fluids29,30, which
are secondary overprints of the primary crustal materials31. Of these competing mechanisms, magnetite and
sulphides are generally of negligible volume and are isolated in fresh xenolith granulites25, and are unlikely to
interconnect over tens of kilometres. Similarly, aqueous fluids are unlikely to be stable and connected over long
geological time scales32.Thus, the mostly commonly proposed mechanism for widespread electrical conduction
at lower crustal depths is g raphite31,27.
Large et al.33 argue that Au deposits in orogenic settings are originally sourced from marine sediments in deep
ocean environments that host C, F eS2 and potentially colloidal Au. When buried to mid to lower crust depths,
and with additional rapid heating from the upper m antle6,7,9 such oceanic sediments rich in C and F eS2 generate
− 2−
significant amounts of free aqueous sulphur ( HS ,S ) in a relatively short time frame that acts as the ligand for
Au through the following relationship7.
2FeS2 + 2H2 O + C = 2FeS + 2H2 S + CO2
For the case of the Victorian gold province the additional heat source at 440 Ma has been suggested to be
due to slab break-off and subsequent mantle upwelling that allowed a rapid introduction of mantle heat into the
crust10. This mechanism is thought to have occurred along many hundreds of kilometres of a mega-subduction
Scientific Reports | (2021) 11:15807 | https://doi.org/10.1038/s41598-021-94531-8 2
Vol:.(1234567890)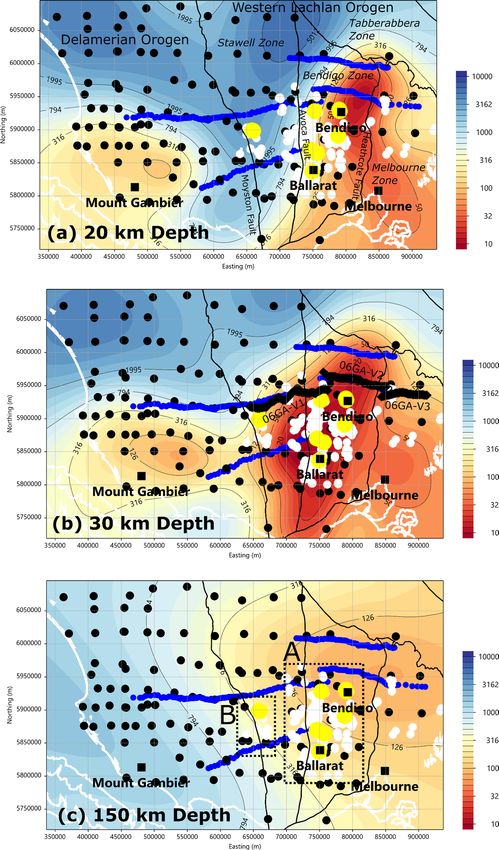
www.nature.com/scientificreports/
zone off the eastern margin of Gondwana, explaining the widespread occurrences of world-class orogenic and
instruction-related gold deposits that were formed simultaneously in the Lachlan Orogen at 440 Ma10.
Organic carbon in sediment may be metamorphosed to flake graphite at amphibolite grade conditions at
depths of ~ 20–30 km and temperatures ~ 550 °C34. In addition, mobilised CO2 may be precipitated as graphite35,36
either at grain b oundaries27 or along more permeable zones37,38 through retrograde hydration reactions where
the host-rock oxygen fugacity ( fO2 rock) is below the upper f O2 limit of g raphite39. We argue, therefore, that the
low resistivity imaged ~ 30 km depth may be due to graphite. At 20 km depth, the zone of lower resistivity is
narrowed and major deposits appear to align along the western margin of the resistivity anomaly, suggesting
that the pathway of Au deposits to the surface is controlled by variations in permeability that are expressed as
gradients in electrical properties. The resistive western flank may represent a permeability boundary that is
structurally aligned with the Heathcote Fault Zone24,40. Deposits to the west of the low-resistivity zone at 30 km
depth, particularly in the Stawell area, are porphyritic and instruction-related rather than o rogenic11,42,44.
Figure 2 shows an additional zone of low resistivity of < 300 Ωm centred around the town of Mount Gambier.
It is most evident as a separate region in the 20 km depth slice; at 30 km depth the region has slightly lower
resistivity (minimum 100 Ωm), but the inherent smoothing of the three-dimensional modelling with increas-
ing depth merges these features. We argue that the cause of this lower resistivity at crustal depths may be due to
hotter temperatures associated with the Newer Volcanic P rovince43–50. The most recent volancism (~ 4.5 ka) at
Mount Schank, 10 km south of Mount Gambier (volcanism 5 ka), indicates that higher crustal temperatures are
still present. For the 20 and 30 km depth slices, an order of magnitude decrease in resistivity (1000 to 100 Ωm)
can be explained by thermal anomalies of 100 °C25.
At the base of the lithosphere, at a depth of ~ 150 km, there is a resistivity gradient of > 1000 Ωm to 100 Ωm
from the southern Delamerian Orogen to the Lachlan Orogen. This trend is also seen in an eastward reduction
of P and S-wave v elocities13 suggesting that there is a step in lithospheric thickness due to higher temperatures
beneath the Lachlan orogenic belts.
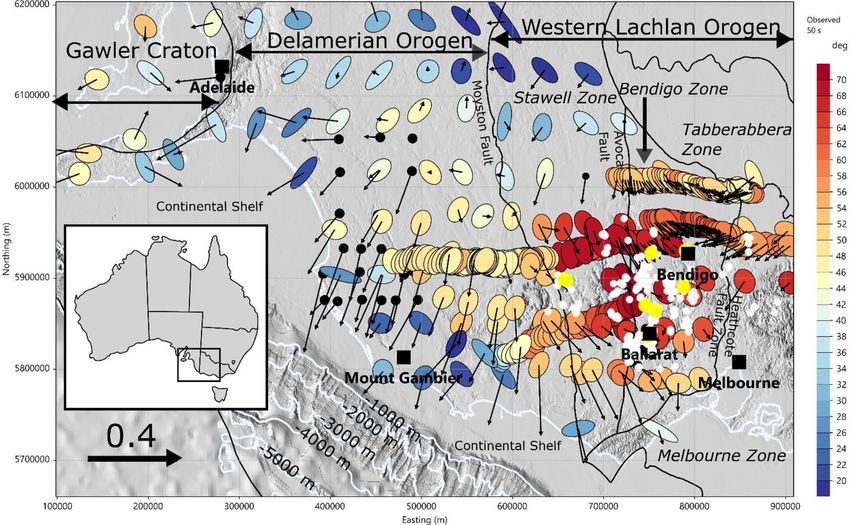
Reflection seismic profiles 06GA-V1 to V3 were collected across the western Victorian goldfields in 2 00612,24,
as shown in Fig. 2b. In Fig. 3 we show a cross-section from the resistivity model along the seismic lines 06GA-
V1 to V3 with a structural interpretation derived from the seismic data24,40. The resistivity model is a smoothed
representation of the geology, but clearly shows that the low-resistivity region (< 20 Ωm) lies near the boundary
between the Bendigo Zone and the Selwyn Block in Fig. 3. This low-resistivity region extends from a depth of
about 20 km to the seismically defined Moho, and is centred on the west-dipping listric Heathcote Fault Zone,
which bounds the Proterozoic Selwyn B lock47. The east-dipping Moyston Fault that is recognized as the bound-
ary between the Delamerian and Lachlan Orogens24 has a less pronounced electrical signature, but delineates
the western extent of the low-resistivity region in the lower crust.
The most electrically conductive zone in Fig. 3 is in a broad region of shearing where oceanic mafic crustal
elements are highly faulted and stacked above and below the Heathcote Fault Z one23,24, representing a zone of
enhanced transient permeability during tectonism. The lower resistivity observed along the Heathcote Fault
Zone may represent a zone of enhanced graphite deposition from CO2-rich fluids27,37,38 evolved from tectonically
thickened carbon-rich sediments.
Conclusions
We conclude that the south-eastern Australia orogenic gold deposits have a deep crustal origin. Such gold depos-
its are spatially correlated with a broad region of lower crust (> 20 km depth) with electrical resistivity of less
than 20 Ωm. We argue that this footprint of the source is due to the presence of graphite derived from carbon
and pyrite-rich source sediments, from direct metamorphism to flake graphite and precipitated graphite through
retrograde hydration reactions of C O2 released from the sediments.
Methods
MT and GDS responses used in the inversion were rotated to 305° (clockwise from geographic N), in line with
the 3D mesh orientation. The orientation was primarily chosen to parallel the orientation of the continental
shelf and slope to the south. Data were resampled to five per decade over a bandwidth from 10 to 10,000 s, for
a total of 16 periods. Error floors of 5% for all tensor impedances and 0.02 for magnetic transfer functions were
assigned. Static distortion matrices were also determined from the inversion.
Cell width in the core area is 5 km and the core extended beyond sites by 30 km (6 cells). Lateral padding of
500 km was included, with a growth factor of 1.3. Vertical spacing starts from 100 m at the topographic level,
increasing by a factor of 1.06 per cell down to 10 km depth, 1.04 per cell to 100 km, and finally 1.2 until the bot-
tom of the mesh at 800 km. The model includes bathymetry and topography: starting resistivity is a homogenous
200 Ωm, and 0.25 Ωm for sea water. The final model comprised 189 by 123 cells, and 115 layers, to give a total
of 2,673,405 free parameters.
Scientific Reports | (2021) 11:15807 | https://doi.org/10.1038/s41598-021-94531-8 3
Vol.:(0123456789)www.nature.com/scientificreports/
Figure 2. Resistivity depth slices in the lower crust at (a) 20 and (b) 30 km, and (c) near the lithosphere-asthenosphere
boundary (~ 150 km). Black circles are long-period MT and GDS observation sites used in the three-dimensional inversion;
blue circles are broadband MT transects that were not used in the inversion. Large yellow circles represent gold mines with
production > 1 t; smaller white circles show production < 1 t. Solid black lines represent the boundaries of major tectonic
elements24, and the white lines show coastlines and bathymetry contours at 1000 m depth intervals. The colour scale bar on
right side represents resistivity values within the range of 10 to 10,000 Ωm. The image at 30 km shows the location of seismic
lines 06GA-V1 to V3. In the 150 km depth slice, box A shows the extent of predominantly orogenic gold deposits, and box
B shows predominantly porphyritic and intrusion-related gold deposits, including the Stawell mine. Figure created using
CGG Electromagnetics (Italy) Srl Geotools software (version 2.02.12400 www.cgg.com) and Inkscape (version 1.1 inkscape.
org). Topography data were obtained from Geoscience Australia Geophysical Archive Data Delivery System under Creative
Commons Attribution 4.0 International Licence (portal.ga.gov.au/persona/gadds).
Scientific Reports | (2021) 11:15807 | https://doi.org/10.1038/s41598-021-94531-8 4
Vol:.(1234567890)www.nature.com/scientificreports/
Figure 3. Resistivity section from the three-dimensional model extracted along the three seismic lines
06GA-V1-V3 in Fig. 2b (30-km depth slice), with a simplified structural interpretation24. The colour scale bar
on right side represents resistivity values within the range of 10 to 10,000 Ωm. Yellow stars represent significant
orogenic gold deposits projected on to the seismic lines (Maldon, Bendigo and Fosterville), and the green star
represents a porphyritic system (Stawell). Figure created using CGG Electromagnetics (Italy) Srl Geotools
software (version 2.02.12400 www.cgg.com) and Inkscape (version 1.1 inkscape.org).
Data availability
All MT and GDS data are available from the Geoscience Australia (https://doi.org/10.11636/Record.2018.021),
the State Government of South Australia (map.sarig.sa.gov.au/) and National Computational Infrastructure
(www.nci.org.au/).
Received: 6 April 2021; Accepted: 5 July 2021
References
1. Groves, D. I. & Santosh, M. Province-scale commonalities of some world-class gold deposits: Implications for mineral exploration.
Geosci. Front. 6, 389–399. https://doi.org/10.1016/j.gsf.2014.12.007 (2015).
2. Goldfarb, R. J. & Groves, D. I. Orogenic gold: Common or evolving fluid and metal sources through time. Lithos 233, 2–26. https://
doi.org/10.1016/j.lithos.2015.07.011 (2015).
3. Tomkins, A. G. A biogeochemical influence on the secular distribution of orogenic gold. Econ. Geol. 108, 193–197. https://doi.
org/10.2113/econgeo.108.2.193 (2013).
4. Groves, D. I. & Bierlein, F. P. Geodynamic settings of mineral deposit systems. J. Geol. Soc. 164, 19–30. https://doi.org/10.1144/
0016-76492006-065 (2007).
5. Groves, D. I., Goldfarb, R. J. & Santosh, M. The conjunction of factors that lead to formation of giant gold provinces and deposits
in non-arc settings. Geosci. Front. 7, 303–314. https://doi.org/10.1016/j.gsf.2015.07.001 (2016).
6. Gaboury, D. Does gold in orogenic deposits come from pyrite in deeply buried carbon-rich sediments?: Insight from volatiles in
fluid inclusions. Geology 41, 1207–1210. https://doi.org/10.1130/G34788.1 (2013).
7. Gaboury, D. Parameters for the formation of orogenic gold deposits. Appl. Earth Sci. 128, 124–133. https://doi.org/10.1080/25726
838.2019.1583310 (2019).
8. Groves, D. I., Santosh, M. & Zhang, L. A scale-integrated exploration model for orogenic gold deposits based on a mineral system
approach. Geosci. Front. 11, 719–738. https://doi.org/10.1016/j.gsf.2019.12.007 (2020).
9. Phillips, D. et al. Timing of gold mineralisation in the western Lachlan orogen, SE Australia: A critical overview. Aust. J. Earth Sci.
59, 495–525. https://doi.org/10.1080/08120099.2012.682738 (2012).
10. Vos, I. M. A., Bierlein, F. P. & Heithersay, P. S. A crucial role for slab break-off in the generation of major mineral deposits: insights
from central and eastern Australia. Miner. Deposita 42, 515–522. https://doi.org/10.1007/s00126-007-0137-3 (2007).
11. Vos, I. M. A., Bierlein, F. P., Heithersay, P. S., & Lister, G. S. Geodynamic controls on giant metallogenic provinces: Insights from
gold provinces in southeast Australia. In: (eds. Mao, J, & Bierlein, F.P.) Mineral deposit research: Meeting the global challenge. https://
doi.org/10.1007/3-540-27946-6_16 (Springer, Berlin, 2005).
12. Willman, C. E. et al. Crustal-scale fluid pathways and source rocks in the Victorian gold province, Australia: Insights from deep
seismic reflection profiles. Econ. Geol. 105, 895–915. https://doi.org/10.2113/gsecongeo.105.5.895 (2010).
13. Rawlinson, N., Pilia, S., Young, M., Salmon, M. & Yang, Y. Crust and upper mantle structure beneath southeast Australia from
ambient noise and teleseismic tomography. Tectonophysics 689, 143–156. https://doi.org/10.1016/j.tecto.2015.11.034 (2016).
14. Dennis, Z. R., Moore, D. H. & Cull, J. P. A geological interpretation of the Echuca magnetotelluric survey, Victoria. Aust. J. Earth
Sci. 58, 587–597. https://doi.org/10.1080/08120099.2011.577808 (2011).
Scientific Reports | (2021) 11:15807 | https://doi.org/10.1038/s41598-021-94531-8 5
Vol.:(0123456789)www.nature.com/scientificreports/
15. Dennis, Z. R., Moore, D. H. & Cull, J. P. Magnetotelluric survey for undercover structural mapping, Central Victoria. Aust. J. Earth
Sci. 58, 33–47. https://doi.org/10.1080/08120099.2011.534817 (2011).
16. Dennis, Z. R., Thiel, S. & Cull, J. P. Lower crust and upper mantle electrical anisotropy in southeastern Australia. Explor. Geophys.
43, 228–241. https://doi.org/10.1071/EG11022 (2012).
17. Aivazpourporgou, S., Thiel, S., Hayman, P. C., Moresi, L. N. & Heinson, G. Decompression melting driving intraplate volcanism
in Australia: Evidence from magnetotelluric sounding. Geophys. Res. Lett. 42, 346–354. https://doi.org/10.1002/2014GL060088
(2015).
18. Robertson, K. E., Heinson, G. S., Taylor, D. H. & Thiel, S. The lithospheric transition between the Delamerian and Lachlan orogens
in western Victoria: New insights from 3D magnetotelluric imaging. Aust. J. Earth Sci. 64, 385–399. https://doi.org/10.1080/08120
099.2017.1292953 (2017).
19. Robertson, K., Taylor, D., Thiel, S. & Heinson, G. Magnetotelluric evidence for serpentinisation in a Cambrian subduction zone
beneath the Delamerian Orogen, southeast Australia. Gondwana Res. 28, 601–611. https://d oi.o
rg/1 0.1 016/j.g r.2 014.0 7.0 13 (2015).
20. Whellams, J. M. Spatial inhomogeneity of geomagnetic fluctuation fields and their influence on high resolution aeromagnetic
surveys. PhD Thesis, Flinders University, South Australia (1996).
21. Milligan, P. R., White, A., Heinson, G. & Brodie, R. Micropulsation and induction array study near Ballarat victoria. Explor. Geophys.
24, 117–122. https://doi.org/10.1071/EG993117 (1993).
22. Robertson, K., Heinson, G. & Thiel, S. Lithospheric reworking at the proterozoic-phanerozoic transition of Australia imaged using
AusLAMP magnetotelluric data. Earth Planet. Sci. Lett. 452, 27–35. https://doi.org/10.1016/j.epsl.2016.07.036 (2016).
23. Kirkby, A. L. et al. Lithospheric architecture of a Phanerozoic orogen from magnetotellurics: AusLAMP in the Tasmanides, south-
east Australia. Tectonophysics 793, 228560. https://doi.org/10.1016/j.tecto.2020.228560 (2020).
24. Cayley, R. A. et al. Crustal architecture of central Victoria: Results from the 2006 deep crustal reflection seismic survey. Aust. J.
Earth Sci. 58, 113–156. https://doi.org/10.1080/08120099.2011.543151 (2011).
25. Yang, X. Origin of high electrical conductivity in the lower continental crust: A review. Surv. Geophys. 32, 875–903. https://doi.
org/10.1007/s10712-011-9145-z (2011).
26. Glover, P. W. J. Graphite and electrical conductivity in the lower continental crust: A review. Phys. Chem. Earth 21, 279–287 (1997).
27. Frost, B. R., Fyfe, W. S., Tazaki, K. & Chan, T. Grain-boundary graphite in rocks and implications for high electrical conductivity
in the lower crust. Nature 340, 134–136. https://doi.org/10.1038/340134a0 (1989).
28. Reynard, B., Mibe, K. & Moortèle, B. D. Electrical conductivity of the serpentinised mantle and fluid flow in subduction zones.
Earth Planet. Sci. Lett. 307, 387–394 (2011).
29. Hyndman, R. D., Vanyan, L. L., Marquis, G. & Law, L. K. The origin of electrically conductive lower continental crust: Saline water
or graphite?. Phys. Earth Planet. Int. 81, 325–344 (1993).
30. Simpson, F. Fluid trapping at the brittle-ductile transition re-examined. Geofluids 1, 123–136. https://d oi.o
rg/1 0.1 046/j.1 468-8 123.
2001.00011.x (2001).
31. Selway, K. On the causes of electrical conductivity anomalies in tectonically stable lithosphere. Surv. Geophys. 35, 219–257. https://
doi.org/10.1007/s10712-013-9235-1 (2014).
32. Yardley, B. W. D. & Valley, J. W. The petrologic case for a dry lower crust. J. Geophys. Res. Solid Earth 102, 12173–12185. https://
doi.org/10.1029/97JB00508 (1997).
33. Large, R. R., Bull, S. W. & Maslennikov, V. V. A carbonaceous sedimentary source-rock model for carlin-type and orogenic gold
deposits. Econ. Geol. 106, 331–358. https://doi.org/10.2113/econgeo.106.3.331 (2011).
34. Rosing-Schow, N. et al. Hydrothermal flake graphite mineralisation in Paleoproterozoic rocks of south-east Greenland. Miner.
Deposit. 52, 769–789. https://doi.org/10.1007/s00126-016-0701-9 (2017).
35. Buseck, P. R. & Beyssac, O. From organic matter to graphite: Graphitization. Elements 10, 421–426. https://doi.org/10.2113/gsele
ments.10.6.421 (2014).
36. Rumble, D. Hydrothermal graphitic carbon. Elements 10, 427–433. https://doi.org/10.2113/gselements.10.6.427 (2014).
37. Jodicke, H., Nover, G., Kruhl, J. H. & Markfort, R. Electrical properties of a graphite-rich quartzite from a former lower continental
crust exposed in the Serre San Bruno, Calabria (southern Italy). Phys. Earth Planet. Int. 165, 56–67. https://doi.org/10.1016/j.pepi.
2007.08.001 (2007).
38. MonteiroSantos, F. A., Mateus, A., Almeida, E. P., Pous, J. & Mendes-Victor, L. A. Are some of the deep crustal conductive features
found in SW Iberia caused by graphite?. Earth Planet. Sci. Lett. 201, 353–367. https://doi.org/10.1016/S0012-821X(02)00721-5
(2002).
39. Huizenga, J. M. & Touret, J. L. R. Granulites, CO2 and graphite. Gondwana Res. 22, 799–809. https://doi.org/10.1016/j.gr.2012.03.
007 (2012).
40. Wilson, C. J. L. & Leader, L. D. Modeling 3D crustal structure in Lachlan Orogen, Victoria, Australia: Implications for gold deposi-
tion. J. Struct. Geol. 67, 235–252. https://doi.org/10.1016/j.jsg.2014.01.007 (2014).
41. Squire, R. & Miller, J. Synchronous compression and extension in East Gondwana: Tectonic controls on world-class gold deposits
at 440 Ma. Geology 31, 1073. https://doi.org/10.1130/G19710.1 (2003).
42. Hronsky, J. M. A., Groves, D. I., Loucks, R. R. & Begg, G. C. A unified model for gold mineralisation in accretionary orogens and
implications for regional-scale exploration targeting methods. Miner. Deposit. 47, 339–358. https://doi.org/10.1007/s00126-012-
0402-y (2012).
43. Boyce, J. The Newer Volcanics Province of southeastern Australia: A new classification scheme and distribution map for eruption
centres. Aust. J. Earth Sci. 60, 449–462. https://doi.org/10.1080/08120099.2013.806954 (2013).
44. Boyce, J., Nicholls, I., Keays, R. & Hayman, P. Victoria erupts: The Newer Volcanics Province of south-eastern Australia. Geol.
Today 30, 105–109. https://doi.org/10.1111/gto.12054 (2014).
45. Cas, R. A. F., van Otterloo, J., Blaikie, T. N. & van den Hove, J. in Geological Society Special Publication Vol. 446, 123–172 (2017).
46. Mather, B., McLaren, S., Taylor, D., Roy, S., Moresi, L. Variations and controls on crustal thermal regimes in Southeastern Australia.
Tectonophysics 723261–276 https://doi.org/10.1016/j.tecto.2017.12.015 (2018)
47. Cayley, R. A., Taylor, D. H., VandenBerg, A. H. M. & Moore, D. H. Proterozoic: Early palaeozoic rocks and the tyennan orogeny
in central Victoria: The Selwyn Block and its tectonic implications. Aust. J. Earth Sci. 49, 225–254. https://doi.org/10.1046/j.1440-
0952.2002.00921.x (2002).
48. LaRowe, D. E. et al. The fate of organic carbon in marine sediments: New insights from recent data and analysis. Earth Sci. Rev.
204, 103146. https://doi.org/10.1016/j.earscirev.2020.103146 (2020).
49. Wilkin, R. T. in Encyclopedia of Sediments and Sedimentary Rocks (eds Gerard V. Middleton et al.) 701–703 (Springer, 2003).
50. Glassley, W. Fluid evolution and graphite genesis in the deep continental crust. Nature 295, 229–231 (1982).
Acknowledgements
The AusLAMP projects in SA and Victoria provided the core data sets for the three-dimensional modelling.
Additional long-period MT and GDS data were provided by S Aivazpourporgou and J Whellams. Broadband MT
data sets were made available by Z Dennis, the University of Adelaide and the Geological Survey of Victoria. The
AusLAMP Victoria data were collected under a collaborative project between the Geological Survey of Victoria
Scientific Reports | (2021) 11:15807 | https://doi.org/10.1038/s41598-021-94531-8 6
Vol:.(1234567890)www.nature.com/scientificreports/
and Geoscience Australia using Australian Government NCRIS Capability AuScope and Geoscience Australia
instruments. The AusLAMP South Australia data were collected using AuScope instruments by the Geological
Survey of South Australia, the University of Adelaide and Geoscience Australia, with acquisition funded from
the Geological Survey of South Australia, Geoscience Australia and AuScope. The authors acknowledge the many
people from Geoscience Australia, Geological Survey of South Australia, Geological Survey of Victoria and the
University of Adelaide involved in collecting the data and the support provided by individuals and communities
to access the country, especially in remote and rural Australia. The authors acknowledge the traditional custo-
dians of the land on which the data in this paper were collected. Alison Kirkby and Jingming Duan publish with
the permission of the CEO, Geoscience Australia. Stephan Thiel and Kate Robertson publish with the permission
of the CEO, Geological Survey of South Australia. We thank Dr Chris Lawley and an anonymous reviewer for
the constructive comments that have significantly improved the manuscript.
Author contributions
G.H. compiled the data sets, and wrote the paper with input from all other authors. J.D. and A.K. provided the
AusLAMP Victoria data, S.T. and K.R. provided the AusLAMP SA data, and S.A. provided a smaller grid of long
period MT collected in Western Victoria. W.S. undertook the three-dimensional numerical modelling.
Competing interests
The authors declare no competing interests.
Additional information
Supplementary Information The online version contains supplementary material available at https://doi.org/
10.1038/s41598-021-94531-8.
Correspondence and requests for materials should be addressed to G.H.
Reprints and permissions information is available at www.nature.com/reprints.
Publisher’s note Springer Nature remains neutral with regard to jurisdictional claims in published maps and
institutional affiliations.
Open Access This article is licensed under a Creative Commons Attribution 4.0 International
License, which permits use, sharing, adaptation, distribution and reproduction in any medium or
format, as long as you give appropriate credit to the original author(s) and the source, provide a link to the
Creative Commons licence, and indicate if changes were made. The images or other third party material in this
article are included in the article’s Creative Commons licence, unless indicated otherwise in a credit line to the
material. If material is not included in the article’s Creative Commons licence and your intended use is not
permitted by statutory regulation or exceeds the permitted use, you will need to obtain permission directly from
the copyright holder. To view a copy of this licence, visit http://creativecommons.org/licenses/by/4.0/.
© The Author(s) 2021
Scientific Reports | (2021) 11:15807 | https://doi.org/10.1038/s41598-021-94531-8 7
Vol.:(0123456789)You can also read