DOI Vingnanam Journal of Science
←
→
Page content transcription
If your browser does not render page correctly, please read the page content below
Mahilrajan et al.    DOI: http://doi.org/10.4038/vingnanam.v16i1.4182                        Yeast extract production from indigenous yeast

    Isolation and Identification of Indigenous Yeast Strain and Its Potential for
                              Yeast Extract Production
                                       S.Mahilrajan1, C. J. Emmanuel*,2, and S. Srivijeindran1

                                        1
                                         Palmyrah Research Institute, Jaffna, JA 40000, Sri Lanka
                     2
                         Department of Botany, Faculty of Science, University of Jaffna, Jaffna, JA 40000, Sri Lanka
                                                   *Email: jeyaseelan.ec@univ.jfn.ac.lk
Abstract—The growing demand for protein-rich food forces humans to search for alternative protein sources. Yeasts are
among the preferred candidates due to their well-balanced source of amino acids and vitamins. The present study aimed to
identify an indigenous yeast strain that can be used as a protein source. Yeast strains were isolated from Palmyrah toddy
sediments collected from different regions in the Jaffna Peninsula. One yeast strain, named A3, was selected as a potential
strain based on the maximum cell size and optical density among the 55 yeast strains isolated. The biochemical analysis and
sequencing of the ITS region (including 5.8S rRNA gene) and the LSU rRNA gene D1/D2 domains confirmed the yeast isolate
as a strain of Saccharomyces cerevisiae. The optimum growth conditions for the yeast strain were determined using Taguchi
L16 orthogonal array. Yeast cell autolysis was conducted with and without papain, and the yield of soluble matter and total
protein were measured. The strain yielded a maximum of 70.7 % soluble mater and 56.9 % of total protein when autolysis with
papain. The yield is significantly higher (p
Mahilrajan et al. Yeast extract production from indigenous yeast
Achchuvely, Chavachcheri, Manipay, Pandaththarippu, buffered phenol, chloroform and isoamyl alcohol (25:24:1,
Nelliyady, Kodikamam and Kayts in Jaffna district, Sri v/v) were added. After vortexing for 3 min, 200 µL TE
Lanka. In each PDCS, five different samples were collected buffer (10 mM Tris–HCl pH 8.0, 1 mM EDTA) was added to
between January to March 2018. The yeast sediments were the mixture. It was followed by vortexing for 1 min and
serially diluted up to a notional 10-4 dilution in sterile saline centrifugation at 14,000 rpm for 5 min. The upper phase was
(0.85% NaCl). The suspension was transferred on yeast pipetted into 1 mL of ice-cold 96% ethanol and mixed. The
extract peptone dextrose agar (YEPDA) medium (1 L precipitated nucleic acids were collected by centrifugation at
medium contain yeast extract 5.0 g, peptone 10.0 g, dextrose 14,000 rpm for 5 min, and the pellet was redissolved in 50
20.0 g and agar 2.5 g) by spread plate method, and the plates µL TE buffer. For the digestion of RNA, 3 µL RNAse (10
were incubated at 28 oC for 3-5 days. Morphologically µg/mL) (Sigma) was added, and the mixture was incubated
distinct fifty-five colonies were sub-cultured on a fresh at 37 °C for 30 min. After incubation, the DNA was
medium of the same composition. precipitated in 1 mL of ice-cold 96% ethanol and centrifuged
at 14,000 rpm for 5 min. The pellet was redissolved in 50 µL
B. Selection of potential yeast isolate based on cell size and
TE buffer and stored until use at -20 °C.
optical density in suspension
D.2. PCR amplification and sequencing
The isolates were grown in yeast extract peptone dextrose
(YEPD) broth (1 L medium contains yeast extract 5.0 g, The sequences of the ITS region (including 5.8S rRNA gene)
peptone 10.0 g, dextrose 20.0 g) at 28 oC in a shaker at 100 and the LSU rRNA gene D1/D2 domains were PCR
rpm. After 48 h of incubation, each isolate's cell diameter or amplified from the genomic DNA of potential yeast strain
length was measured using an ocular micrometre. In using primers NL1 and NL4 (Kurtzman and Robnett, 1998),
addition, the optical density (600 nm) of the aliquots of yeast and ITS1 and ITS4 (White et al., 1990), respectively. The
cell suspensions was measured using UV – Vis PCR products were sequenced using forward and reverse
spectrophotometer (Thermo Scientific™ GENESYS™ 10S) primers by an automated Sanger sequencing service
after three days of incubation. Finally, an isolate with the (Macrogen, Korea). Identity searches for the sequences were
largest cell size and highest density in suspension was carried out using the BLAST (Altschul et al., 1990) search
selected for further screening and identification. available in the NCBI. Sequences generated as part of this
study are deposited in GenBank. Additional sequences were
C. Biochemical characterisation of the yeast isolate obtained from Kurtzman and Robnett (2003). All the
sequences were aligned using the MUSCLE (Edgar, 2004)
The isolate was tested for carbohydrate fermentation, carbon
algorithm. Phylogenetic trees were reconstructed from the
assimilation, temperature tolerance and urease production.
sequences using the Maximum Likelihood algorithm in
All the experimental procedures were followed as described
MEGA software version 7.0 (Kumar et al., 2016).
by Kurtzman et al. (2011a). For the carbohydrate
Confidence levels of the clades were estimated from
fermentation, the isolate was inoculated in YEP broth with
bootstrap analysis based on 1000 replications.
bromothymol blue and different sugars, namely sucrose, D-
galactose, glucose, lactose, maltose and raffinose. Carbon E. Optimisation of growth conditions of the potential yeast
assimilation of the yeast isolate was tested by inoculating in strain
yeast nitrogen base medium, which was incorporated with
Taguchi methodology was used to find the optimum growth
different carbon compounds (Glucose, mannitol, ribose,
conditions. An L16 orthogonal array (OA) in four levels was
galactose, myo-inositol, lactose, xylose, inulin, sucrose, D-
used, which consisted of 16 different experimental trials
arabinose, maltose, ethanol, methanol, glycerol and L-
(Elizalde-González and García-Díaz, 2010). Five selected
arabinose). The isolate was grown on YEPD medium at
factors, namely the amount of glucose, yeast extract and
temperatures 19, 25, 30, 37 and 45°C to find optimum
peptone, level of pH and inoculum size, were selected for
growth temperature. Similarly, Christensen urea agar
medium optimisation. Level 1 for each factor was fixed at a
medium (with 20 %) at pH 6.8 was used to test the
low value, considering the factors' role in yeast growth in the
hydrolysis of urea.
fermentation medium. In contrast, levels 2 and 3 were
D. Molecular identification of the yeast isolate deemed intermediate levels for yeast growth. Level 4 of each
D.1. DNA extraction factor was selected at a relatively higher value range. All the
DNA isolation was performed as described by Senses-ergul trials were conducted at 30 °C for two days at 150 rpm,
et al. (2006). The yeast isolates cultured on tryptone glucose finally, OD was measured.
yeast extract (TGY) agar for 24 h at 30 °C was suspended All five selected factors, their assigned levels and the
and washed in 1 mL of sterile distilled water. Then the cells experimental design are listed in Table 1. The design for the
were collected by centrifugation at 14,000 rpm for 2 min and L16 OA was developed and analysed using "MINITAB 19"
200 µL of breaking buffer (2% (v/v) Triton X-100, 1% (w/v) software.
SDS, 100 mM NaCl, 10 mM Tris–HCl pH 8.0, 1 mM
EDTA). Glass beads (diameter 0.45–0.50 mm), 200 µL of
Vingnanam Journal of Science, Vol.16 (1), Jun 2021 9Mahilrajan et al. Yeast extract production from indigenous yeast
Table. 1: Selected factors and their assigned levels for the optimization of 10 min at 4 °C. The supernatant was used for chemical
fermentation media
analysis. In a control experiment, baker's yeast was used
Factors Level 1 Level 2 Level 3 Level 4 instead of the yeast strain identified in this study. The total
solids in the fresh yeast and yeast extract were determined by
pH 2.5 4.5 5.5 6.5
the dry weights following drying at 105°C until a constant
Inoculum size (µl/100ml) 250 500 750 1000 mass was achieved. The total solids content was expressed as
a percentage of solids recuperated in the yeast extract with
Yeast extract (g/100ml) 0.25 0.5 0.75 1.0
respect to the total solids present in the fresh yeast. The total
Peptone (g/100ml) 0.5 1.0 1.5 2.0 crude protein content was determined by the Lowry method
(Lowry et al., 1951).
Glucose (g/100ml) 1.0 2.0 3.0 4.0
III. RESULTS AND DISCUSSION
In this study, fifty-five different yeast strains were initially
F. Preparation of yeast extract from identified potential isolated from yeast sediments based on the diversity in the
yeast isolate colony and cell morphology. The mean cell size of the
The potential yeast strain was cultured in 250 ml Erlenmeyer isolated strains ranged from 4.0 µm to 7.8 µm after 48 h of
flasks containing 100 ml medium under optimum growth incubation. The yeast cell suspensions' mean optical density
conditions which were determined in a growth optimisation (OD600nm) was between 0.1 and 3.99 in three days of
experiment. The inoculated flasks were incubated in an incubation (Figure 1). Since the cell size is a reasonable
orbital shaker at 30 °C for two days at 150 rpm. The yeast estimation of the protein content of yeast (Alberghina et al.,
cells were harvested by centrifugation at 8000 rpm for 10 1998), the strain that had the largest cell and maximum
min at ambient temperature. The pellet was re-suspended in optical density was selected as potential yeast for further
phosphate-buffered saline and centrifuged again at the same study. The strain A3, isolated from the toddy sample
conditions. The resulting pellet volume was estimated, and collected in Achchuvely, showed the highest diameter (7.5 ±
aliquots of 15% (w/v) suspension of the yeast slurry in sterile 0.3 µm) and density (3.49 ± 0.5) at the tested growth
deionised water was prepared under aseptic conditions in a conditions. The strain showed fermentation in a medium
250 mL flask. The yeast cell disruption was carried out in incorporated with sucrose, D-galactose, glucose, lactose or
two different methods. In one method, the aliquots were maltose. But it failed to grow in Raffinose medium (Table 2).
subjected to autolysis, and the pH level was adjusted to 6.0 Similarly, carbon sources such as glucose, galactose, inulin,
with 1N NaOH. For the second method, papain [1 % (w/v) sucrose, maltose, ethanol and L-arabinose were assimilated.
final concentration] (Papain from papaya latex, Sigma- However, growth was not observed in the assimilation
Aldrich) was added to the aliquots, and the pH was adjusted medium incorporated with mannitol, ribose, myo-inositol,
to 6.0. The flasks were placed in a shaking water bath at a lactose, xylose, D-arabinose, glycerol. The strain did not
show growth and utilisation of urea. Among the different
Fig. 1: Characters used to screen isolated fift five yeast strains. (a) Cell diameter (µm) and (b) optical density.
constant temperature of 55 °C at 100 rpm. After 24 h, the tested growth temperatures, the strain showed maximum
flasks were heated at 85 °C for 15 min then cooled down to growth at 30 °C.
room temperature and finally, centrifuged at 10,000 rpm for
10 Vingnanam Journal of Science, Vol.16 (1), Jun 2021Mahilrajan et al. Yeast extract production from indigenous yeast
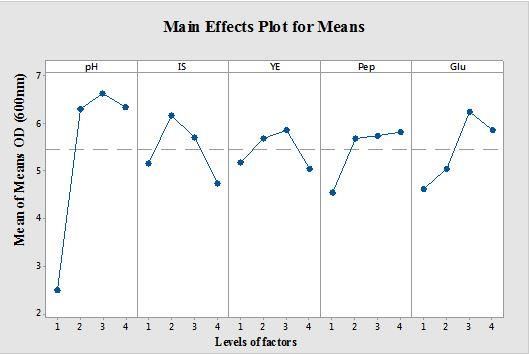
Even though biochemical characteristics have been used in It is well documented that the macromolecular composition
yeast taxonomy, identification of yeast species entirely based of growing microbial cells varies in relation to the growth
on morphological traits and physiological abilities is rate (Villadsen and Nielsen, 2011; Zakhartsev and Reuss,
laborious and time-consuming (Carvalho et al., 2005; 2018). Therefore, Taguchi L16 orthogonal experiment design
Kawahata et al., 2007). Furthermore, it is also difficult to was used to determine the growth parameters needed for the
distinguish some closely related species. In contrast, gene optimal growth of strain A3. The model was highly
sequence comparisons offer the opportunity to resolve significant considering its r2 = 0.973. Based on the results
closely related species, as well as more distantly related taxa. obtained in this analysis, the effect of each test media
As the ITS sequences are commonly used to determine component on the growth of the yeast can be ranked as pH >
species, often in conjunction with those from the D1/D2 LSU glucose > inoculum size > peptone > yeast extract (Table 3).
rRNA gene (Kurtzman et al., 2011b), both of these regions The highest delta value (0.4125) was obtained for the pH of
were amplified in the present study and sequenced. the medium when the pH value was increased to 5.5. The
Amplification of the ITS region (including 5.8S rRNA gene) ANOVA results also revealed pH of the medium was the
and the LSU rRNA gene D1/D2 domains of the potential significant factor (p= 0.011) compared to other tested factors.
yeast strain A3 yielded 841 bp and 615 bp PCR products,
respectively. The sequences were deposited in the GenBank Figure 4 illustrates the optimum conditions required for yeast
database with accession numbers MT322849 (for ITS region) growth. The optimum composition for 100 mL medium
and MT322857 (for D1/D2 domains). DNA homology included 3 g of glucose, 2 g of peptone, and 0.75g of yeast
search in BLAST showed >99% sequence identity (with extract. The pH of the medium needed to be 5.5 and the
100% query coverage) with Saccharomyces cerevisiae initial inoculum was 500 µl. The confirmation experiment is
(baker's yeast). a crucial step and is highly recommended by Taguchi to
verify the experimental results (Ross, 1996).
Phylogenetic analysis of the two sequences with sequences
retrieved from the GenBank database demonstrated that the In this study confirmation experiments were conducted by
strains were clustered closely with Saccharomyces cerevisiae using optimised factors and levels. The average of the results
strains. Both clades were obtained with high (> 80%) from the confirmation experiment is compared with the
bootstrap support values (Figure 2 and 3). Based on the predicted average based on the parameters and levels tested.
above results, the potential yeast strain A3 was confirmed as The obtained OD600 was 7.89 in the confirmation
a strain of Saccharomyces cerevisiae. experiment while the amount of predicted value of the design
was 8.28. The quantity of resulting yeast extract depends on
Table. 2: Characteristic feature of the selected yeast strain factors such as cell disruption method, temperature, pH,
duration of disruption and amount of yeast cell.
Character assessed Observation
in the isolate Table. 3: Effect of growth factors and their assign level on the mean
Colony characters growth (OD600) of yeast strain
Colour White
Form Circular
Margin Entire
Surface Smooth Level pH Inoculum Yeast Peptone Glucose
Texture Mucoid
Elevation Convex size extract
Cell morphology
Shape Oval
Size 7.5 ± 0.3 µm 1 0.2508 0.5172 0.5198 0.4543 0.4630
Carbohydrate fermentation
Sucrose, D-galactose, Glucose, Lactose Positive 2 0.6315 0.6178 0.5695 0.5685 0.5045
and Maltose
Raffinose Negative 3 0.6633 0.5713 0.5873 0.5755 0.6262
Carbon assimilation
Glucose, Galactose, Inulin, Sucrose, Positive
Maltose, Ethanol, L-arabinose 4 0.6355 0.4748 0.5045 0.5827 0.5872
Mannitol, Ribose, Myo-Inositol, Negative
Lactose, Xylose, D-arabinose, Delta 0.4125 0.1430 0.0828 0.1285 0.1632
Glycerol
Urea hydrolysis Negative
Rank 1 3 5 4 2
Growth temperature 30 °C
OD600nm 3.49 ± 0.5
Vingnanam Journal of Science, Vol.16 (1), Jun 2021 11Mahilrajan et al. Yeast extract production from indigenous yeast
In this study, cell disruption was carried out by the autolysis This solid recovery was higher than that of several previous
method with or without papain, and baker's yeast was used as reports (Verduyn et al., 1999; Chae et al., 2001;
a control. The autolysis temperature, pH and papain Vukasinovic Milic et al., 2007) with active baker's yeast or
concentration were not optimised in this study. But these brewer's yeast and obtained using a combined treatment of
proteolytic enzymes.
Fig. 2: Phylogenetic tree based on the LSU rRNA gene D1/D2 domains Fig. 3: Phylogenetic tree based on the ITS region (including 5.8S rRNA
sequences showing the position of potential yeast strain A3 among gene) sequences showing the position of potential yeast strain A3 among
related species. The evolutionary history was inferred by using the related species. The evolutionary history was inferred by using the
Maximum Likelihood method based on the Kimura 2-parameter model. Maximum Likelihood method based on the Kimura 2-parameter model. A
A discrete Gamma distribution was used to model evolutionary rate discrete Gamma distribution was used to model evolutionary rate
differences among sites. Bootstrap values >50% (based on 1000 differences among sites. Bootstrap values >50% (based on 1000 replicates)
replicates) are given at branch points. GenBank accession numbers are are given at branch points. GenBank accession numbers are given in
given in parentheses. The tree is drawn to scale, with branch lengths parentheses. The tree is drawn to scale, with branch lengths measured in
measured in the number of substitutions per site. the number of substitutions per site.
parameters were selected from several previous reports
(Conway et al., 2001; Vukasinovic Milic et al., 2007; In the yeast extract preparation, the yeast strain used strongly
Dolińska et al., 2012). Papain can be used in concentrations affected the recovery of the cell constituent. The strain A3,
that go from 0.1% to 2.5% at temperatures in the 50–60°C isolated from toddy sediment, yielded more total-soluble
range and slightly acidic pH ~6. Therefore in the present matter and total protein than the control baker's yeast. The
study, 1% was used for digestion. The result obtained from addition of 1% papain resulted in maximum yeast extract,
the experiment is given in Table 4. High solid recovery of which contained a maximum protein content of 56.9 mg/mL.
70.7 % was obtained by papain treatment of yeast strain A3. This result is equal to a previous report with active baker's
Fig. 4: The main effects of each factor on growth of the yeast strain. The detail of each level of factor is given in Table 1. pH- pH of the initial medium;
IS – inoculum size; YE – yeast extract; Pep – peptone; Glu – glucose.
12 Vingnanam Journal of Science, Vol.16 (1), Jun 2021Mahilrajan et al. Yeast extract production from indigenous yeast
yeast treated with 2.5 % papain (Vukasinovic Milic et al., cytometry. Journal of Bacteriology 180, 3864–3872. DOI:
2007). Consequently, a process using an indigenous yeast https://doi.org /10.1128/JB.180.15.3864-3872.1998
strain and papain was developed to produce high-protein
yeast extract. Further research is needed to develop an Altschul, S., Gish, W., Miller, W., Myers, E and Lipman, D
economically viable yeast production process based on (1990). Basic local alignment search tool. Journal of
industrial side streams or agricultural wastes as substrates. Molecular Biology 215, 403–410. DOI: https://doi.org
/10.1016/S0022-2836(05)80360-2
Table. 4: Effect of yeast cells disruption
Anupama, Ravindra P (2000). Value-added food: Single cell
protein. Biotechnology Advances 18, 459–479. DOI:
Method of cell Soluble matter (%) Protein (mg/mL) https://doi.org/10.1016/S0734-9750(00)00045-8
disruptions Strain A Baker's Strain A Baker's Boland, M.J, Rae, A.N., Vereijken, J.M., Meuwissen,
M.P.M., Rutherfurd, S.M., Gruppen, H., Moughan, P.J and
yeast yeast
Hendriks, W.H (2013). The future supply of animal-derived
Autolysis 67.6± 1.5 64.6± 2.1 54.2 ± 1.5 51.7 ± 1.6 protein for human consumption. Trends in Food Science &
Technology 29, 62–73.
Autolysis + 70.7± 1.2 68.7± 1.3 56.9 ± 1.9 53.9 ± 1.9 DOI:https://doi:10.1016/j.tifs.2012.07.002
papain
Carvalho, C.M., Rocha, A., Estevinho, M.L.F and Choupina,
A (2005). Identification of honey yeast species based on
RFLP analysis of the ITS region. CYTA - Journal of Food 5,
IV. CONCLUSION 11–17. DOI:https://doi:10.1080/11358120509487665.
The present study was conducted to identify yeast strain in
toddy sediments with the potential to use in single-cell Chae, H.J., Joo, H and In, M.J (2001). Utilisation of brewer's
protein production or yeast extract preparation. The isolated yeast cells for the production of food-grade yeast extract.
strain A3, a strain of Saccharomyces cerevisiae, has been Part 1: Effects of different enzymatic treatments on solid and
identified as a potential yeast strain. Under optimised protein recovery and flavor characteristics. Bioresource
conditions, the yeast strain A3 can yield more protein than Technology 76, 253–258. DOI:https://doi:10.1016/S0960-
baker's yeast. Furthermore, autolysis coupled with exogenous 8524(00)00102-4
enzyme papain enhanced protein extraction.
Conway, J., Gaurdeau, H and Champagne, C.P (2001). The
ACKNOWLEDGEMENT effect of the addition of proteases and glucanases during
The authors thank Mr. P.T.J.Jashothan, Technical Officer, yeast autolysis on the production and properties of yeast
Department of Botany, the University of Jaffna, for extracts. Canadian Journal of Microbiology 47, 18–24.
assistance in part of the work conducted in the Department of DOI:https://doi:10.1139/w00-118
Botany, University of Jaffna. The authors are highly
grateful for partial financial support from Palmyrah Dolińska, B., Zieliński, M., Dobrzański, Z., Chojnacka, K.,
Development Board, Jaffna, Sri Lanka. Opaliński, S and Ryszka, F (2012). Influence of incubation
conditions on hydrolysis efficiency and iodine enrichment in
DISCLOSURE STATEMENT baker’s yeast. Biological Trace Element Research 147, 354–
358. DOI:https://doi:10.1007/s12011-011-9318-0
The authors reported no potential conflict of interest
Edgar R.C (2004). MUSCLE: Multiple sequence alignment
AUTHOR'S CONTRIBUTION with high accuracy and high throughput. Nucleic Acids
Research 32, 1792–1797.
ECJ supervised the research project and conducted
DOI:https://doi:10.1093/nar/gkh340
experimental procedures for yeast identification. SM carried
out isolation, optimisation and autolysis experiments. ECJ
Elizalde-González, M.P and García-Díaz, L.E (2010).
and SM drafted the manuscript. SSV coordinated the
Application of a Taguchi L16 orthogonal array for
research activities. All authors read and approved the final
optimising the removal of Acid Orange 8 using carbon with a
manuscript.
low specific surface area. Chemical Engineering Journal 163,
55–61. DOI:https://doi:10.1016/j.cej.2010.07.040
V. REFERENCES
Frazier, W and Westhoff, D (1988). Food Microbiology.
McGraw Hill Publishing Company Limited, New York.
Alberghina, L., Smeraldi, C., Ranzi, B.M and Porro, D
(1998). Control by nutrients of growth and cell cycle
progression in budding yeast, analysed by double-tag flow
Vingnanam Journal of Science, Vol.16 (1), Jun 2021 13Mahilrajan et al. Yeast extract production from indigenous yeast
Hongpattarakere, T and H-kittikun, A (1995). Optimisation Lowry, O.H., Rosebrough, N.J., Farr, A.L and Randall, R.J
of single-cell-protein production from cassava starch using (1951). Protein measurement with the folin phenol reagent.
Schwanniomyces castellii. World Journal of Microbiology & Journal of Biological Chemistry 193, 265–275.
Biotechnology 11, 607–609.
DOI:https://doi.org/10.1007/BF00360999 Nasseri, A.T., Rasoul-Amini, S., Morowvat, M.H and
Ghasemi, Y (2011). Single cell protein: Production and
Kawahata, M., Fujii, T and Iefuji, H (2007). Intraspecies process. American Journal of Food Technology 6, 103–116.
diversity of the industrial yeast strains Saccharomyces DOI:https://doi.org/10.3923/ajft.2011.103.116
cerevisiae and Saccharomyces pastorianus based on analysis
of the sequences of the Internal Transcribed Spacer ( ITS ) Ritala, A., Häkkinen, S.T., Toivari, M and Wiebe, M.G
regions and the D1 / D2 region of 26S rDNA. Bioscience, (2017). Single cell protein — state-of-the-art, industrial
Biotechnology, and Biochemistry 71, 1616–1620. landscape and patents 2001-2016. Frontiers in Microbiology
DOI:https://doi:10.1271/bbb.60673 8. DOI:https://doi:10.3389/fmicb.2017.02009
Kollar, R., Sturdik, E and Farkas, V (1991). Induction and Ross, P.J (1996). Taguchi techniques for quality
acceleration of yeast lysis by addition of fresh yeast engineering.McGraw-Hill Publishing Company Limited,
autolysate. Biotechnology Letters 13, 543–546. New York.
DOI:https://doi.org/10.1007/BF01033406
Senses-ergul, S., Reka, A., Agnes, B Tibor, D (2006).
Kumar, S., Stecher, G and Tamura, K (2016). MEGA7: Characterisation of some yeasts isolated from foods by
Molecular evolutionary genetics analysis version 7.0 for traditional and molecular tests. International Journal of Food
Bigger Datasets. Molecular Biology and Evolution 33, 1870– Microbiology 108, 120–124.
1874. DOI:https://doi:10.1093/molbev/msw054. DOI:https://doi:10.1016/j.ijfoodmicro.2005.10.014
Kurtzman, C.P., Fell, J.W., Boekhout, T and Robert, V Sugimoto, H (1974). Synergistic effect of ethanol and
(2011a). Methods for isolation, phenotypic characterisation sodium chloride on autolysis of baker's yeast for preparing
and maintenance of yeasts, pp. 87–110. In: Kurtzman, C.P., food-grade yeast extracts. Journal of Food Science 39, 939–
Fell, J.W and Teun B. (Ed.) The Yeasts, a Taxonomic Study. 942.
Elsevier Science Publishers.
DOI:https://doi.org/10.1016/B978-0-444-52149-1.00007-0 Tanguler, H and Erten, H (2008). Utilisation of spent
brewer' s yeast for yeast extract production by autolysis : The
Kurtzman, C.P., Fell, J.W and Boekhout, T (2011b). Gene effect of temperature. Food and Bioproducts Processing 86,
sequence analyses and other DNA-based methods for yeast 317–321. DOI:https://doi:10.1016/j.fbp.2007.10.015
species recognition, pp. 137–144. In: Kurtzman, C.P., Fell,
J.W and Teun, B. (Ed.). The Yeasts, a Taxonomic Study. Taran, M and Bakhtiyari, S (2013). Optimisation of single-
Elsevier Science Publishers. cell protein production from textile effluent at extreme
DOI:https://doi.org/10.1016/B978-0-444-52149-1.00010-0 conditions. Toxicological & Environmental Chemistry 95,
110–117.
Kurtzman, C.P and Robnett, C.J (1998). Identification and DOI:https://doi.org/10.1080/02772248.2012.745861
phylogeny of ascomycetous yeasts from analysis of nuclear
large subunit (26S) ribosomal DNA partial sequences. Theivendirarajah, K and Chrystopher, R.K (1987).
Antonie van Leeuwenhoek 73, 331–371. Microflora and microbial activity in palmyrah (Borassus
DOI:https://doi:10.1023/A:1001761008817 flabellifer) palm wine in Sri Lanka. World Journal of
Microbiology & Biotechnology 3, 23–31.
Kurtzman, C.P and Robnett, C.J (2003). Phylogenetic
relationships among yeasts of the 'Saccharomyces complex' Verduyn, C., Suksomcheep, A and Suphantharika, M (1999).
determined from multigene sequence analyses. FEMS Yeast Effect of high pressure homogenisation and papain on the
Research 3, 417–432. DOI:https://doi:10.1016/S1567- preparation of autolysed yeast extract. World Journal of
1356(03)00012-6 Microbiology & Biotechnology 15, 57–63.
DOI:https://doi.org/10.1023/A:1008818511497
Lapeña, D., Kosa, G., Hansen, L.D., Mydland, L.T., Passoth,
V., Horn, S.J and Eijsink, V.G.H (2020). Production and Villadsen, J and Nielsen, J (2011). Bioreaction Engineering
characterisation of yeasts grown on media composed of Principles. Springer Science and Business Media, Inc.
spruce ‑ derived sugars and protein hydrolysates from
chicken by products. Microbial Cell Factories 19 . Vukasinovic Milic, T., Rakin, M and Siler-Marinkovic, S
DOI:https://doi.org/10.1186/s12934-020-1287-6 (2007). Utilisation of baker's yeast (Saccharomyces
cerevisiae) for the production of yeast extract : effects of
different enzymatic treatments on solid , protein and
14 Vingnanam Journal of Science, Vol.16 (1), Jun 2021Mahilrajan et al. Yeast extract production from indigenous yeast carbohydrate recovery. Journal of Serbian Chemical Society 72, 451–457. DOI:https://doi:10.2298/JSC0705451V White, T., Bruns, T., Lee, S and Taylor, J.W (1990). Amplification and direct sequencing of fungal ribosomal RNA genes for phylogenetics, pp. 315–322. In: Innis, M.A., Gelfand, D.H., Sninsky, J.J and White, T.J. (Ed.) PCR Protocols. Academic Press, Inc. Zakhartsev, M and Reuss, M (2018). Cell size and morphological properties of yeast Saccharomyces cerevisiae in relation to growth temperature. FEMS Yeast Research 18, 1–16. DOI:https://doi:10.1093/femsyr/foy052. Vingnanam Journal of Science, Vol.16 (1), Jun 2021 15
You can also read