Spatial and temporal rainfall variability and erosivity: Case of the Issen watershed, SW- Morocco
←
→
Page content transcription
If your browser does not render page correctly, please read the page content below
E3S Web of Conferences 183, 02003 (2020)                                                              https://doi.org/10.1051/e3sconf/202018302003
I2CNP 2020

                      Spatial and temporal rainfall variability and
                      erosivity: Case of the Issen watershed, SW-
                      Morocco
                      Mohamed Ait Haddou1*, Belkacem Kabbachi1, Ali Aydda1, Hicham Gougni1, and Youssef
                      Bouchriti1
                      1
                       Geosciences and Environment Team (EGE), Department of Geology, Faculty of Sciences, Ibn Zohr
                       University, Agadir, Morocco

                                    Abstract.The Issen basin is a dry area affected by climate variability and
                                    desertification. It is located in high spot of Moroccan flora biodiversity that
                                    includes argan tree ecosystem as a part of the Western High Atlas (WHA).
                                    The objective of this work is to assess rainfall variability and erosivity as
                                    determining factors of soil erosion and vegetation cover degradation. The
                                    results reveal an arid to superior semi-arid climate where annual rainfall
                                    range from 200 mm in the centre of the Argana corridor, to 500 mm in the
                                    snow-covered northern foothills. The analysis of the 37 years of rainfall
                                    data indicate a coefficient of variation Cvis about67%. The erosivity index
                                    presents a high variability range from 34 to more than 81 MJ.mm/ha.h.yr
                                    in the wettest areas, indicating considerable soil erosion. In addition, the
                                    basin suffering from severe periods of drought due to the occurrence of the
                                    continuous decrease of the accumulated precipitation. Eventually, the
                                    rainfall variability and erosivity can affect ecosystem function and services
                                    (ecosystem degradation, water availability, etc).

                      1 Introduction
                      The Moroccan country characterized by three different climatic systems; the humid
                      Mediterranean and humid Atlantic climates in the north and the arid Saharan climate in the
                      south [1]. During the last decades, it was affected by a longest dry period which
                      characterized by rainfall decrease and temperatures increase [2]. In fact, 53% of the total
                      country was affected [3]. The rainfall decrease affects the vegetation cover growth,
                      especially, in the Moroccan High Atlas mountains [4].
                          The ecosystems and agriculture activities in the semi-arid areas principally depend on
                      the water availability [3]. In fact, the analysis of the rainfall data is crucial for assessing
                      current environmental constraints and for optimal management of the limited water
                      resources [5].In general, the climate change amplify existing risks and generate new ones
                      for natural and human systems [6].
                          The Issen basin is the largest sub-basin in the right bank of the Souss river which covers
                      an area of 1302 km² (fig. 1). The Issen river is the most important tributary descending
                      from the Western High Atlas (WHA), and it is a part of the Argana corridor and its annexed

                      *Correspondingauthor:medaithaddou@gmail.com

© The Authors, published by EDP Sciences. This is an open access article distributed under the terms of the Creative Commons Attribution License 4.0
(http://creativecommons.org/licenses/by/4.0/).
E3S Web of Conferences 183, 02003 (2020)                                                  https://doi.org/10.1051/e3sconf/202018302003
I2CNP 2020

                    valleys considered as a suitable area to characterize rainfall instability in the High Atlas
                    Mountains [7]. Geologically, the basin cover all Permo-Triassic red sandstone, detrital
                    sandstone and conglomeratic silty sandstone Formations, which including at least 2500 m
                    of fluvial, lacustrine and clastic deposits and coarse to fine floodplains [8]. Based on the
                    national soil map database (EuDASM) [9], the red mountain forest soils and the brown and
                    red lightly forested podzolic soils with very heterogeneous vegetation coverare developed
                    on the Triassic Formations. The depression between the ancient massif and the western
                    plateaus creates a natural passageway for the air currents which developing a particular and
                    complex climatic conditions [10].

                    Fig. 1. Study area location.
                    Topographically, the study area is a sloped land (the average slope is about 33%). In
                    addition, the study area is a fragile environment influenced by the pedoclimatic hazards and
                    the frequency of atmospheric disturbances, which affectingthe vegetation distribution (Fig.
                    2). Also, the study area is characterized by the presence of the argan steppes. Due to the
                    climatic aggressiveness andthe high anthropogenic pressure, the High Atlas mountains and
                    the Issen basin as a part of it suffering from water erosion risks, including soil degradation
                    and flooding [11, 12].
                       The vegetation cover in the Issen basin includes the argan tree (Arganiaspinosa)
                    ecosystems, which is considered as a natural, national and universal heritage, associated
                    with endemic or rare plants serving several applications; aromatic, medicinal, melliferous
                    and pastoral [13].

                                                                 2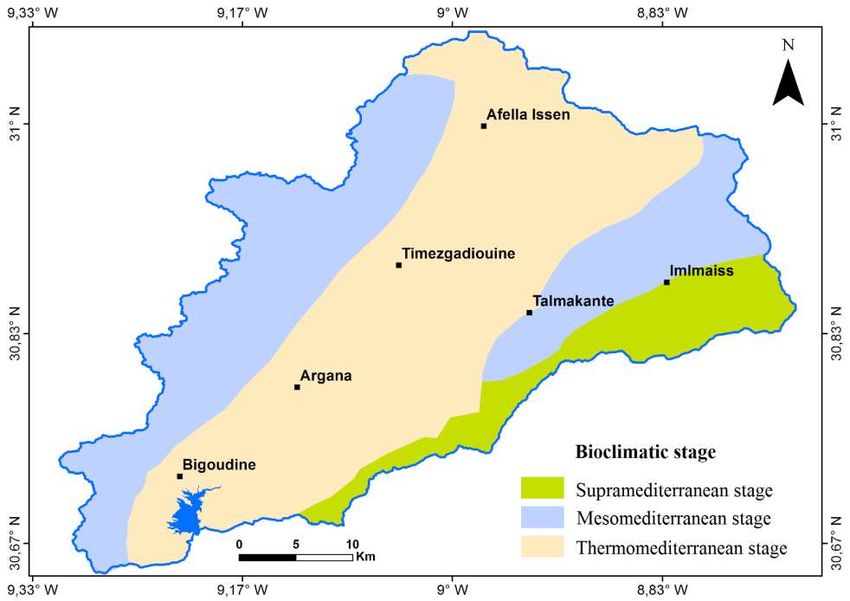
E3S Web of Conferences 183, 02003 (2020)                                                     https://doi.org/10.1051/e3sconf/202018302003
I2CNP 2020

                    Fig.2.Map shows the bioclimatic zones in the Issen basin [14].
                    The present study aims to analyse the contemporary spatial and temporal variability of
                    rainfall and its associated risk responsible of the soil degradation. Practically, we calculated
                    simple and combined climatic indices commonly used in Mediterranean countries as a
                    useful metric parameters to describe the climat
                                                                climate variability. In fact, the climate variability
                    may induces perenity of the remarkable endemic flora species and the water resources
                    stored in the dams that ensuring the drinking water supply for the Agadir metropolis (9.5
                    Mm³) and the agricultural irrigation for the IsIssen perimeter (13,000 ha) [15]. Moreover, we
                    mapped the spatial distribution of rainfall and the erosivity in order to determine the
                    susceptible areas to water erosion which will be helpful to manage the erosion risks.

                    2 Materials and methods

                    2.1 Data availability

                    Climatic data were obtained from the regional climate dataset compiled by the Souss
                    Massaand Tensift Hydraulic Basin Agencies ies (ABH) and the stations under control of the
                    South-West and High Atlas HCEFLCD (Tab. 1 and 2). The collected rainfall data covering
                    the period of 37 to 50 years. In this study, we analyzed the data covering a satisfactory
                    number of years without missing data.

                                                                    3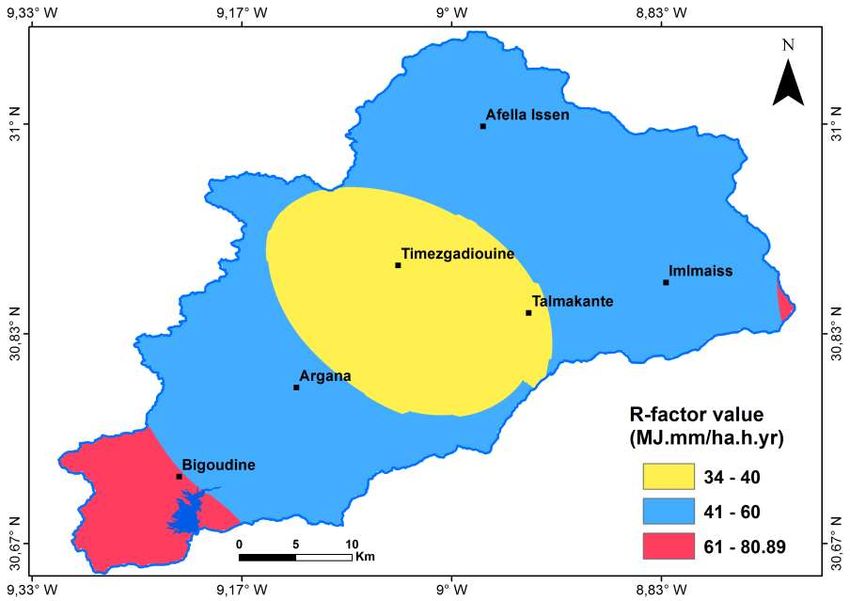
E3S Web of Conferences 183, 02003 (2020) https://doi.org/10.1051/e3sconf/202018302003
I2CNP 2020
Table 1.Characteristics of the rainfall stations in the Issen basin and adjacent zones.
(ABH, DREFLCD)
Distance to Annual
Lng. °E Lat.°N Altitude
Station the ocean Rainfall
X Y Z (m)
(Km) (mm)
A.Elmoumen dam -9.190 30.670 635 49 402.05
Aguenza -9.153 30.751 720 57 253.47
Argana -9.122 30.778 771 61 349.66
Amsoul -9.069 30.842 871 70 193.77
Tizguine -9.120 30.918 1329 67 236.63
Iloudjane -8.801 31.183 789 98 332.15
Aghbar WHA -8.367 30.880 1750 130 537.40
TiziOu-Maacho -8.968 31.058 1580 84 465.48
Ikakern -8.975 30.832 1100 79 222.73
Timlilt -9.139 31.033 1350 67 344.00
Dkhila dam -9.285 30.569 232 44 307.67
Ain Asmama -9.286 30.773 1600 50 473.72
Immouzzer -9.400 30.670 1199 27 540.78
Table 2.Statistical characteristics of the precipitations (mm) in the Issen basin and the adjacent zones
(ABH, DREFLCD). A.R: Annual rainfall, S.Div: Standard deviation, Cv: Coefficient of variance, and
Q: Quartel
AinAsmama
A.Elmomen
Dkhila dam
Immouzzer
Iloudjane
Tizguine
Tizi-Ou-
Maacho
Ikakern
Agunza
Amsoul
Aghbar
Argana
Timlilt
HAO
dam
Sep. 11.57 4.48 9.96 5.16 13.75 10.45 20.50 12.33 7.43 24.6 5.07 25.12 9.16
Oct. 27.52 21.99 27.29 19.26 17.92 35.79 50.10 41.34 24.29 33.83 23.65 40.57 62.78
Nov. 78.20 46.53 54.52 31.43 29.83 36.13 73.90 59.23 52.16 25.89 57.95 82.52 85.34
Dec. 98.97 54.98 84.40 31.58 52.75 37.12 81.90 76.40 22.21 67.36 72.86 75.13 99.07
Jan. 40.47 29.12 45.76 29.36 33.25 41.82 105.90 55.30 34.67 31.69 36.16 76.52 89.17
Feb. 65.18 36.12 61.90 25.57 40.79 39.54 58.20 66.88 24.62 42.91 41.89 71.46 83.17
Mar. 48.90 36.09 41.87 27.00 20.46 46.02 88.90 66.18 33.63 40.21 46.60 53.96 63.21
Apr. 19.65 12.90 15.55 11.85 15.21 44.38 29.70 54.58 15.76 50.36 13.86 32.69 36.19
May 8.37 4.99 5.04 5.27 2.33 20.85 15.90 17.11 2.90 16.07 7.46 8.67 10.42
Jun. 0.99 3.00 1.13 1.07 2.42 11.17 4.70 4.20 0.67 2 0.48 2.73 1.58
Jul. 0.78 0.74 1.20 2.38 0.67 3.03 2.80 1.18 0.18 0.29 0.08 0.98 0.13
Agu 1.44 2.80 1.05 3.84 7.25 5.86 4.90 10.75 4.22 8.80 1.63 3.36 0.57
A.R. 402.06 253.74 349.66 193.77 236.63 332.15 537.4 465.48 222.73 344 307.67 473.72 540.78
Min 33.8 45 70.3 85 167 145.1 134 195.7 69 219.2 38.7 154.2 154.4
Max 1474.7 946 1801 485 314 519.1 1220.5 1109.2 635.5 512 928.2 977.1 1055.6
S.Div 263.9 195.03 332.65 100.98 60.37 100.94 304.01 330.078 155.17 78.13 220.83 224.34 248.31
Cv (%) 65.00 76.86 95.14 52.11 25.51 30.39 56.57 70.91 69.67 22.71 71.77 47.36 45.92
Q1 140.60 118.00 144.30 134.33 167.50 244.40 422.43 202.23 96.20 288.29 144.13 279.20 290.15
Q2 361.05 223.00 268.40 201.00 236.63 332.15 564.45 322.75 214.15 351.21 255.45 446.90 401.00
Q3 474.40 315.50 400.63 269.75 301.50 244.40 819.27 676.78 282.25 401.60 255.45 555.85 585.75
4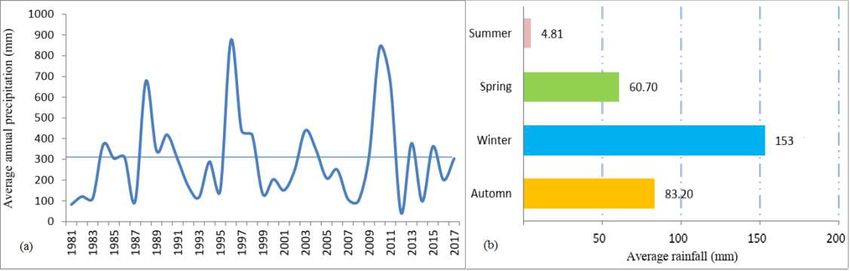
E3S Web of Conferences 183, 02003 (2020)                                                                    https://doi.org/10.1051/e3sconf/202018302003
I2CNP 2020

                                The temperature is essential data because it is influences the spatial distribution of the
                                vegetation. Table 2 shows the maxima (M), minima (m) and monthly means (Tm) of
                                temperatures in °C of the three stations.

                                      Table 2.Thermal characteristics of the Abdelmomen, Argana and Immouzzerstations.

                 Stat                Para-
                                     meter   Ja.    Fe.    Ma.    Ap.    Ma.    Jun    Jul.   Ag.    Sp.     Oc.    Nv.    De.    Mean
                 ion
                                     M       25.4   22.8   24.2   28.5   28.6   34.2    39    38.4   33      32.1   29.4   27     30.22
               Imm. Argana Abdelm.
                           dam (1)

                                     M        9.5   11.8    13    15.7   16.7   20.6   25.4   25.6   21.8    19     16     11     17.18
                                     Tm      17.5   17.3   18.6   22.1   22.7   27.4   32.2   32     27.4    25.6   22.7   19     24.25
                                     M       18.8   21.2   24.4   27.3   29.9   32.8   40.6   41.8   36.6    30.6   24.7   19.6   29.03
                                      m       1.9   3.4     5.5    7.3    9.4   14.9    15    16     13.3    10.4   6.8    2.8    8.89
               (13) (3)

                                     Tm      10.4   12.3    15    17.3   19.7   23.9   27.8   28.9   25      20.5   15.8   11.2   21.85
                                     M        14     16     19     21    23     29      34    32     27      22     18     16     22.58
                                      m       5       6      8      9    10     14      21    19     16      12     9      7      11.33
                                     Tm      9.5     11    13.5    15    16.5   21.5   27.5   25.5   21.5    17     13.5   11.5   19.5

                                2.2 Data preprocessing
                                First, based on the monthly and annual averages of the collected rainfall data the missed
                                values was deduced in order to complete datasets. Secondly, the monthly and annual
                                averages were also used to calculate the climate indices (seasonal regime, monthly drought,
                                deviation-to-mean index (Em), Standardized Precipitation Index (SPI) and rainfall erosivity
                                (R-factor)). Finally, all the annual averages of precipitation and R-factor values were
                                integrated and analyzed in a GIS tool. In fact, mapping rainfall distribution and erosion risk
                                areas was achieved using interpolation krigging method.

                                2.3 Rainfall variabilityand trends

                                The rainfall deficit, the extent of the drought and its intensity were evaluated using
                                thefollowingindices:

                                2.3.1Monthly drought

                                The monthly drought have been assessed based on the total rainfall (P) and the average
                                monthly temperature (T). [16] reported that a month be dry if P ≤ 2T. In other hand, [17]
                                indicated that if P < 3T or P < 4T the month is dry.

                                2.3.2 Deviation-to-mean index (Em)

                                Emis the most used index to estimate the rainfall deficit [18,19] (equation 1). It is positive
                                for wet years and negative for dry years.

                                                                         Em = Xi – Xm(1)

                                Where: Xi is the cumulative rainfall for year i, and Xm is the mean annual precipitation

                                                                                 5
E3S Web of Conferences 183, 02003 (2020)                                                      https://doi.org/10.1051/e3sconf/202018302003
I2CNP 2020

                    2.3.3 Standardized Precipitation Index (SPI)

                    The Standardized Precipitation Index (SPI) was developed by Mckee et al. [20]. The SPI
                    have been used to verify humid periods as well as dry periods according to equation 2.

                                                        SPI = (Xi - Xm) / Si(2)

                    Where: Xi is the cumulative rainfall for year i, Xm is the mean annual precipitation, and Si
                    is the standard deviation of the time series annual rainfall.
                    Effectively, several studies have been used the SPI and defined the different classes of
                    drought severity [5,18,19,21]. The negative annual values indicate a dryperiod and positive
                    values indicate a humid period (Tab. 3).

                                           Table 3.Drought degree according toSPI by [5,18,21].

                                           Drought degree (Class)               SPI Value
                                               Extreme humid                      SPI >2
                                                Severe humid                   1.5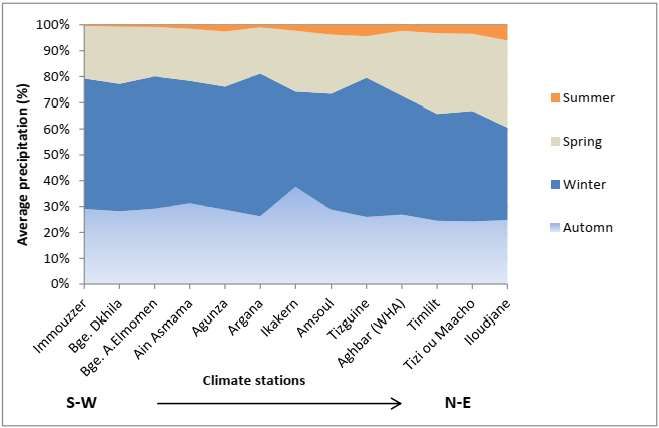
E3S Web of Conferences 183, 02003 (2020)                                                            https://doi.org/10.1051/e3sconf/202018302003
I2CNP 2020

                    basin. The rainfall ranges from 100 to 350 mm/year in the Timzgadiouine and Argana basin
                    because they are well protected by the high plateaus of the Ida-ou-Bouzia and Ida-ou-
                    Tanana which brock up the oceanic effects..Furthermore, due to its high altitude, the ancient
                    WHA massif (the snow-covered
                                             covered northern foot
                                                              foothills and the Ida-Ou-Tanan plateaus) receives
                    an average precipitation more than 400 mm/year.

                    Fig. 3.Spatial distribution of the average
                                                        verage annual precipitation in the Issen basin.

                    During the period 1980-2017
                                              2017 (fig. 4a), the arithmetic mean of rainfall is 302 mm/year,
                    associated with a coefficient of variation Cv = 51% during the 37 years, which reflect a
                    great fluctuation and variability of rainfall. The most remarkable peaks are at 86/87, 95/96
                    and 09/10 which represent the wettest years, while the peakat2011/12 represents the driest
                    year. The whole basinreceives an average of 141 mm at winter and half at autumn and
                    spring. However, dry season is summer during it the basin receives the minimum amount
                    of the annual precipitation (Fig. 4b).
                    The spatial and temporal precipitation variability may affects vegetation development,
                    which increasing soil erosion and then environment degradation [26].

                    Fig. 4. (a) Interannual variation of rainfall from 198
                                                                       1980 to 2017, (b) distribution of average seasonal
                    precipitation in the Issen basin

                                                                        7
E3S Web of Conferences 183, 02003 (2020) https://doi.org/10.1051/e3sconf/202018302003
I2CNP 2020
3.1.2 Seasonal regime and monthly drought
Table 4 resumes the seasonal regime in the Issen basin. The winter season is the wettest,
which represents 50% of the annual total. The maximum winter rainfall is about 271 and
246 m observed in the Immouzzer and Aghbar stations, respectively. The summer season
is the driest, which represents only 1 to 6% of the annual total.
Table 4. Seasonal regime recorded in the studied stations
Automn Winter Spring Summer
Precipitation Seasonal
Stations S-O-N D-J-F M-A-M J-Jl-A
(mm) regime
M2 (mm) M1 (mm) m1 (mm) m2 (mm)
540.78 157.28 271.41 109.82 2.3
Immouzzer WASS
(100%) (29%) (50%) (20%) (0.5%)
Dkhila dam 307.69 86.67(28) 150.91 (49) 67.92(22) 2.19 (1) WASS
Abdelm. dam 402.04 117.29(29) 204.62(51) 76.92 (19) 3.21 (1) WASS
Ain Asmama 473.72 148.21 (31) 223.11 (47) 95.32 (20) 7.07 (2) WASS
Agunza 253.74 73.00 (29) 120.22 (47) 53.98 (21) 6.54 (3) WASS
Argana 349.67 91.77 (26) 192.06 (55) 62.46 (18) 3.38 (1) WASS
Ikakern 222.74 83.88 (38) 81.5 (37) 52.29 (23) 5.07(2) WASS
Amsoul 193.77 55.85(29) 86.51 (45) 44.12 (23) 7.29 (4) WASS
Tizguine 236.63 61.50 (26) 126.79 (54) 38 (16) 10.34 (4) WASS
AghbarWHA 537.4 144.5 (27) 246 (48) 134.5 (25) 12.4 (2) WASS
Timlilt 344.01 84.32 (25) 141.96 (41) 106.64 (31) 11.09 (3) WSAS
T.o.Maacho 465.48 112.90 (24) 198.58 (43) 137.87 (30) 16.13 (3) WSAS
Iloudjane 332.16 82.37 (25) 118.48 (36) 111.25 (33) 20.06 (6) WSAS
N.B.: Values in brackets indicate seasonal rainfall rates (%).
The seasonal regime was defined to classify the seasons in descending order of
precipitation.The seasonal rainfall regime in the majority of the basin is of the WASS type
(Winter-Automn-spring and summer). All the stations representing a summer deficit (m2)
and a winter maximum (M1) are subject to the "Soussien" currents in the south-west. The
only exceptions are the very northern stations, Timlilt, T.O.Maacho and Iloudjane, that are
WSAS type (winter-spring-automn and summer), which show a second maximum (M2) in
spring as opposed to autumn and are subject to the "Haouzien" currents of the north-east
(Fig. 5). The transition between the two types of regimes occurs in the high basin of Issen
at the upstream of the Tizguine station.
8E3S Web of Conferences 183, 02003 (2020) https://doi.org/10.1051/e3sconf/202018302003
I2CNP 2020
Fig. 5. Seasonal rainfall variation from SW to NE of the Issen river basin.
The ombrothermal diagrams for three stations show that the whole basin is characterized by
a drought season lasting 5 to 7 months and a thermal amplitud
amplitude characterizing semi-
continental conditions (cold winter - very hot summer). According to the
Embergerclimagram, the study stations are located in the arid bioclimatic zone with a
temperate winter and in the semi-arid
arid bioclimatic zone with a cold to worm winter.
3.1.3 Deviation-to-mean index (Em)
The results show very unequal spatial and temporal variation of the drought frequency,
normal and wet years. The stations of Tizi
Tizi-Ou-Maacho, Ikakern, Tizguine(upstream part)
and Dkhila(downstream part) present an average of drought years of more than 55%, which
indicates a tendency to a dryness. The stations of Argana, Abdelmomen, Aguenza, Ain
asmama and Immouzzer recorded annual averages of normal rainfall over 20 years.
However, a limited number of the stations receive
receivesannual totals above the habitual average
with a frequency of wet years over 35%. We notice that more than 40% of the years are
droughty (tab.5). The long period of drought in the study area may affect the vegetation
growth and development.
Table 5.Frequency of drought,, normal and hu
humid years during 1980-2017
Stations “DroughtYear” “ NormalYear” “ HumidYear”
(%) (%) (%)
Immouzzer 19.75 62.96 17.28
BgeDkhila 57.14 7.14 35.71
Bg. A.elmoumen 15.15 75.76 9.09
Ain Asmama 18.18 64.94 16.88
Aguenza 20.59 73.53 5.88
Argana 12.94 81.18 5.88
Amsoul 27.03 59.46 13.51
Ikakern 58.62 10.34 31.03
Tizguine 56.25 25.00 18.75
Aghbar 50.00 10.71 39.29
TiziOuMaacho 66.67 6.67 26.67
9E3S Web of Conferences 183, 02003 (2020) https://doi.org/10.1051/e3sconf/202018302003
I2CNP 2020
Timlilt 51.43 17.14 31.43
Iloudjane 34.62 53.85 11.54
Mean 40.70% 45.72% 21.91%
3.1.4 Standardized Precipitation Index (SPI)
Table 6 shows the results of the SPI. For all decennia, normal conditions prevailed in more
than 60% of cases over drought and moisture conditions. The interval period 2010-2017 is
still the driest, with moderate or severe drought manifesting in 37.46% of the cases and in
18 to 27% of the cases over the other interval periods 1980-89, 1990-99 and 2000-09. The
common drought years are 2000/01 and 2001/02. We also observe that during the 37 years,
26% of the years are fairly, dry and 13% are humid. For all stations the rainfall continues to
be deficient proving moisture deficit. Labbaci [18] reported a cumulative deficit of 3927.25
mm during a mean of 25 years in the Site of Biological and Ecological Interest (SBEI) of
Ain Asmama(equivalent to an annual deficit of 133mm for the dry period).
Table 6. Frequencies (% of stations/years) of the Standardised Precipitation Index (SPI)
Moderatedrouhgtperiod Severedroughtperiod
Droughtdegree 1980-2017
1980-1989 1990-1999 2000-2009 2010-2017
Extremehumid 0.17 0.20 0 12.4 3.19
Severehumid 9.01 1.00 1.12 0 2.78
Moderatehumid 10.05 9.13 9 0 7.04
Near normal 61.59 70.35 69.33 50.15 62.64
Moderatedrouhgt 19.18 18.23 18.20 25.32 20.23
Severedrought 0 1.10 2.31 12.00 4.81
Extremedrought 0 0 0 0 0
Total 100 100 100 100 100
Figure 6 shows that the Issen Basin has suffered from dry episodes during 1981, 1986,
1992, 1998, 2002, 2006, 2012 and 2014-2017. The analysis of these results indicates a
higher frequency of drought years in comparison to the humid years. In addition, the annual
droughts occur once or twice every 10 years. In other hands, the drought that lasting 5 years
may return after 360 years [27].
10E3S Web of Conferences 183, 02003 (2020) https://doi.org/10.1051/e3sconf/202018302003
I2CNP 2020
Fig. 6. Standardised Precipitation Index (SPI) in the Issen basin during the period 1980-
2017
3.2 Rainfall ErosivityR-Factor
The R-factor considering the role of precipitation for soil erosion modelling: The obtained
results show an ascending gradation of values with topography (Fig.6& tab.6). The
erosivity of rainfall naturally progresses from downstream to upstream of the Issen basin. R
values vary between 34 and 80.89 MJ.mm/ha.h.yr with an average of 47 MJ.mm/ha.h.yr. 79
% of the total area of theIssen basinhave have R values over 41 MJ.mm/ha.h.yr which
contributes to soil
oil loss exceeding the tolerance threshold (10
(10.4 t/ha/yr)[28]. The low values
of R (21 to 40 MJ.mm/ha.h.yr) are situated in the cent center of the Argana corridor which
includes the two topographic basins of Bigoudine and Timzgadiouine, subject to arid
climate. The high values (>61 MJ.mm/ha.h.yr) are attrib
attributed to the plateaus region and Ida-
Mahmoud valley,, under strong oceanic influence or at high al altitudes.
A recent study based on pollen in the marine sediment of the southwest Morocco reported
the impact of the climate change and anthropogenic activities on the argan tree ecosystem
and soil degradation [1].
11E3S Web of Conferences 183, 02003 (2020) https://doi.org/10.1051/e3sconf/202018302003
I2CNP 2020
Fig. 7.Spatial distribution of rainfall erosivity (R-factor)
Table7. Conceptual scale for assessing the Fournier index [29]
Soil Loss Fournier Index Area
Class Erosion risk
(t/ha/yr) (MJ.mm/ha.h.yr) (%)
1 200 > 100 Extremely Severe 0
4 Conclusions and recommendations
The study investigated the indicators of drought and climatic aggressiveness in the Issen
basin in order to characterize the spatial and temporal variability of precipitation and
evaluate the rainfall erosivity. In fact, the record data collected from 13stations over the
study area covering the period 1980-2017 were analyzed using a GIS tools. Thefindings
revealed that almost all the studied stations recorded a rainfall below 500 mm with an
arithmetic mean of 302 mm over the whole basin. The record data of 10 stations
(WASStype) reflecting a high aridity and inter-annual and seasonal variability in the study
area. In detail, the aridity extends from the beginning of April to the end of October and the
dry season duration is about six to seven months per year. Furthermore, the dry periods
have been more frequent and remarkable in recent years than humid periods.The analysis of
precipitation variabilityusing standardized precipitation index (SPI) indicates moisture
deficit.In fact, 70% of the study area is affected by moderate rainfall erosivity which is
responsible of ecosystem degradation.
12E3S Web of Conferences 183, 02003 (2020) https://doi.org/10.1051/e3sconf/202018302003
I2CNP 2020
The occurrence of a succession of drought, climate events and the rainfall aggressiveness,
especially, during the last decade threaten water security, the resilience of the argan trees
ecosystem (southwest part of the basin), the quality of the soil and the agricultural
sustainability in the study area. In fact, the soil erosion problem can be solved by
constructing other dam in the upstream part of the basin which is the most part affected by
water erosion. The action will also conserve drinking and irrigation water resources. In
addition, it is recommended to regenerate the natural forests such as the argan forest, which
is will be helpful to reduce the climate vulnerability. Moreover, extending and serving the
researches continuity in the whole area of the Western High Atlas (WHA) can be helpful to
figure out the precipitation trend.
References
[1] X. Zhao, L. Dupontet,& al., Recent climatic and anthropogenic impacts on endemic
species insouthwestern Morocco. Quaternary Science Reviews Volume 221, 1 October
2019, 105889 (2019)https://doi.org/10.1016/j.quascirev.2019.105889
[2] L. Stour, &A. Agoumi, Sécheresseclimatique au Marocdurant les dernièresdécennies
[Climatic Drought in Morocco During the Last Decades]. Hydroécol. Appl., 16: 215–
232. (2009)https://doi.org/10.1051/hydro/2009003
[3] M. Hssaisoune, L. Bouchaou, A. Sifeddine, I. Bouimetarhan, & A. Chehbouni,
Moroccan Groundwater Resources and Evolution with Global Climate Changes.
Geosciences, 10(2), 81. (2020)https://doi.org/10.3390/geosciences10020081
[4] S. Hammi, V. Simonneaux, M. Alifriqui, L. Auclair,& N. Montes, Evolution des
recouvrementsforestiers et de l'Occupation des sols entre 1964 et 2002 dans la haute
vallée des Ait Bouguemez (Haut Atlas Central, Maroc). Impact des modes de gestion.
Science etchangementsplanétaires/Sécheresse, 18, 271-277. (2007)
https://doi.org/10.1684/sec.2007.0101
[5] C. Faye,A. A. Sow, &J. B. Ndong, Étude des
sècheressespluviométriquesethydrologiques en Afriquetropicale: caractérisation et
cartographie de la sècheresse par indices dans le haut bassin du fleuveSénégal. Physio-
Géo. Géographie physique etenvironnement, (Volume 9), 17-35.
(2015)https://doi.org/10.4000/physio-geo.4388
[6] GIEC,Changementsclimatiques, «Rapport de synthèse» : Contribution des Groupes de
travail I, II et III au cinquième Rapport d’évaluation du
Grouped’expertsintergouvernementalsurl’évolution du climat.GIEC, Genève, Suisse,
161p, (2014)
[7] M. Alifriqui, O. M'hirit, R. Michalet,& J. P. Peltier, Variabilité des précipitationsdans
le Haut Atlas Occidental marocain. Le climat, 13(1), 11-28. (1995)
[8] P.E. Olsen, D.V. Kent, M. Touhami, & J. Puffer, Cyclo-magneto and bio-stratigraphic
constraints on the duration of the CAMP event and its relationship to the Triassic–
Jurassic boundary. In: Hames, W. E., McHone, G., Renne, P. R. &Ruppel, C. (eds) The
Central Atlantic Magmatic Province: Insights from Fragments of Pangea. AGU,
Geophysical Monographs, 136, 7–32, (2003)https://doi.org/10.1029/136GM02
[9] P. Panagos, A. Jones, C. Bosco, & P.S Kumar, European digital archive on soil maps
(EuDASM): preserving important soil data for public free access. International Journal
of Digital Earth 4, 434–443, (2011)https://doi.org/10.1080/17538947.2011.596580
[10] B. Jaafar, Etude phytoécologiqueetmorphobotaniqued’une enclave sèche du Haut Atlas
occidental Marocain (couloir d’Argana). Thèsedoctorat national, Univ. Cadi Ayyad,
Fac. Sci. Semlalia, Marrakech 241p. (1994)
13E3S Web of Conferences 183, 02003 (2020) https://doi.org/10.1051/e3sconf/202018302003
I2CNP 2020
[11] E.A. El Morjani, M. SeifEnnasr,VA. Elmouden, S. Idbraim, B. Bouaakaz, &A. Saad,
Flood Hazard Mapping and Modelling using GIS applied to the Souss River watershed.
R. ChoukrAllah et al. (eds.), the Souss-Massa River Basin, Morocco. «Chapter part of
the series The Handbook of Environmental Chemistry pp 1-30», DOI
10.1007/698_2016, Springer International Publishing Switzerland. ungauged
Mediterranean catchments. Energy Procedia18: 934-943, (2016)
[12] B. Bouaakkaz, Z.E.A. El Morjani, L. Bouchaou, & H. Elhimri, Flood risk management
in the Souss watershed, E3S Web of Conferences 37, 04005 (2018), published by (EDP
Sciences, 2018)https://doi.org/10.1051/e3sconf/20183704005
[13] A. Benabid, & Y. Melhaoui, Écosystèmesnaturels à arganier (Arganiaspinosa),
patrimoine national etuniversel: Bio-écologie, phytosociologie, phytodynamique et
ethnobotanique; Restauration et certification. Actes du 1er congrès international de
l’Arganier (ages 39-47). Agadir, Maroc, (2011)
[14] A. Benabid, Floreetécosystèmes du Maroc. Evaluation etpréservation de la
biodiversité. Ibis Press, Paris. (2000)
[15] ABHSM, Optimisation de la gestion de ressources en eau dans le bassin du Souss
Massa. Colloquesur la gestion des ressources en eau, mai (2005)
[16] Fr.Bagnouls&H. Gaussen, Les climatsbiologiquesetleur classification. Annales de
géographie. Vol. 66. No. 355. Armand Colin, (1957)
[17] F. Lebourgeois,& C. Piedallu,.Appréhender le niveau de sécheressedans le cadre des
étudesstationnelleset de la gestionforestière à partird'indicesbioclimatiques. Revue
forestièrefrançaise. (2005)
[18] A. Labbaci, Thèsedoctorat national, Univ. IbnZohr, Fac. Sci. Agadir, p.237, (2013)
[19] I. Jouilil, K. Bitar, H. Salama,&al., Sécheressemétéorologique au bassinhydraulique
OUM ER RBIA durant les dernièresdécennies. LARHYSS Journal P-ISSN 1112-
3680/E-ISSN 2602-7828, 2013, no 12. (2013)
[20] T.B. Mckee, N.J. Doesken,& J. Kleist, The relationship of drought frequency and
duration to time scale. Actes de la 8th Conference on Applied Climatology (Anaheim,
Californie), p. 179-184. (1993)
[21] A.Ali,&T.Lebel, The Sahelian standardized rainfall index revisited. International
Journal of Climatolology, vol. 29, p. 1705-1714.(2009)https://doi.org/10.1002/joc.1832
[22] K.Meusburger, A.Steel,P.Panagos, L.Montanarella, &C.Alewell, Spatial and temporal
variability of rainfall erosivity factor for Switzerland. Hydrology and Earth System
Sciences, 16, 167-177. (2012) https://doi.org/10.5194/hess-16-167-2012
[23] L.C. Brown&G.R.Foster, Storm erosivity using idealizedintensity distributions,
Transactions of the Asae, 30, 379–386, (1987).
[24] W. H. Wischmeier,& D. D. Smith, Predicting rainfall erosion losses: A guide to
conservation planning. In: USDA Agriculture Handbook 537. Washington, DC: U.S.A,
Government Printing Office. (1978)
[25] H.M.J. Arnoldus, An approximation of the rainfall factor in the Universal Soil Loss
Equation. In M. deBoot and D. Gabriels (eds), Assessment of erosion. Wiley,
chichester. (1980)
[26] R. Cheddadi, M. Nourelbait,O.Bouaissa, J.Tabel, A. Rhoujjati, J. A.López-Sáez,... ,&
H. Lamb, A history of human impact on Moroccan mountain landscapes. African
Archaeological Review, 32(2), 233-248. (2015) https://doi.org/10.1007/s10437-015-
9186-
14E3S Web of Conferences 183, 02003 (2020) https://doi.org/10.1051/e3sconf/202018302003
I2CNP 2020
[27] A. AGOUMI, Ressources en eau et bassins versants du Maroc : 50 ans de
développements (1955-2005), pp. 61. (2006)
[28] Y.Ostovari,A.A. Moosavi, &H.R. Pourghasemi, Soil loss tolerance in calcareous soils
of a semiarid region: evaluation, prediction, and influential parameters. Land
Degradation & Development.1–12. (2020)https://doi.org/10.1002/ldr.3597
[29] K. Oduro-Afriyie, Rainfall erosivitymapforGhana. Geoderma74, 161–166. (1996)
15You can also read