Jockey Career Length and Risk Factors for Loss from Thoroughbred Race Riding - MDPI
←
→
Page content transcription
If your browser does not render page correctly, please read the page content below
sustainability

Article
Jockey Career Length and Risk Factors for Loss from
Thoroughbred Race Riding
Kylie Legg 1, * , Darryl Cochrane 2 , Erica Gee 1       and Chris Rogers 1,3
 1    School of Veterinary Science, Massey University, Private Bag 11-222, Palmerston North 4442, New Zealand;
      E.K.Gee@massey.ac.nz (E.G.); C.W.Rogers@massey.ac.nz (C.R.)
 2    School of Sport, Exercise and Nutrition, Massey University, Private Bag 11-222, Palmerston North 4442,
      New Zealand; D.Cochrane@massey.ac.nz
 3    School of Agriculture and Environment, Massey University, Private Bag 11-222, Palmerston North 4442,
      New Zealand
 *    Correspondence: k.legg@massey.ac.nz

 Received: 24 August 2020; Accepted: 9 September 2020; Published: 10 September 2020

 Abstract: Professional thoroughbred racing jockeys repeatedly work close to physiological capacity
 during races, whilst maintaining low body weights, on a daily basis with no off-season. The effects
 of this on their career length is unknown. The aim of this study was to examine the career lengths
 and reasons for loss from the industry of 674 jockeys and apprentices who rode over 14 racing
 seasons and 421,596 race day starts in New Zealand. Descriptors were compared between jockeys in
 short (1–2 years), middle (3–9 years) and long (>10 years) career cohorts with descriptive statistics
 and Kaplan–Meier survival curves. The median career length for jockeys was 2 years (IQR 1–6).
 Long career cohort jockeys (11%) had lower carried weights (IQR 56–57 kg, p = 0.03), 40 times the
 median number of rides per season (248, IQR 61–434, p < 0.001), half the rate per 1000 rides of falling
 (1.1, 95% CI 1.0–1.2, p = 0.009) and 1.3 times the rate of winning (100, 95% CI 99–101, p < 0.01) than
 jockeys in the short career cohort. Jockeys who rode over 200 races per season had careers three
 times longer than jockeys with fewer races per season (p < 0.001). Half of the 40% of jockeys who
 failed to complete their apprenticeship were lost from the industry in their first year of race riding.
 In conclusion, most jockeys had short careers where the workload of a jockey and their ability to
 obtain rides had greater impact on career longevity than their performance.

 Keywords: horse; thoroughbred racing; jockey; career; risk factors; equestrian athlete

1. Introduction
     Thoroughbred racing is a major international sport in which jockey and horse work together,
racing at speeds exceeding 60 km h−1 [1]. During races, the jockey is positioned over the withers of the
horse in a crouched forward stance, in a state of continuous quasi-isometric movement—an activity
that is extremely physically demanding [2,3]. Jockeys exercise close to their physiological capacity
during a race [2,3]. At the same time, in order to meet the weight allocated to the horse to carry during
a race, they must maintain a consistently low body mass year-round [1].
     Professional jockeys may ride in flat or jumps races. Flat races are shorter than jumps races,
occur year-round and comprise 96% of the total number of races in New Zealand, whereas jumps
(hurdle and steeplechase) races occur only during the winter season and include up to 25 obstacles [4].
Races in New Zealand operate with minimum riding weights, facilitated by a handicapping system to
enable equal competition, based on ratings assigned to each horse. Rating (flat, hurdles or steeples) is
a dynamic measure of a horse’s performance and is recalculated within two days of a horse’s most
recent race start. Higher rated (better performing) horses are assigned higher weights [5]. At present,

Sustainability 2020, 12, 7443; doi:10.3390/su12187443                       www.mdpi.com/journal/sustainability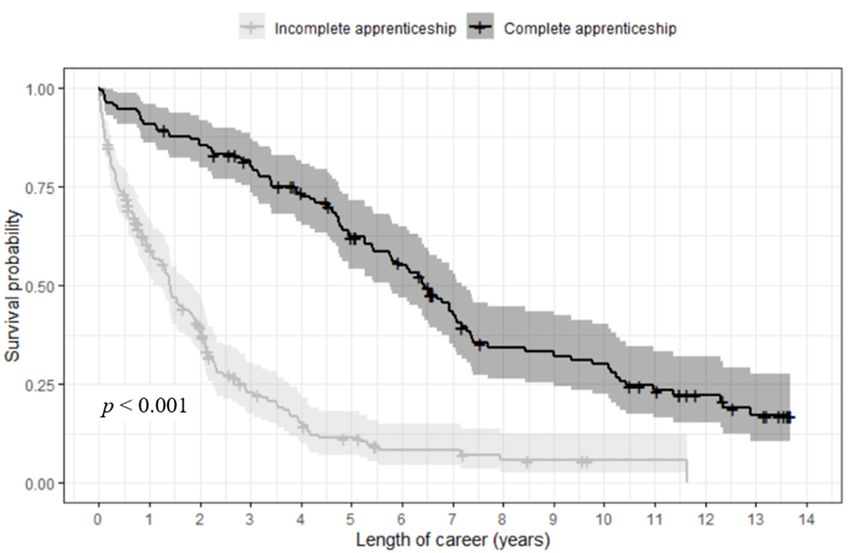
Sustainability 2020, 12, 7443                                                                         2 of 10

minimum riding weights of 52 kg and 63 kg are in operation for flat and jumps jockeys, respectively,
with the option for inexperienced (apprentice) jockeys to claim an allowance of 1–4 kgs depending on
previous wins [5].
      The workload of professional jockeys is high. In New Zealand, Australia and Ireland, jockeys ride
in one to eight races a day, in two to four race days a week, with no off-season [6–8]. In the United
Kingdom (UK) and the United States (USA) a jockeys’ workload can be greater, with races occurring
up to 7 days a week [1,9]. Jockeys have the added risk of falling from the horse, with incidence rates
(per 1000 starts) of 1.2 for flat and 53–100 for jumps racing [10], increasing the potential for injury and
confidence loss for jockeys. The effects of a consistently high workload, maintaining a low body mass
year-round and the high potential for injury on potential career length of jockeys are unknown.
      Although the careers of thoroughbred racehorses have been extensively studied [11–13], little is
known about the career prospects of the jockeys that ride them. Retrospective questionnaires answered
by current professional jockeys in USA, Korea, Ireland and Australia indicate that jockey career lengths
are 10.9–15.9 years [6,14,15], with a strongly skewed distribution toward the lower end of the scale [8,9].
However, these findings may be biased upwards because the studies only targeted jockeys who were
found at the racetrack at the time of questioning. By default, this would include higher proportions of
well-established jockeys who had secured a race day ride.
      Whilst it is common for professional athletes in many sports to retire due to injury [16,17], in the
sport of horse racing, jockeys leave their profession for a number of reasons, such as lack of rides,
weight gain, injury, loss of confidence and competency [8,9,18]. Since little is currently known about
the career length of jockeys in the thoroughbred industry, the aim of this study was to determine
the career lengths and risk factors for loss from the industry of thoroughbred racing jockeys in New
Zealand. This information would be beneficial in determining the costs and benefits to the jockey of
riding more races, and to the industry in optimizing the selection and preparation of apprentices to
fulfil the need for quality jockeys who can have long and successful careers. It was hypothesized that
jockeys with longer careers would have more rides, fall less often and have more success than shorter
career jockeys.

2. Materials and Methods
      Data from all thoroughbred race-starts between 1 August 2005 and 17 April 2019 were supplied
by New Zealand Thoroughbred Racing (NZTR), the governing body for thoroughbred racing in New
Zealand. A racing season began on the 1 August and ended on the 31 July. Data were provided at
the ride level and the following variables were extracted and used for further analysis: date of race;
horse carried weight, assigned weight and domestic rating; jockey name, gender and age; race outcome
(in the form of jockey falls or wins). Hurdle and steeplechase races were combined into one category of
jumps races, to allow comparison between flat and jumps races.
      For the purposes of this study, an apprentice was defined as a rider whose horses carried weight
was ≤ 1 kg from the handicap weight assigned to the horse, whereas a jockey rode at the assigned
horses’ weight. Carried weight refers to the weight carried by the horse during the race. Three evenly
populated workload cohorts of ‘low’, ‘middle’ and ‘high’ were created based on the number of rides
each jockey rode per season. For flat and jumps racing respectively, those who rode 1–10 or 1–5 rides
per season were assigned to the low cohort, jockeys who rode 10–200 or 5–25 rides per season were
assigned to the middle cohort and jockeys who rode over 200 or 25 rides per season were assigned to
the high cohort. Career length cohorts of ‘short’, ‘middle’ and ‘long’ were created based on the time
between the first and last race ride of a jockey. Jockeys with careers of 1–2 (i.e., less than 3) years were
assigned to the ‘short’ cohort, jockeys with careers of ≥ 3–9 years were assigned to the ‘middle’ cohort
and jockeys with careers of more than 10 years were assigned to the ‘long’ cohort. Analyses were
conducted on flat racing jockeys only, except where jumps racing jockeys were used as a comparison
group. Jockeys who were not licensed in New Zealand (n = 112) were removed from the data.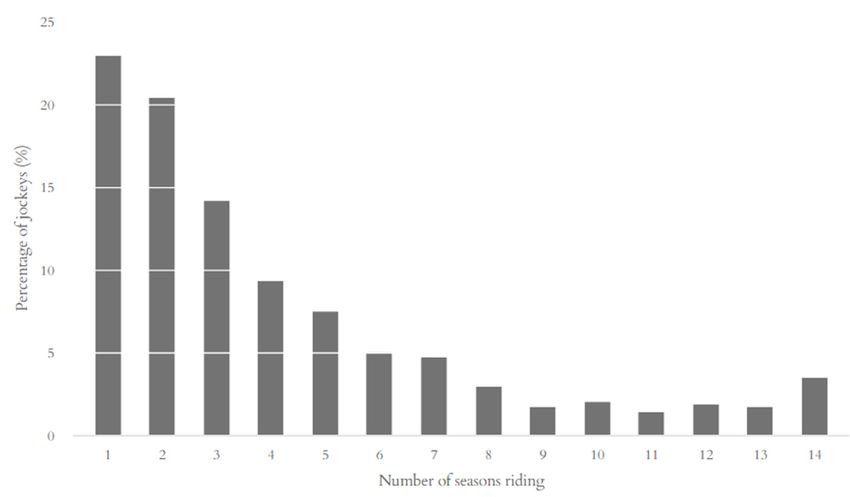
Sustainability 2020, 12, 7443 3 of 10
The integrity of the data were checked using histograms, scatter plots and box plots, where outliers
or points of interest were compared with the official NZTR database. Descriptive statistics were used
Sustainability 2020, 12, x FOR PEER REVIEW 3 of 10
to describe the data at population level for the career length cohorts. Counts and percentages were
usedtotodescribe
used describecontinuous
categoricaldata
data and
that median
were and interquartile
non-normally range
distributed. (IQR) were
Incidence ratesused
were to describe
calculated
continuous data that were non-normally distributed. Incidence rates were
based on the number of falls or wins and number of rides during the time period and expressed calculated based onasthea
number
rate of falls
per 1000 orKaplan–Meier
rides. wins and number of rides
survival during
curves the time
were used period jockey
to estimate and expressed as a rate
career lengths, per
based
1000
on therides.
datesKaplan–Meier survivalincurves
of their appearances wereset.
the data used to estimate
Linear jockey
regression wascareer
used lengths, based
to calculate on the
rates of
dates of their appearances in the data set. Linear regression was used to calculate
survival probabilities. Seasonal trends were analyzed using seasonal and trend decomposition using rates of survival
probabilities.
loess (STL) plots Seasonal
and trends were Normality
box plots. analyzed usingwasseasonal
assessedand trendan
using decomposition using loess
Anderson–Darling test (STL)
and
plots and box plots. Normality was assessed using an Anderson–Darling
Kruskal–Wallis tests for significance were used to compare differences between groups. test and Kruskal–Wallis tests
for significance
Analyses were were used to compare
conducted differences
in RStudio between
(version groups.
3.5.1, 2018; R Foundation for Statistical
Computing, Vienna, Austria) with the level of significance set RatFoundation
Analyses were conducted in RStudio (version 3.5.1, 2018; p < 0.05. for Statistical Computing,
Vienna, Austria) with the level of significance set at p < 0.05.
3. Results
3. Results
During the period 1 August 2005–17 April 2019 there were 37,596 flat races over 4459 race days
During the period 1 August 2005–17 April 2019 there were 37,596 flat races over 4459 race days
and 1528 jumps (897 hurdle and 631 steeple) races over 536 race days. There was a total of 421,596
and 1528 jumps (897 hurdle and 631 steeple) races over 536 race days. There was a total of 421,596 ride
ride opportunities, of which 407,948 were flat racing starters and 13,648 jumps racing starters.
opportunities, of which 407,948 were flat racing starters and 13,648 jumps racing starters.
Data were collected on 674 jockeys and apprentices licensed in New Zealand, the majority of
Data were collected on 674 jockeys and apprentices licensed in New Zealand, the majority of
which (97%) rode in flat races and only 24% rode in a jumps race. Male jockeys accounted for 58% of
which (97%) rode in flat races and only 24% rode in a jumps race. Male jockeys accounted for 58%
the total number of registered jockeys or apprentices over the study period. The distribution of career
of the total number of registered jockeys or apprentices over the study period. The distribution of
length was highly positively skewed (Figure 1). The median career length of all jockeys was two (IQR
career length was highly positively skewed (Figure 1). The median career length of all jockeys was two
1–6) seasons, with no differences in rate of loss of jockeys between race type (flat or jumps p = 0.5).
(IQR 1–6) seasons, with no differences in rate of loss of jockeys between race type (flat or jumps p = 0.5).
After the first year, the rate of loss of female jockeys was higher than for male jockeys (p = 0.006).
After the first year, the rate of loss of female jockeys was higher than for male jockeys (p = 0.006).
Jockeys who began their careers under 18 years of age were twice as likely to remain in their career
Jockeys who began their careers under 18 years of age were twice as likely to remain in their career than
than jockeys who began at an older age (p = 0.02). Twenty-four (4%) jockeys rode for all 14 race
jockeys who began at an older age (p = 0.02). Twenty-four (4%) jockeys rode for all 14 race seasons.
seasons.
Figure 1. Number of seasons riding for flat and jumps racing jockeys for the 2005/6–2018/9 racing seasons.
Figure 1. Number of seasons riding for flat and jumps racing jockeys for the 2005/6–2018/9 racing
seasons.
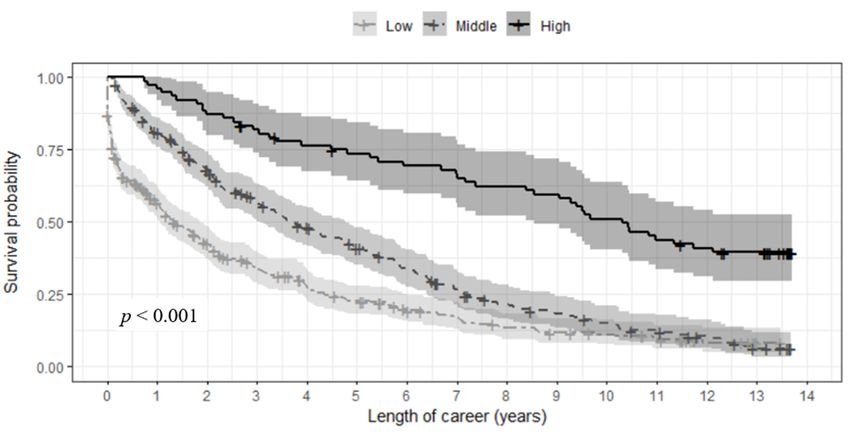
Jockeys in the long career length cohort (11%) were more likely to be male and had more rides
and wins per season than jockeys in the short (43%) and middle (46%) career length cohorts (Table 1).
Jockeys in the long career length cohort (11%) were more likely to be male and had more rides
and wins per season than jockeys in the short (43%) and middle (46%) career length cohorts (Table
1). Jockeys in the short career cohort had twice the incidence rate of falls and were less likely to ride
a winner than jockeys in the high career length cohort.
Table 1. Characteristics of flat racing jockeys with short (1–2 years), middle (3–9 years) and long (>10
years) career lengths for the 2005/6–2018/9 racing seasons.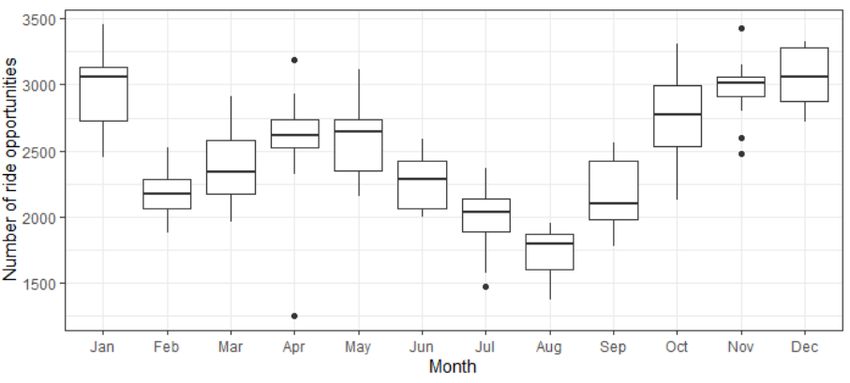
Sustainability 2020, 12, 7443                                                                                      4 of 10

Jockeys in the short career cohort had twice the incidence rate of falls and were less likely to ride a
winner than jockeys in the high career length cohort.

      Table 1. Characteristics of flat racing jockeys with short (1–2 years), middle (3–9 years) and long (>10
      years) career lengths for the 2005/6–2018/9 racing seasons.

                Descriptor                    Short                   Middle                Long          p Value
                                                        Number of observations (%)
                  Female                120           42%        133       44%        16           23%
                   Male                 152           54%        168       55%        54           77%     0.001
                                                                Median (IQR)
     Age at first appearance (yrs)      25       (22–31)         23       (20–27)      25      (21–31)
Sustainability 2020, 12, 7443 5 of 10
Sustainability 2020, 12, x FOR PEER REVIEW 5 of 10
Sustainability 2020, 12, x FOR PEER REVIEW 5 of 10
Figure 2. Length
Figure ofof
2. Length career
careerofofflat
flatracing
racingjockeys
jockeys who
who first
first appear in low
appear in low(1–10
(1–10rides/season, = 335),
rides/season,n n= 335),
middle
middle(10–200 rides,
(10–200 = =244)
rides,n n 244)ororhigh
high(>200
(>200 rides, n=
rides, n 78) workload
= 78) workloadcohorts
cohortsfor
forthe
the2005/6–2018/9
2005/6–2018/9
Figure 2. Length of career of flat racing jockeys who first appear in low (1–10 rides/season, n = 335),
racing seasons. Shaded area indicates 95% confidence
racing seasons. Shaded area indicates 95% confidence interval.interval.
middle (10–200 rides, n = 244) or high (>200 rides, n = 78) workload cohorts for the 2005/6–2018/9
3.1. racing seasons. Shaded area indicates 95% confidence interval.
Apprentices
3.1. Apprentices
There
3.1.Therewas a difference
Apprentices
was a differenceinincareercareerlength
lengthforfor those
those jockeys who completed
jockeys who completedtheir theirapprenticeship
apprenticeship
andandthose
those who
who
There did not
dida not
was (Figure 3).
(Figurein3).
difference Only 40%
Onlylength
career (131/331)
40% (131/331) of
for those of apprentices
apprentices
jockeys completed
completed
who completed their
their
their apprenticeship
apprenticeship
apprenticeship
training.
and Half
training. those of
Half the
who jockeys
did
of the jockeyswho
not (Figure
whodid notnot
3).did
Only complete
40% their
(131/331)
complete apprenticeship
of
their apprentices during
completed
apprenticeship during the time
their
the period were
apprenticeship
time period lost
were
within a year
training. of their
Half of first
the race
jockeys day
who ride.
did For
not those
completewho did
their complete their
apprenticeship apprenticeship,
during the
lost within a year of their first race day ride. For those who did complete their apprenticeship, their time their
period median
were
career
medianlength
lost within was
career 6.5ofyears.
a year
length their For
first
was 6.5 theday
race
years. 32% of jockeys
Forride.
the For those
32% who
who continued
of jockeys did
whocompletetotheir
continuedrideto for
ridemore
apprenticeship,thantheir
for more 7 years,
than 7
median career length was by
6.5 half
years. 2=
theyears,
linear rate
the of loss
linear rate slowed
of loss slowed byFor
(8% tothe
half 3%
(8%32%
to of
per jockeys
year,
3% who
perRyear, R2continued
= 0.97). to ride for more than 7
0.97).
years, the linear rate of loss slowed by half (8% to 3% per year, R2 = 0.97).
Figure 3. Career
Figure survival
3. Career survivalprobability forapprentices
probability for apprentices that
that completed
completed their their apprenticeship
apprenticeship (n = 131)(n = 131)
and
Figure 3. Career survival probability for apprentices that completed their apprenticeship (n = 131) and
and those thatdid
those that didnotnot
(n =(n = for
200) 200)
thefor the 2005/6–2018/9
2005/6–2018/9 racingShaded
racing seasons. seasons. Shaded95%
area denotes areaconfidence
denotes 95%
those that did not (n = 200) for the 2005/6–2018/9 racing seasons. Shaded area denotes 95% confidence
confidence interval.
interval.
interval.Sustainability 2020, 12, 7443 6 of 10
Sustainability 2020, 12, x FOR PEER REVIEW 6 of 10
3.2. Yearly Racing
3.2.Race
Yearly Racing
opportunities were available year-round, but there were more horses flat racing in the
summer (October–January)
Race thanavailable
opportunities were in winteryear-round,
months (June–September)
but there were(Figure 4). Theflat
more horses rides of jockeys
racing in the in
the high workload
summer cohort followed
(October–January) than in this
winterseasonal
monthstrend, with two seasonal
(June–September) (Figurepeaks
4). Theinrides
ride of
numbers
jockeys in
in the high
December workload
(summer) cohort
and Aprilfollowed
(autumn), thisrespectively,
seasonal trend, with
of 1.7 twoand
times seasonal peaksthe
1.5 times in month
ride numbers
with the
in December
least number of(summer) and April
rides in August (autumn),
(winter). respectively,
Apprentices also of
had1.7two
times and 1.5peaks
seasonal timesinthe month
ride numberswith in
the least number of rides in August (winter). Apprentices also had two
December and May of 1.5 and 1.7 times that of the number of rides in February, the month which seasonal peaks in ride
numbers
they had the in least
December
numberandofMay of 1.5
rides. and 1.7
Jockeys intimes that of workload
the middle the numbercohort
of rideshadin February,
two seasonalthe month
peaks in
in which
ride numbers they inhad the least
May–July number
and of rides. Jockeys
November–January ofin
2.2the middle
and workload
1.5 times cohortof
the number had twoinseasonal
rides February,
peaks
when in ride
they hadnumbers in May–July
least rides. Jockeys in andtheNovember–January
low workload cohort of 2.2had
andonly
1.5 times the number
one seasonal peakof rides
in ride
in February, when they had least rides. Jockeys in the low workload
numbers, riding twice as many races from November–January than in April–July. cohort had only one seasonal
peak in ride numbers, riding twice as many races from November–January than in April–July.
Figure 4. Number of monthly flat racing ride opportunities for the 2005/6–2018/9 racing seasons.
Figure 4. Number of monthly flat racing ride opportunities for the 2005/6–2018/9 racing seasons.
Apprentices rode in a higher proportion of races during the winter months than the summer
Apprentices rode in a higher proportion of races during the winter months than the summer
months. Jockeys from the high workload cohort rode the majority of two-year-old races year-round
months. Jockeys from the high workload cohort rode the majority of two-year-old races year-round
compared with apprentices or jockeys in the low and middle workload cohorts.
compared with apprentices or jockeys in the low and middle workload cohorts.
4. Discussion
4. Discussion
This study provides new information documenting the career lengths and reasons for loss from
This study provides new information documenting the career lengths and reasons for loss from
the industry for thoroughbred racing jockeys in New Zealand. The career length of the majority of
the industry for thoroughbred racing jockeys in New Zealand. The career length of the majority of
jockeys in New Zealand was short (Sustainability 2020, 12, 7443 7 of 10
4.1. Long Career Cohort Jockeys
Jockeys with longer careers were less likely to fall during a race and more likely to ride a winner
than jockeys with shorter careers, indicating that they ride more safely and more successfully than
their counterparts. However, those with longer careers had a higher total number of falls and the rate
of loss of jockeys with more than two falls over the length of their career was low. This indicates that
falling (and the cumulative frequency thereof) may not be a driver of career longevity and performance
for flat racing jockeys. In addition, the lack of association between time or number of rides until the
first fall or win of a jockey and between their last fall or win and the end of their career indicates that
neither falling nor winning was a driving factor for career length. Thus, the higher number of falls
by longer career jockeys may be a simple reflection of the greater time spent at risk. The higher total
number of wins by longer career jockeys would increase their status and enable them to more easily
obtain future rides, thereby prolonging their career. This view was supported by the observation that
longer career jockeys rode horses with higher ratings indicating that they were able to attain higher
quality rides with more chance of success.
Although longer career jockeys fell less often than shorter career jockeys, as a group they had more
falls. Injury has previously been identified as one of the factors for jockeys ending their careers [8,18].
For example, Korean flat racing jockeys with an average career span of 11.6 years reported at least
one injury, most occurring during practice or competition and due to difficulties in handling horses,
though it was unclear if this was whilst riding or ground handling horses [14]. In the UK, half of the
accidents reported in racehorse stables were from falling from a horse during training [19]. Although
falls occurring pre- and post-race, or during trackwork and training were not taken into account in
the present study, falls occurring during a race are more likely to result in injury to the jockey [20,21]
and account for approximately half of jockey race day falls in New Zealand [22]. In addition, despite
having fewer racing opportunities, jumps racing jockeys fall during the race 50–100 times more often
than flat racing jockeys (or once every 10–20 races) [10]. Thus, falling from a horse is a major risk, not
only during a competitive race, but also during training activities. For these reasons, training on how
to fall safely early in a jockey’s career may help to reduce the risk of injury from falling from a horse.
In the current study, long career cohort jockeys rode at a smaller range of carried weights compared
to short and middle career length cohorts. The year-round ride opportunities require jockeys to be
able to meet these riding weights consistently, and inability to meet the weight requirements has been
identified as limiting jockey careers in Australia and USA [8,18]. Therefore, the ability to make weight
may be an important driver for racing success.
Jockeys have been found to be smaller, lighter, have better balance and reaction times, greater
anaerobic and aerobic fitness and greater muscular strength and power than track riders who exercise
racehorses daily [23]. Therefore, factors such as jockey phenotype, fitness, or work ethic (mental stamina)
may be more important predictors of jockey success/longevity than racing performance. These factors
may be apparent early on in a jockey’s career, as shown by the high rate of loss of non-graduating
apprentices after just 6 months. This may underline the importance of a pre-selection criteria early
in a jockey’s career, as occurs in other sports [17], to identify candidates who are most likely to be
successful as jockeys. Thus, future studies should investigate the optimal physical characteristics of
jockeys in order to maximize ‘talent’ potential.
4.2. Apprentices
The current results revealed that jockey apprenticeship programs had a high rate of loss (40%),
half of which was within a year of their first race day ride. This was lower than observed in UK,
with the director of the British racing school in 2000 estimating that nine out of 10 apprentices failed to
become full professional jockeys [18]. In the present study, the median combined (apprenticeship and
jockey) career length of graduating apprentices of 6–7 years indicated that additional investment into
early careers of jockey may be beneficial to increase workforce retention. This has been shown to be
effective; a structured training program was introduced to apprentices in Victoria, Australia in 1992Sustainability 2020, 12, 7443 8 of 10
and reduced the numbers of the annual apprentice intake that failed to become jockeys from 25% to
10% [8]. Therefore, appropriate industry changes can improve jockey retention and possibly career
length in the industry. Having rigorous selection criteria and decreasing the apprentice intake may
allow more intensive investment into the training and education of new apprentices. In association
with a specialized apprentice training program, these measures may help to retain and support jockeys
in their career.
4.3. Seasonal Rides
The current analysis revealed a seasonal trend in ride opportunities for jockeys, with more
rides during spring carnival racing, and in autumn, where there is a cross over with ‘winter’ horses
commencing work, and ‘summer’ horses finishing their season.
High workload cohort jockeys had their highest number of races during spring and summer racing,
when most of the high stakes races occur, and 2-year-olds are introduced to racing. Proportionally
more licensed and high workload cohort jockeys rode in 2-year-old races, indicating that a new and
inexperienced horse with unknown potential was given the best possible chance of winning by having
a more experienced rider. The summer peak in ride numbers by low workload jockeys may reflect
the extra rides they are able to acquire due to the higher number of ride opportunities in summer.
Interestingly, the peak for the middle workload cohort jockeys and apprentices was highest in autumn,
indicating that these jockeys may ride more of the (slower) ‘winter’ racing horses, or experienced
horses at the end of the summer racing season. As inexperienced jockeys and inexperienced horses
have both been found to be risk factors in jockey falls [10,24–26], this is an interesting finding which
indicated the industry is actively protecting the interests of the less experienced jockeys, giving them
valuable race experience in potentially slower races.
The large numbers of jockeys competing for a fixed number of ride opportunities results in high
selectivity for the high performing jockeys. It has been identified that riding a race is more physically
demanding than riding daily trackwork [27] and jockeys rarely participate in additional off-horse
physical training regimes except as a measure to reduce weight [6,7]. The short career length of the
majority of jockeys indicate that they may not be physically or mentally prepared or able to meet
the demands of riding in a race, thus not able to either meet the weight requirements, or perform
successfully. Reducing the numbers of licensed jockeys may help to extend future jockeys’ careers by
ensuring there were sufficient riding opportunities. Better selection of and support for candidates who
are able to join the high workload jockey cohort would reduce risk to both horse and rider and loss of
athletes from the sport.
5. Conclusions
The majority of jockeys in New Zealand over the 2005/6–2018/9 racing seasons had short careers of
two years, whilst jockeys who rode in more races had longer careers. The 11% of jockeys with careers of
greater than 10 years rode at consistently low weights, had a lower fall incidence rate, and were more
likely to win races than jockeys with shorter careers. In determining jockey career lengths, the ability
to obtain rides (and to make riding weights) was more important than falling or winning. There was a
high rate of loss of apprentices, the majority of them leaving one year after their first race day ride,
highlighting the importance of developing appropriate selection criteria for jockeys.
Author Contributions: Conceptualization, K.L. and C.R.; methodology, K.L. and C.R.; formal analysis, K.L.;
writing—original draft preparation, K.L.; writing—review and editing, K.L., D.C., E.G., C.R.; supervision, D.C.,
E.G., C.R.; funding acquisition, C.R. All authors have read and agreed to the published version of the manuscript.
Funding: This project was funded in part from the New Zealand Equine Trust grant ET 2/2019, ET 9/2017
& ET 1/2016.
Acknowledgments: The authors would like to thank New Zealand Thoroughbred Racing for provision of the data.Sustainability 2020, 12, 7443 9 of 10
Conflicts of Interest: The authors declare no conflict of interest. The funders had no role in the design of the
study; in the collection, analyses, or interpretation of data; in the writing of the manuscript, or in the decision to
publish the results.
References
1. Warrington, G.; Dolan, E.; McGoldrick, A.; McEvoy, J.; MacManus, C.; Griffin, M.; Lyons, D. Chronic weight
control impacts on physiological function and bone health in elite jockeys. J. Sports Sci. 2009, 27, 543–550.
[CrossRef] [PubMed]
2. Cullen, S.J.; O’Loughlin, G.; McGoldrick, A.; Smyth, B.; May, G.; Warrington, G. Physiological demands of
flat horse racing jockeys. J. Strength Cond. Res. 2015, 29, 3060–3066. [CrossRef]
3. Trowbridge, E.A.; Cotterill, J.V.; Crofts, C.E. The physical demands of riding in National Hunt races. Eur. J.
Appl. Physiol. 1995, 70, 66–69. [CrossRef] [PubMed]
4. Bolwell, C.F.; Rogers, C.W.; Gee, E.K.; Rosanowski, S.M. Descriptive statistics and the pattern of horse racing
in New Zealand. 1. Thoroughbred racing. Anim. Prod. Sci. 2016, 56, 77–81. [CrossRef]
5. New Zealand Thoroughbred Racing. Handicapping Guide; New Zealand Thoroughbred Racing Inc.:
Wellington, New Zealand, 2019.
6. Dolan, E.; O’Connor, H.; McGoldrick, A.; O’Loughlin, G.; Lyons, D.; Warrington, G. Nutritional, lifestyle,
and weight control practices of professional jockeys. J. Sports Sci. 2011, 29, 791–799. [CrossRef] [PubMed]
7. Leydon, M.A.; Wall, C. New Zealand jockeys’ dietary habits and their potential impact on health. Int. J. Sport
Nutr. Exerc. Metab. 2002, 12, 220–237. [CrossRef]
8. Speed, H.; Seedsman, T.; Morris, T.; Sullivan, R. The Welfare of Retired Jockeys; Victoria University of Technology,
Centre for Rehabilitation, Exercise and Sports Science: Melbourne, Australia, 2001.
9. Press, J.M.; Davis, P.D.; Wiesner, S.L.; Heinemann, A.; Semik, P.; Addison, R.G. The national jockey injury
study: An analysis of injuries to professional horse-racing jockeys. Clin. J. Sport Med. 1995, 5, 236–240.
[CrossRef]
10. Legg, K.A.; Cochrane, D.J.; Bolwell, C.F.; Gee, E.K.; Rogers, C.W. Incidence and risk factors for race-day
jockey falls over fourteen years. J. Sci. Med. Sport 2020, in press. [CrossRef]
11. Tanner, J.C.; Rogers, C.W.; Firth, E.C. The association of 2-year-old training milestones with career length and
racing success in a sample of Thoroughbred horses in New Zealand. Equine Vet. J. 2013, 45, 20–24. [CrossRef]
12. Sobczyńska, M. The effect of selected factors on length of racing career in Thoroughbred racehorses in Poland.
Anim. Sci. Pap. Rep. 2007, 25, 131–141.
13. Jeffcott, L.B.; Rossdale, P.D.; Freestone, J.; Frank, C.J.; Towers-Clark, P.F. An assessment of wastage in
Thoroughbred racing from conception to 4 years of age. Equine Vet. J. 1982, 14, 185–198. [CrossRef] [PubMed]
14. Jeon, S.; Cho, K.; Ok, G.; Lee, S.; Park, H. Weight loss practice, nutritional status, bone health, and injury
history: A profile of professional jockeys in Korea. J. Exerc. Nutr. Biochem. 2018, 22, 27–34. [CrossRef]
[PubMed]
15. Kiely, M.; Warrington, G.; McGoldrick, A.; Cullen, S.J. Physical preparation strategies of professional jockeys.
J. Strength Cond. Res. 2020, in press. [CrossRef]
16. Witnauer, W.D.; Rogers, R.G.; Saint Onge, J.M. Major league baseball career length in the twentieth century.
Pop. Res. Policy Rev. 2007, 26, 371–386. [CrossRef] [PubMed]
17. Baker, J.; Koz, D.; Kungl, A.-M.; Fraser-Thomas, J.; Schorer, J. Staying at the top: Playing position and
performance affect career length in professional sport. High. Abil. Stud. 2013, 24, 63–76. [CrossRef]
18. Vamplew, W. Still crazy after all those years: Continuity in a changing labour market for professional jockeys.
Sport Soc. 2016, 19, 378–399. [CrossRef]
19. Filby, M.; Jackson, C.; Turner, M. Only falls and horses: Accidents and injuries in racehorse training.
Occup. Med. 2012, 62, 343–349. [CrossRef]
20. Waller, A.E.; Daniels, J.L.; Weaver, N.L.; Robinson, P. Jockey injuries in the United States. Am. J. Emerg. Med.
2001, 283, 1326–1328. [CrossRef]
21. Curry, B.A.; Hitchens, P.L.; Otahal, P.; Si, L.; Palmer, A.J. Australian insurance costs of jockeys injured in a
race-day fall. Occup. Med. 2016, 66, 222–229. [CrossRef]
22. Bolwell, C.F.; Rogers, C.W.; Gee, E.K. Descriptive epidemiology of race-day jockey falls and injuries in
New Zealand. Comp. Exerc. Physiol. 2014, 10, 49–55. [CrossRef]Sustainability 2020, 12, 7443 10 of 10
23. Hitchens, P.; Blizzard, L.; Jones, G.; Day, L.; Fell, J. Are physiological attributes of jockeys predictors of falls?
A pilot study. Br. Med. J. Open 2011, 1, e000142. [CrossRef] [PubMed]
24. Hitchens, P.; Blizzard, L.; Jones, G.; Day, L.; Fell, J. Predictors of race-day jockey falls in jumps racing in
Australia. Accid. Anal. Prev. 2011, 43, 840–847. [CrossRef] [PubMed]
25. Hitchens, P.L.; Blizzard, C.L.; Jones, G.; Day, L.; Fell, J. Predictors of race-day jockey falls in flat racing in
Australia. Occup. Environ. Med. 2010, 67, 693–698. [CrossRef] [PubMed]
26. O’Connor, S.; Warrington, G.; Mb, A.M.; Cullen, S. A 9-year epidemiologic study (2007–2015) on race-day
jockey fall and injury incidence in amateur irish horse racing. J. Athl. Train. 2018, 53, 950–955. [CrossRef]
[PubMed]
27. Kiely, M.A.; Warrington, G.D.; McGoldrick, A.; O’Loughlin, G.; Cullen, S. Physiological demands of daily
riding gaits in jockeys. J. Sports Med. Phys. Fit. 2019, 59, 394–398. [CrossRef]
© 2020 by the authors. Licensee MDPI, Basel, Switzerland. This article is an open access
article distributed under the terms and conditions of the Creative Commons Attribution
(CC BY) license (http://creativecommons.org/licenses/by/4.0/).You can also read