King Cetshwayo District 01/52
←
→
Page content transcription
If your browser does not render page correctly, please read the page content below
01/52   King Cetshwayo
        District
2
    PROFILE: KING CETSHWAYO DISTRICT
PROFILE: KING CETSHWAYO DISTRICT                         3

                                                           CONTENTS

1. Executive Summary ........................................................................................... 5
2. Brief Overview .................................................................................................... 6
     2.1. Historical Perspective ............................................................................................................... 6
     2.2. Location .................................................................................................................................... 6
     2.3. Spatial integration .................................................................................................................... 7
     2.4. Land Ownership ....................................................................................................................... 7
3. Social Development Profile ............................................................................... 8
     3.1. Key Social Demographics ......................................................................................................... 8
     3.1.1. Population ............................................................................................................................. 8
     3.1.2. Gender, Age and Race ........................................................................................................... 9
     3.1.3. Household Profile ................................................................................................................ 10
     3.2. Health ..................................................................................................................................... 10
     3.3. COVID-19 ................................................................................................................................ 11
     3.4. Poverty Dimensions................................................................................................................ 12
     3.4.1 Distribution ...................................................................................................................... 12
     3.4.2. Inequality............................................................................................................................. 13
     3.4.3. Unemployment/Employment .............................................................................................. 14
     3.4.4. Crime ................................................................................................................................... 14
     3.5. Education and Skills Profile .................................................................................................... 15
4. Economic Drivers ............................................................................................ 16
     4.1. Structure of the Economy ...................................................................................................... 16
     4.2 Primary Sector .................................................................................................................... 17
     4.3 Secondary Sector..................................................................................................................... 19
     4.4 Tertiary Sector ..................................................................................................................... 19
     4.6. Informal Sector ....................................................................................................................... 21
5. Service Delivery ............................................................................................... 21
     5.1. Water and Sanitation ............................................................................................................. 21
     5.2. Human Settlements................................................................................................................ 22
     5.3. Waste Management ............................................................................................................... 22
     5.4. Electricity ................................................................................................................................ 23
     5.5. Roads and Transport .............................................................................................................. 24
6. Governance, ..................................................................................................... 24
     6.1 Municipal Performance ........................................................................................................... 24
     6.2.   Municipal capacity .......................................................................................................... 24
     6.3 Traditional Leadership Governance .................................................................................... 25
7. Projects to Diversify and Grow People and the Economy ........................... 25
     7.1      Social Development Projects ............................................................................................... 25
     7.2      Spatial Development ........................................................................................................... 25
     7.3      Infrastructure Projects......................................................................................................... 25
     7.4      Economic Projects ............................................................................................................... 26
     7.5      Environmental forecasts...................................................................................................... 26
8. Key Recommendations ................................................................................... 26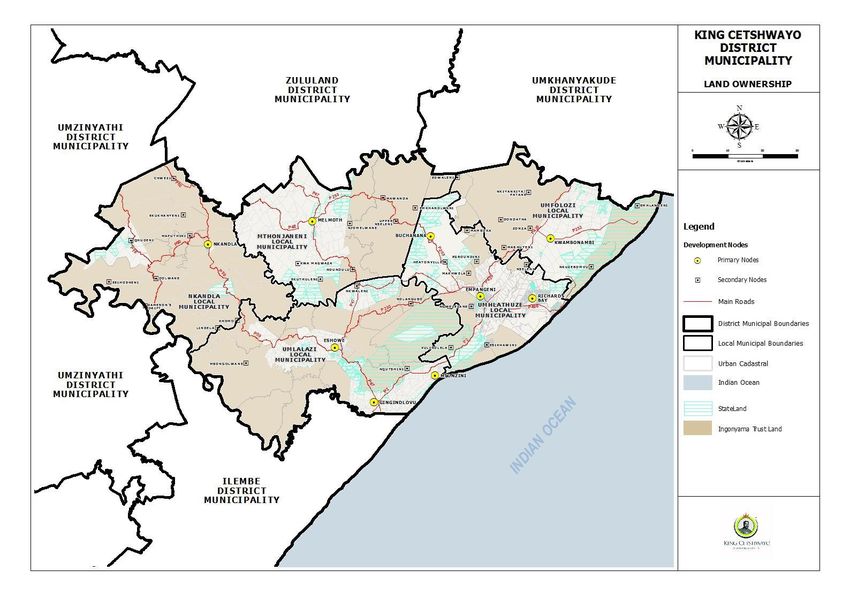
4
    PROFILE: KING CETSHWAYO DISTRICT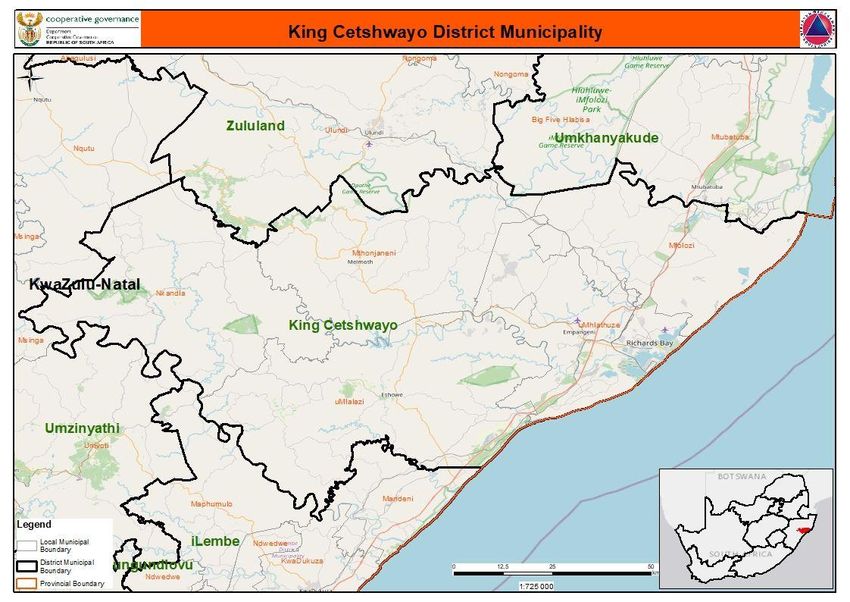
PROFILE: KING CETSHWAYO DISTRICT   5

1. Executive Summary
The King Cetshwayo District (KCD) is located in the north-eastern region of the
KwaZulu-Natal province (KZN) on the eastern seaboard of South Africa. It covers an
area of 8 213 square kilometers, from the agricultural town of Gingindlovu in the south,
to the Umfolozi River in the north and inland to the mountainous beauty of rural
Nkandla.

The KCD is surrounded by uMkhanyakude District to the north, Zululand District to the
north-west, uMzinyathi District to the north-east and iLembe District to the south and
is approximately 150 km north of the eThekwini metro. The headquarters of the KCD
is in Richardsbay and the district is made up of five local municipalities, namely:
Mthonjaneni, uMlalazi, Mfolozi, uMhlathuze and Nkandla. The N2 from Durban to
Mpumalanga passes through the District.

In 2019, the District accounted for a total population of 982 726 or 8.6% of the total
population in KZN slightly up from 971 135 in 2016. Females constituted 52.6% of the
population. The total number of households decreased somewhat from 225 798 in
2016 to 222 000 in 2019. In 2016, 49.8% of households were headed by women, whilst
1 552 households were headed by children younger than 18 years of age. 80% of the
KCD population and households are regarded as rural.

In terms of COVID-19, eThekwini remains the epicentre of confirmed cases in the KZN
province. KCD is fifth with 52 cases being 2% of the provincial total cases but second
in fatality rate.

The District is among the key economic role players in KZN in terms of GDP
contribution. It contributed 6.5% of the total estimated provincial GDP generated in
2016. It is within this context that KCD is among the largest contributing districts
towards the provincial GDP such as eThekwini and uMgungundlovu at 59.5%, and
11.3% respectively. The largest contributing local municipalities to the GDP of the
district are the City of uMhlathuze at 44.0%, followed by uMfolozi at 25.7% and
uMlalazi at 21.3%. Although the economy of KCD is predominantly dependent on the
tertiary sector at 47.9%, the secondary sector at 29% also plays a significant role in
its economy especially the manufacturing sub-sector.
6
          PROFILE: KING CETSHWAYO DISTRICT

2. Brief Overview
2.1. Historical Perspective
The district shares the branding Heart and Soul of the Zulu Kingdom with its
neighbouring Zululand District. The region is home to King Shaka's KwaBulawayo
Military Capital, and is recognised as being one of the key sites of Zulu heritage. The
centre was officially opened by His Majesty the Zulu King Goodwill Kabhekuzulu
Zwelithini in 2011.

Nkandla is situated in a remote area of breath-taking mountainous beauty, which
consists mainly of tribal lands and state-owned land. The area has a wealth of
undisturbed forests, which boast many indigenous species. Nkandla has a claim to be
the ‘cradle’ of Zulu history. From Malandela to Shaka, to Dingane and Cetshwayo,
Nkandla has been at the centre stage of the Zulu nation’s history. The graves of King
Malandela and Cetshwayo are at Nkandla.

2.2. Location
The King Cetshwayo District (KCD) with its administrative headquarters in Richards
Bay is located in the province of KZN, approximately 150 kilometres north of the major
metropolitan area of eThekwini. The District is bordered by uMkhanyakude to the
north, Zululand to the north-west, uMzinyathi to the north-west and iLembe District to
the south. KCD consists of the Mthonjaneni, uMlalazi, Mfolozi, Umhlatuze and
Nkandla local municipalities.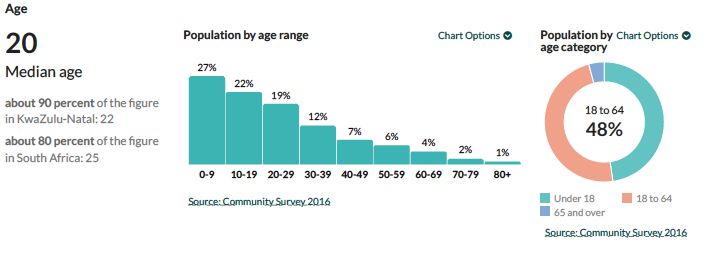
PROFILE: KING CETSHWAYO DISTRICT   7

    THE DISTRICT IS HOME TO THE DEEPEST NATURAL HABOUR IN
                                  SOUTH AFRICA

2.3. Spatial integration
The District has Richards Bay- Empangeni Coastal Urban node with Richards Bay
Harbour being the deepest natural Harbour in the African continent allowing for
handling of heavy cargo vessels, dune mining operations and large industrial areas
and the IDZ. The inland western part of the municipality is deep rural with the
concomitant high levels of poverty and unavailability of economic opportunities. It is
evident, that cultivated land and forestry forms the backbone of the rural economy,
situated mostly on both sides of the N2 with large forestry areas evident in the
Mthonjaneni area in the north eastern portion of KCD and scattered rural settlement
is evident within Nkandla, uMfolozi and uMlalazi municipalities. These areas coincide
with the Ingonyama Trust land. Denser settlement patterns are evident around the
towns of Richards Bay/Empangeni and Eshowe. Subsistence agriculture is very
evident in Nkandla LM.

The N2 from Durban to Mpumalanga and Gauteng passes through the area. The
country’s main coal railway line passes through the area and ends at the harbour coal
terminal from where the coal and other heavy minerals and materials are exported.
Richards Bay Airport is an important air link for the District with other centres and
studies to expand by relocating the operations of the Airport area at an advanced
stage. Good climate adds to the high potential agricultural land in the north-western
part of the district making it one of the most important agricultural contributors to the
provincial economy.

In terms of the spatial structure of the KCD, the areas that have not been settled were
largely set aside in colonial times for large scale commercial agriculture. Thus the
pattern of settlement is linked closely with topography and existing transportation
routes, therefore the settlement tends to follow ridge lines and roadways.

2.4. Land Ownership
Large tracts of land in the area are Ingonyama Trust land that falls under the
Traditional Authorities. The two other major categories are privately owned or state
land which could either be commercial farmland/forestry and urban land in the Richard
Bay/ Empangeni and other nodes.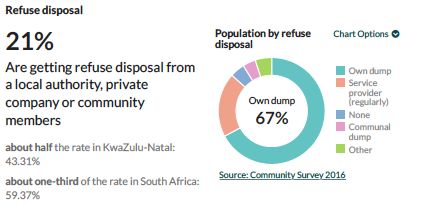
8
         PROFILE: KING CETSHWAYO DISTRICT

3. Social Development Profile
3.1. Key Social Demographics
3.1.1. Population
In 2019 King Cetshwayo District accounted for a total population of 982
726, or 8.6% of the province’s total population. When looking at the
average annual growth rate, it is noted that the District ranked lowest
(relative to its peers in terms of growth) with an average annual growth
rate of 0.7% between 2009 and 2019.
PROFILE: KING CETSHWAYO DISTRICT 9 In 2019, uMhlathuze accounted for the highest proportion of the District’s population at 421 000, followed by uMlalazi at 222 000, uMfolozi at 152 000, Nkandla at 109 000 and the lowest in Mthonjaneni at 79 000. Nonetheless, the population of uMfolozi increased the most over the last 10 years with an average annual growth rate of 1.59%. The City of uMhlathuze had the second highest population growth with an average annual growth rate of 1.51%, Mthonjaneni had the lowest average annual growth rate of -1.12%. 3.1.2. Gender, Age and Race Females constituted 52.6% of the District’s population. The district has a median age of 20 years, which is slightly lower than the provincial median age of 22 and the national age of 26. 49% of the population was younger than 19 years of age, whilst 44% was between 20 and 59 years of age. 95% of the District’s population was Black African, followed by 3% Whites and 2% Indian.
10
PROFILE: KING CETSHWAYO DISTRICT
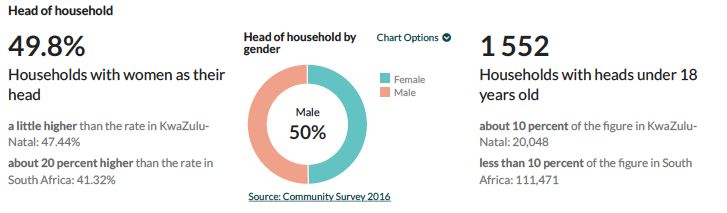
3.1.3. Household Profile
The total number of households decreased somewhat from 225 798 in 2016 to
222 000 in 2019. This represented about 7.7% of the total number of households in
KZN. In 2016, 49.8% of households were headed by women, which was a little higher
than the provincial rate of 47.44% and about 20% higher the national rate of 41.32%.
1 552 households were headed by children younger than 18 years of age, which
constituted about 10% of the total provincial figure of 20 048.
Relative to the province, the KCD had a lower average annual household growth rate
of 1.04% from 2009 to 2019 compared to the provincial growth rate of 1.44% and the
national rate of 2.09%.
3.2. Health
The leading causes of mortality in the district are HIV/AIDS (34.70%), Tuberculosis
(22.70%) and Lower Respiratory Infections (6.60%). The diarrhoeal diseases (22.5%)
are the leading causes of death for under 5 year’s age group.PROFILE: KING CETSHWAYO DISTRICT 11
The District has a 430 bedded Tertiary hospital (Ngwelezane), one Regional hospital
(Queen Nandi), six District Hospitals (Catherine Booth, Ekhombe, Mbongolwane,
Nkandla, Eshowe and KwaMagwaza), 63 fixed Clinics, 1 CHC and 19 mobile clinic
teams. UMfolozi and uMhlathuze sub districts do not have district hospitals and they
use Ngwelezana Hospital for district hospital services.
In 2019, 183 000 people in the King Cetshwayo District were infected with HIV. This
reflects an increase at an average annual rate of 1.14% since 2009, and in 2019
represented 18.62% of the district’s total population. The KwaZulu-Natal Province had
an average annual growth rate of 1.72% from 2009 to 2019 in the number of people
infected with HIV, which is higher than that of the KCD. When looking at the South
Africa as a whole it can be seen that the number of people that are infected increased
from 2009 to 2019 with an average annual growth rate of 2.32%.
HIV+ estimates and AIDS death estimates
King Cetshwayo, 2009-2024
250,000 8,000
7,000
200,000
6,000
150,000 5,000
4,000
100,000 3,000
2,000
50,000
1,000
0 0
HIV+ estimates AIDS death estimates
Source: IHS Markit Regional eXplorer version 1946
3.3. COVID-19
The first case of COVID-19, case Zero, was discovered in South Africa on the 5th of
March 2020, in KwaZulu-Natal. In the early stages of the COVID-19 pandemic in South
Africa, eThekwini Metro in KZN was a hotspot for COVID-19. eThekwini remains the
epicentre of COVID-19 in the province. KCD is fifth with 52 cases being 2 percent of
the provincial total cases but second in fatality rate.12
PROFILE: KING CETSHWAYO DISTRICT
3.4. Poverty Dimensions
3.4.1 Distribution
In 2019, there were 709 000 people living in poverty, using the upper-bound poverty
line definition, across KCD - this is 5.43% higher than the 672 000 in 2009. The
percentage of people living in poverty has decreased from 73.67% in 2009 to 72.11%
in 2019, which indicates a decrease of 1.55 percentage points.
The poverty headcount (proportion of households considered to be multidimensional
poor) of the district decreased from 11.1% in 2011 to 7.7% in 2016. The differences
between the various local municipalities are considerable and ranges between 2.3%
in uMhlatuze to as high as 17.9% in Nkandla (2016 figures).
A positive indication is that the poverty headcount decreased in all the local
municipalities between 2011 and 2016. The intensity of poverty in 2016 is very similar
across the various local municipalities but is important to note that the intensity of
poverty increased between 2011 and 2016 in all local municipalities in the district
except uMhlatuze that recorded a decrease from 41.6% to 39.6%.PROFILE: KING CETSHWAYO DISTRICT 13
CHART 1. NUMBER AND PERCENTAGE OF PEOPLE LIVING IN POVERTY - KING CETSHWAYO DISTRICT
MUNICIPALITY, 2009-2019 [NUMBER PERCENTAGE]
Number and percentage of people in poverty
King Cetshwayo, 2009-2019
720,000 76%
700,000 74%
680,000
72%
660,000
70%
640,000
68%
620,000
66%
600,000
64%
580,000
560,000 62%
540,000 60%
2009 2010 2011 2012 2013 2014 2015 2016 2017 2018 2019
Number of people in poverty Percentage of people in poverty
Source: IHS Markit Regional eXplorer version 1946
The Human Development Index (HDI) measures life expectancy at birth, education
using average years of schooling and gross national income per capita. HDI varies
between zero and one, with zero being the lowest level of development and one the
highest level. In 2019 the District had an HDI of 0.583 compared to the KwaZulu-Natal
with a HDI of 0.617 and 0.662 of National Total as a whole.
3.4.2. Inequality
The Gini-coefficient is a summary statistic of income inequality. If the Gini-coefficient
is equal to zero, income distribution denotes equal income distribution. Meaning, there
is no variance between the high and low-income earners within the population. If the
Gini-coefficient equals one, income is completely inequitable.
In 2019, the Gini coefficient in KCD was at 0.61, which reflects a decrease in the
number over the ten-year period from 2009 to 2019. The KwaZulu-Natal Province and
South Africa, both had a more unequal spread of income amongst their residents (at
0.627 and 0.63 respectively) when compared to King Cetshwayo District Municipality.
In terms of the Gini coefficient for each of the regions within the King Cetshwayo
District Municipality, City of uMhlathuze has the highest Gini coefficient, with an index14
PROFILE: KING CETSHWAYO DISTRICT
value of 0.621. The lowest Gini coefficient can be observed in the Nkandla Local
Municipality with an index value of 0.513.
3.4.3. Unemployment/Employment
In 2019, there were a total number of 87 400 people unemployed in KCD, which is an
increase of 27 900 from 59 500 in 2009. The total number of unemployed people within
the District constitutes 9.71% of the total number of unemployed people in KwaZulu-
Natal Province. The District experienced an average annual increase of 3.91% in the
number of unemployed people, which is worse than that of the KwaZulu-Natal
Province which had an average annual increase in unemployment of 2.59%.
Even though, as can be seen from the below figure, there appears to have been some
decline in the overall District unemployment levels from 2001(50.3%) to 2011 (34.7%),
this is not a significant improvement considering the levels of poverty within the district
and hence more initiatives to reduce unemployment need to be pursued.
Furthermore, the majority of the population in the district is dependent on Government
social grants which is not a sustainable means of living.
3.4.4. Crime
The District has a total of 13 police stations of which six are found in uMhlatuze and
four in uMlalazi. During the period 2008/09 to 2018/19 the overall crime rate has
decreased at an average annual rate of 2.37% within the KCD. Violent crime
decreased by 2.44% since 2008/09, while property crimes decreased by 1.91% over
the same period.PROFILE: KING CETSHWAYO DISTRICT 15
CHART 2. IHS CRIME INDEX - CALENDER YEARS (WEIGHTED AVG / 100,000 PEOPLE) - KING CETSHWAYO
DISTRICT MUNICIPALITY, 2008/2009-2018/2019 [INDEX VALUE]
Overall, Violent and Property Crime Index
King Cetshwayo, 2008/09-2018/19
200
180
160
140
120
100
80
60
40
20
0
OverallCrime Index Violent Crime Index Property Crime Index
Source: IHS Markit Regional eXplorer version 1946
In 2018/19, eThekwini had the highest overall crime rate of the sub-regions within the
overall KwaZulu-Natal Province with an index value of 101. KCD had the second
highest overall crime index at 87.1, with Amajuba having the third highest overall crime
index of 86.8. uMkhanyakude District had the second lowest overall crime index of
46.2 and the uMzinyathi District had the lowest overall crime rate of 45.5.
3.5. Education and Skills Profile
The District is well provided with schools and the facilities are reasonably well
distributed with 452 primary and 204 secondary schools. No information exists
regarding the standard of the facilities or the availability of water and sanitation at the
schools. The number of people without any schooling in KCD accounts for 12.37% of
the number of people without schooling in the province and a total share of 2.85% of
the national. In 2019, the number of people in the District with a matric only was
178,000 which is a share of 7.94% of the province's total number of people that has
obtained a matric. The number of people with a matric and a postgraduate degree
constitutes 8.54% of the province and 1.38% of the national.16
PROFILE: KING CETSHWAYO DISTRICT
Within KCD, the number of people without any schooling decreased from 2009 to 2019
with an average annual rate of -2.82%, while the number of people within the 'matric
only' category, increased from 126,000 to 178,000. The number of people with 'matric
and a certificate/diploma' increased with an average annual rate of 2.33%, with the
number of people with a 'matric and a Bachelor's' degree increasing with an average
annual rate of 7.76%. Overall improvement in the level of education is visible with an
increase in the number of people with 'matric' or higher education.
Highest level of education: age 15+
King Cetshwayo, 2009-2019
100%
Matric &
90% Postgrad degree
80% Matric &
Bachelors degree
70%
Matric &
certificate /
60%
diploma
Matric only
50%
40% Certificate /
diploma without
30% matric
Grade 10-11
20%
10% Grade 7-9
0%
2009 2010 2011 2012 2013 2014 2015 2016 2017 2018 2019
Source: IHS Markit Regional eXplorer version 1946
4. Economic Drivers
4.1. Structure of the Economy
The District is among the key economic role players in KZN in terms of GDP
contribution. It contributed 6.5% of the total estimated provincial GDP generated in
2016. It is within this context that KCD is among the largest contributing districts
towards the provincial GDP such as eThekwini and uMgungundlovu at 59.5%, and
11.3% respectively. The largest contributing local municipalities to the GDP of the
district are the City of uMhlathuze at 44.0%, followed by uMfolozi at 25.7% and
uMlalazi at 21.3%. The mining sector had the highest average annual growth rate in
King Cetshwayo at 4.34%, for the period 2009 and 2019 contributing to the GVA in
the industry. The second highest average annual growth rate is the agriculture sector
averaging at 2.53% per year. The construction sector had an average annual growthPROFILE: KING CETSHWAYO DISTRICT 17
rate of 0.73%, while the electricity sector had the lowest average annual growth of -
0.91%. Overall a negative growth existed for all the industries in 2019 with an annual
growth rate of -0.92% since 2018.
GROSS VALUE ADDED (GVA) BY BROAD ECONOMIC SECTOR - KING CETSHWAYO DISTRICT,
2009, 2014 AND 2019 [R BILLIONS, 2010 CONSTANT PRICES]
Average Annual
2009 2014 2019
growth
Agriculture 1.84 2.42 2.36 2.53%
Mining 2.27 3.02 3.48 4.34%
Manufacturing 6.98 7.91 7.84 1.17%
Electricity 0.46 0.45 0.42 -0.91%
Construction 1.24 1.39 1.33 0.73%
Trade 2.83 3.35 3.49 2.14%
Transport 3.25 3.64 3.80 1.57%
Finance 3.30 3.68 4.07 2.12%
Community services 4.72 5.37 5.62 1.75%
Total Industries 26.89 31.23 32.41 1.89%
Although the economy of KCD is predominantly dependent on the tertiary sector at
47.9%, the secondary sector at 29% also plays a significant role in its economy
especially the manufacturing sub-sector.
Gross Value Added (GVA) by aggregate sector
King Cetshwayo District, 2019
Tertiary sector
Primary sector
Secondary sector
Source: IHS Markit Regional eXplorer version 1946
4.2 Primary Sector
The primary sector consists of two broad economic sectors namely the mining and the
agricultural sector. KCD is home to two mining giants who have capitalised on the
mineral-rich land in the district. Richards Bay Minerals (RBM) is a leading producer of18
PROFILE: KING CETSHWAYO DISTRICT
titanium minerals, high purity iron and zircon, found in the coastal sands of the region.
It supplies most of SA’s needs and exports the remaining products across the globe.
Exxaro KZN Sands is SA’s flagship empowerment mining company, involved in the
mining, beneficiation and smelting of mineral sands, mainly to produce titanium slag
from smelting ilmenite. Other products include zircon, rutile, leucoxene and low
manganese pig iron.
On the other hand, the agricultural sector is a more concentrated activity in the district.
The agricultural sector is of a dual nature, i.e. commercial and subsistence/ traditional
agriculture. The commercial agriculture is based on two main monocrops, namely
sugar cane and forestry. The cane and forestry sectors have been at the forefront of
assisting emerging farmers. The implementation of the forestry projects is guided by
Forestry SA business plan. Subsistence or traditional agriculture is practiced on most
of the Traditional Council lands in the district. The following chart represents the
average growth rate in the GVA for both of these sectors in KCD from 2009 to 2019.
CHART 3. GROSS VALUE ADDED (GVA) BY PRIMARY SECTOR - KING CETSHWAYO, 2009-2019 [ANNUAL
PERCENTAGE CHANGE]
Gross value added (GVA) by primary sector
King Cetshwayo, 2009-2019
35%
30%
25%
20%
15%
10%
5%
0%
2009 2010 2011 2012 2013 2014 2015 2016 2017 2018 2019
-5%
-10%
-15%
Agriculture Mining
Source: IHS Markit Regional eXplorer version 1946
Between 2009 and 2019, the agriculture sector experienced the highest positive
growth in 2017 with an average growth rate of 30.4%. The mining sector reached its
highest point of growth of 15.4% in 2010. The agricultural sector experienced the
lowest growth for the period during 2016 at -9.7%, while the mining sector reaching itsPROFILE: KING CETSHWAYO DISTRICT 19 lowest point of growth in 2015 at -5.5%. Both the agriculture and mining sectors are generally characterised by volatility in growth over the period. 4.3 Secondary Sector The secondary sector consists of three broad economic sectors namely the manufacturing, electricity and the construction sector. The manufacturing activities in King Cetshwayo are metals, metal products and equipment, chemical products, wood and paper. The sector is highly specialized and focuses on exports. Manufacturing activities are concentrated mainly in the areas like uMhlathuze forming part of primary manufacturing centre and uMlalazi forming the secondary manufacturing centre. In Mthonjaneni there are predominantly small-scale ventures, whilst uMfolozi is dominated by Sappi and Mondi manufacturing industries. Metals and related products are the biggest industries in the district contributing more than 40% to the district economy followed by the petroleum, rubber, plastics and chemical industries which contributes 18% and the wood, paper and printing industry that contributed 13%. The manufacturing of food, beverages and tobacco products, transport equipment products, and furniture products, contributed more than R350 million each to the KCD economy. The following chart represents the average growth rates in the GVA for these sectors in King Cetshwayo District Municipality from 2009 to 2019. 4.4 Tertiary Sector The tertiary sector consists of four broad economic sectors namely the trade, transport, finance and the community services sector. The following chart represents the average growth rates in the GVA for these sectors in King Cetshwayo District Municipality from 2009 to 2019. The trade sector experienced the highest positive growth in 2011 with a growth rate of 5.1%. It is evident for the transport sector that the highest positive growth rate also existed in 2011 at 3.9% which is lower than that of the manufacturing sector. The finance sector experienced the highest growth rate in 2011 when it grew by 4.1% and recorded the lowest growth rate in 2010 at 0.8%. The Trade sector had the lowest growth rate in 2019 at -0.5%. The community services sector, which largely consists of government, experienced its highest positive growth in 2011 with 4.1% and the lowest growth rate in 2017 with 0.3%.
20
             PROFILE: KING CETSHWAYO DISTRICT

CHART 4.     GROSS VALUE ADDED (GVA) BY TERTIARY SECTOR - KING CETSHWAYO, 2009-2019 [ANNUAL
             PERCENTAGE CHANGE]

                       Gross value added (GVA) by tertiary sector
                              King Cetshwayo, 2009-2019
           6%

           5%

           4%

           3%

           2%

           1%

           0%
                 2009 2010 2011 2012 2013 2014 2015 2016 2017 2018 2019
           -1%

           -2%

                    Trade        Transport      Finance         Community services

                                                  Source: IHS Markit Regional eXplorer version 1946

The finance sector is expected to grow fastest at an average of 0.90% annually from
R 4.07 billion in King Cetshwayo District Municipality to R 4.26 billion in 2024. The
manufacturing sector is estimated to be the largest sector within the King Cetshwayo
District Municipality in 2024, with a total share of 24.0% of the total GVA (as measured
in current prices), growing at an average annual rate of -1.2%. The sector that is
estimated to grow the slowest is the construction sector with an average annual growth
rate of -4.15%.

In respect of the tourism industry, the District is well endowed with natural resources,
a good climate, cultural heritage, scenic environment and coastal terrain that opens
up avenues for tourism development. KCD and adjoining districts are home to some
of the most famous nature and game reserves and protected areas through the area,
which is also a major tourism draw card.

In the District, the leisure/holiday, relative to the other tourism, recorded the highest
average annual growth rate from 2009 (62 000) to 2019 (50 500) at -2.02%. Visits to
friends and relatives recorded the lowest number of visits in 2019 at 236 000, with an
average annual growth rate of -6.88%.
PROFILE: KING CETSHWAYO DISTRICT 21 4.6. Informal Sector Given the challenges in relation to poverty and unemployment, it is very important that an appropriate economic development strategy for the district is derived and that adequate attention is given to the development of Small, Medium and Micro Enterprise (SMME) as a means of promoting emerging entrepreneurs who will initiate labor intensive job growth. Furthermore, the DGDP aims to provide support to the informal sector as it is recognized that it currently provides many households with an income and it is anticipated to play an increasingly more important role in the future. 5. Service Delivery 5.1. Water and Sanitation The 2016 Community Survey, reveals that 85.6% of the population were getting water from a regional or local service provider, which is slightly higher than the rate in KZN of 83.35%. In addition, 44% of households having access to piped water inside their yard. The area within KCD with the highest number of households with piped water inside the dwelling is City of uMhlathuze Local Municipality with 74.12% of the households with piped water inside the dwelling within the District. Nkandla had the lowest 2.69% of the total households with piped water inside the dwelling KCD. In terms of sanitation in the district, 49% of households had access to flush or chemical toilets whilst 3% had no access to any toilet facilities.
22
          PROFILE: KING CETSHWAYO DISTRICT

5.2. Human Settlements
With 225 798 households, 59% reside in a house whilst 3.3% households are informal
dwellings (shack).

The area within KCD with the highest number of formal dwelling units is the City of
uMhlathuze Local Municipality with a share of 82.73% of the total formal dwelling units
within the District. Nkandla Local Municipality had the lowest number of formal dwelling
units with a share of 1.69% of the total formal dwelling units within KCD.

5.3. Waste Management
Refuse removal is done on weekly basis by the relevant authorities. In rural areas
community members remove to their own dump. Only 21% of the households are
getting refuse disposal from a local authority, private company or community
members, whilst 67% are using their own dump.
PROFILE: KING CETSHWAYO DISTRICT 23 The municipality within the District with the highest number of households where the refuse is removed weekly by the authority is City of uMhlathuze with a share of 77.0% of the total households in KCD. Nkandla Local Municipality had the lowest number of households where the refuse is removed weekly by the authority with a share of 1.78% of the total households within the district. 5.4. Electricity In 2016, 7% of the households had no access to electricity whilst 86% had an in-house prepaid meter. City of uMhlathuze had the highest number of households in the District with electricity for lighting and other purposes with a share of 56.07% whilst Nkandla had the lowest number of households with a share of 5.44% of the total households in the District.
24
          PROFILE: KING CETSHWAYO DISTRICT

5.5. Roads and Transport
Through the Rural Road Asset Management Systems (RRAMS), the District ensures
efficient and effective investment in rural municipal roads through development and
collection of data.

6. Governance,
6.1 Municipal Performance
Municipal Councils and Executive Committees within the district meet regularly, in line
with the legislative requirements of the Municipal Structures Act to meet at least
quarterly. Portfolio committee meetings occur monthly.

All municipalities within the District also comply and meet the requirements of the
Municipal Systems Act and the Municipal Finance Management Act in respect of the
adoption of the IDP, Budget, SDBIP and the Annual Report.

All Ward committees are established and functional and there are adopted ward
committee policies in place in the three Local Municipalities. The Municipalities have
indicated that there is between a 59%-100% attendance at ward committee meetings.
The fact that all ward committees have been trained on their roles and responsibilities
possibly attributes to their functionality status.

The poor performance of Umfolozi is due to the fact that meetings were not held in
some of the wards and thus leading to non- submission of reports. The affected
Umfolozi LM wards are: 1, 5, 11, 17, 6, 8 and 14.

Generally, the district seems stable in terms of appointment of senior management
with KCD having one vacancy of Corporate Services Director while uMfolozi, Nkandla,
Umlalazi and Umhlathuze have no vacancies within senior management.

Mthonjaneni is stable and though with the CFO post having been vacant since
November 2018.

6.2. Municipal capacity
The District strives to improve the skills of employees through facilitating the provision
of quality NQF aligned training in order for employees to skilled programmes, as well
as preparing them for management level. It also addresses the compulsory minimum
competency levels in terms of the MFMA.
PROFILE: KING CETSHWAYO DISTRICT 25
6.3 Traditional Leadership Governance
In KwaZulu-Natal traditional leaders have been identified for the purposes of
participation as contemplated in the Act and it was done through a Provincial Gazette
as required by section 81(2) of the Act. Traditional leaders identified participate in the
proceedings of the municipal councils. There is a system of rotation of participating
traditional leaders on a five-year cycle. All municipal council does not allow traditional
leaders to address the council, however they participate and sit in council committees.
The municipalities pay the participating traditional leaders an allowance. They are paid
an out of pocket expenses (subsistence and travelling expenses). The table below
depicts the number of participating traditional leaders per District and Local
Municipality.
King Cetshwayo District Municipality 8
uMfolozi Local Municipality 1
uMhlathuze Local Municipality 5
uMlalazi Local Municipality 10
Mthonjaneni Local Municipality 3
Nkandla Local Municipality 4
TOTAL 31
7. Projects to Diversify and Grow People and the
Economy
7.1 Social Development Projects
7.2 Spatial Development
7.3 Infrastructure Projects26
PROFILE: KING CETSHWAYO DISTRICT
7.4 Economic Projects
7.5 Environmental forecasts
The District generally has a good climate and is well endowed with natural resources
whose comparative advantages are: A good climate that opens up avenues for
productive agricultural and tourism development; Agriculture with irrigation
infrastructure in place; a scenic environment and the coastal terrain thus creating more
opportunities for tourism development; and the district’s location within KwaZulu-Natal
that is reputable for its African Experience.
The wide variety of ecosystems and habitats in the district allows for high levels of
biodiversity. According to the KwaZulu-Natal Conservation-Plan, some areas have
especially high conservation value with an irreplaceability value of one (the area is
totally irreplaceable) due to the presence of endemic species. District has developed
and adopted a Strategic Environmental Assessment simultaneously with its Spatial
Development Framework (SDF) to ensure that these unique environmental features
are appropriately considered within the context of sustainable development in its area
of jurisdiction.
8. Key Recommendations
8.1 Prioritise Integrated Development Plan
8.2 Investor and Sponsorship opportunitiesPROFILE: KING CETSHWAYO DISTRICT 27
You can also read