Financial ServicesCouncil - NEW ZEALAND RETIREMENT EXPENDITURE GUIDELINES 2019 - Growing and protecting the wealth of New Zealanders - Massey ...
←
→
Page content transcription
If your browser does not render page correctly, please read the page content below

Financial         Services           Council
Growing and protecting the wealth of New Zealanders

NEW ZEALAND RETIREMENT EXPENDITURE GUIDELINES
                    2019

                                                      The Retirement Expenditure Guidelines : 1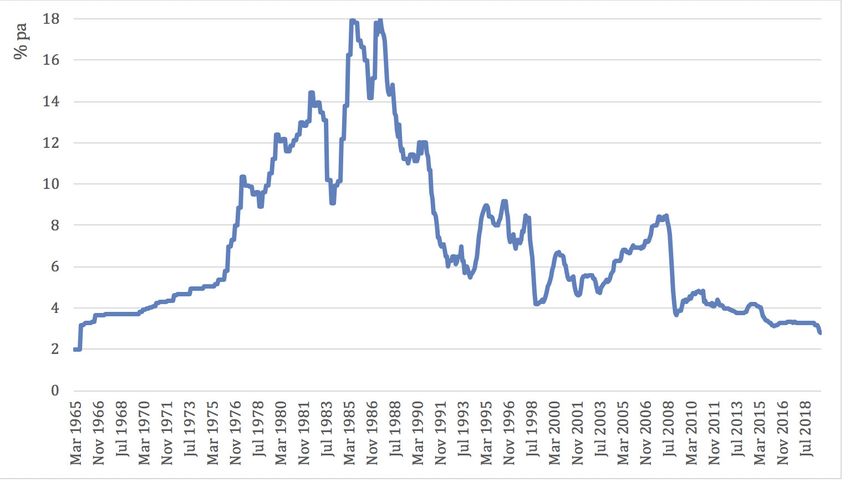
FIRST PUBLISHED NOVEMBER 2019

SPONSORED BY

Financial         Services Council
Growing and protecting the wealth of New Zealanders

The Financial Services Council is a non-profit member organisation and the voice of the financial services sector in
New Zealand. Our 59 members comprise 95% of the life insurance market in New Zealand, and manage funds
of more than $47.5bn. Members include the major insurers in life, disability and income insurance, fund managers,
KiwiSaver, Restricted Schemes, professional services and technology providers to the financial services sector.

PUBLISHED BY

                                          The Fin-Ed Centre is a joint initiative between Westpac and Massey
                                          University. The Centre aims to empower New Zealanders to make more
                                          financially savvy decisions – to give people the tools they need for the
                                          life-long process of managing their finances. Key projects include a 20-
                                          year longitudinal study that follows 300 New Zealanders to understand
                                          their needs for financial knowledge at different life stages, a multi-level
certification programme for personal financial educators and the New Zealand Retirement Expenditure Report – a
joint initiative between the centre and industry body Financial Services Council to establish guidelines for ‘modest’
and ‘comfortable’ retirement.

ACKNOWLEDGEMENTS
This work is based on/includes customised Stats NZ’s data which are licensed by Stats NZ for re-use under the
Creative Commons Attribution 4.0 International licence.

Our thanks to Dr Malcolm Menzies and Professor Martin Young for their peer review, and useful feedback to
enhance the report.

DISCL AIMER
The views expressed in this report are those of the author and do not necessarily represent the views of the
Financial Services Council or its members, the Fin-Ed Centre, Massey University or Westpac New Zealand Limited.
This document is a general guide to retirement expenditure and should not be relied upon or used as a substitute
for professional advice specific to individual circumstances. The author and contributors are not authorised or
registered financial advisers.

AUTHOR
Dr Claire Matthews – Research Associate, Westpac Massey Fin-Ed Centre and Director, Academic Quality,
Massey Business School

2 : The Retirement Expenditure Guidelines 2019
The triennial review of retirement income policy is currently being undertaken by the Commission for Financial
Capability, providing an opportunity for New Zealanders to offer their views on retirement income. This is a subject
of increasing interest for New Zealanders, with continuing discussion of issues such as the age of eligibility for NZ
Superannuation, the adequacy of NZ Superannuation, longevity concerns, and the potential use of means-testing
to better direct NZ Superannuation to those who need it most. The level of interest is driven, at least in part, by the
fact that the entire baby boomer generation will have reached the current age of eligibility for NZ Superannuation
within ten years. The following generation, Generation X, is also increasingly concerned about their ability to
adequately prepare for the retirement that they now see on the horizon. New Zealanders have expectations and
aspirations about their future retirement, but this is accompanied by concerns due to the lack of certainty about
how retirement will be experienced and the not-unrelated question of the financial resources needed to provide a
person’s desired sort of retirement.
The 2019 Retirement Expenditure Guidelines in this report are the eighth in a series that commenced in 20121,2,
to assist pre-retirement New Zealanders make financial plans for their retirement. Specifically, the Retirement
Expenditure Guidelines provide information about actual levels of expenditure by New Zealanders who have
already retired; however, this does not include an evaluation of the sufficiency of NZ Superannuation. Pre-retirees
can use this information to plan budgets for their desired future retirement lifestyle, to provide a foundation from
which to determine the savings they need to achieve their retirement objectives.
Expenditure patterns change over time due to societal changes and the effect of inflation. This report addresses
these changes, adjusting for inflation to 30th June 2019. In addition, we explore the impact of the current low
interest rate environment.
KEY FINDINGS IN THIS REPORT:
The New Zealand Retirement Expenditure Guidelines as at 30th June 2019
ONE-PERSON HOUSEHOLDS TWO-PERSON HOUSEHOLDS
WEEKLY NZ SUPER RATES $411.15 $632.54
After tax
Total Weekly Expenditure Metro Provincial Metro Provincial
No Frills budget $602.11 $574.35 $898.73 $639.90
Choices budget $1190.37 $830.54 $1436.00 $1135.70
y Most New Zealanders aspire to and achieve a better standard of living in retirement than can be supported by
NZ Superannuation.
Expenditure changes from 2018-2019
y The effect of inflation on expenditure for each of the household groups is in the range -0.45% to 1.57%, with all
groups having an effective inflation rate below the CPI rate for the same period.
y The key inflationary drivers for superannuants for the twelve months ended 30th June 2019 were Grocery Food,
Restaurant Meals and Ready-to-eat Food, Property Rates and Related Services, Private Transport Supplies and
Services, Insurance and Accommodation Services.
y All household groups considered in this report are spending more than is received from NZ Superannuation.
1 Previous editions can be found on the Fin-Ed Centre website.
2 The basis for calculating the Retirement Expenditure Guidelines was changed with effect from the 2014 report. Details of the changes are provided in that report.
The Retirement Expenditure Guidelines : 3Saving for retirement
y The earlier a person starts saving for retirement the better, but it is never too late to start unless they have retired.
y Other income, such as part-time employment, or delayed retirement are two ways to reduce the lump sum required.
y KiwiSaver offers the opportunity for a solid contribution towards the additional income required to provide the
retirement lifestyle to which New Zealanders aspire.
Low interest rate environment
y The current low interest rate environment is challenging for retirees.
y Careful consideration is needed to ensure retirement savings generate the level of income required to fund the
intended lifestyle, without taking on a level of risk that is higher than appropriate.
EXPENDITURE CHANGES IN 2019 3
We begin by looking at how expenditure has been impacted by inflation for the twelve months ended 30th June 2019.
TABLE 1: CHANGES IN TOTAL WEEKLY EXPENDITURE BY HOUSEHOLD GROUP 2018 - 2019
Total Weekly Expenditure CHANGE 2018 – 2019
2018 2019 $ %
One-person No Frills – Metro 598.45 602.11 3.66 0.61%
households No Frills – Provincial 569.43 574.35 4.92 0.86%
Choices – Metro 1190.13 1190.37 0.24 0.02%
Choices – Provincial 834.27 830.54 -3.73 -0.45%
Two-person No Frills – Metro 885.31 898.73 13.42 1.52%
households No Frills – Provincial 630.03 639.90 9.87 1.57%
Choices – Metro 1417.85 1436.00 18.15 1.28%
Choices – Provincial 1118.92 1135.70 16.78 1.50%
CPI 1.70%
Table 1 above shows the change in total expenditure between 2018 and 2019 for each of our household groups.
The change for all groups was less than the rate of inflation as measured by the CPI, with the Choices-Provincial
One-Person Household having a small reduction in their expenditure. The different inflation rate for each household
group results from the fact that the expenditure pattern differs for each group and does not exactly match the basket
of goods used to calculate the CPI.
The inflation rate for each household group results from the interaction of many items, so it is very difficult to identify
the reason for the differences between them. However, one factor that appears to help explain the difference
for the two Choices One-Person Households relative to the other household groups appears to be their lower
expenditure on Food, and the sub-group Grocery Food in particular – they spend 10.6% (Metro) and 10.8%
(Provincial) on Food compared to more than 14.6% for the other household groups, and 5.0% (Metro) and 4.9%
(Provincial) on the Grocery Food sub-group compared to at least 7.3% for most of the other household groups.
As we have noted previously, the overall CPI inflation rate can hide substantial differences in inflation between
expenditure classes, and this remains true for the twelve months ended 30th June 2019. The total CPI inflation rate
for that period was 1.7%, but included inflation rates ranging from 7.70% for Cigarettes and Tobacco to -23.80%
for Telecommunication Equipment. Key expenditure groups for all our households are Food (with inflation of
3 The detailed Retirement Expenditure Guidelines are in Appendix 1.
4 : The Retirement Expenditure Guidelines 20191.1%) and Housing and Household Utilities (2.8%). Transport (1.8%) and Recreation and Culture (1.8%) are also
important expenditure groups for our Choices households.
There is also substantial variation of inflation rates between the sub-groups that comprise the expenditure groups.
The key expenditure sub-groups driving the inflationary impact for superannuants for the twelve months ended 30th
June 2019 were Grocery Food (with inflation of 2.7%), Restaurant Meals and Ready-to-eat Food (3.3%), Property
Rates and Related Services (4.6%), Private Transport Supplies and Services (3.0%), and Accommodation Services
(5.0%). These sub-groups had higher levels of inflation than the average and also represent a substantial portion
of expenditure for our households.
On 1st April 2019, the two key rates of New Zealand Superannuation rates increased to4:
TABLE 2: NZ SUPERANNUATION RATES FROM 1 APRIL 2019
Single, living alone $411.15 per week after tax at the M rate
Couples, both qualify $632.54 per week after tax at the M rate
The CPI rate for the year ended 31 March 2019 was 1.5%, while the increase in New Zealand Superannuation
from 1 April was substantially greater at 2.56%. This reflects the legislated adjustment methodology, which uses
the annual CPI for the year ended one quarter before the adjustment is made (1.90% to 31 December 2018),
while also maintaining relativity with the net average wage. Wages grew at a faster rate than the CPI, hence the
higher adjustment for NZ Superannuation.
TABLE 3: THE DIFFERENCE BETWEEN TOTAL EXPENDITURE AND CURRENT RATES OF NZ
SUPERANNUATION
TOTAL WEEKLY NZ SUPER DIFFERENCE DIFFERENCE CHANGE IN
EXPENDITURE IN 2019 IN 2018 DIFFERENCE
2018 – 2019
One-person No Frills – Metro 602.11 -$190.96 -$197.58 (-3.47%)
households
No Frills – Provincial 574.35 -$163.20 -$168.56 (-3.28%)
$411.15
Choices – Metro 1190.37 -$779.22 -$789.26 (-1.29%)
Choices – Provincial 830.54 -$419.39 -$433.40 (-3.34%)
Two-person No Frills – Metro 898.73 -$266.19 -$268.59 (-0.90%)
households
No Frills – Provincial 639.90 -$7.36 -$13.31 (-80.84%)
$632.54
Choices – Metro 1436.00 -$803.46 -$801.13 (0.29%)
Choices – Provincial 1135.70 -$503.16 -$502.20 (0.19%)
All households spend more than they receive from NZ Superannuation. As the table above shows, the difference
has slightly decreased for most household groups, because the annual increase in NZ Superannuation was greater
than the rate of inflation.
Table 4 shows an estimated lump sum required at retirement to fund the additional spending over NZ
Superannuation for each group, assuming no other income. It also shows the weekly savings required to achieve
that lump sum, depending on the age at which saving commences. Starting saving at a younger age means a
much smaller regular amount of savings is required.
4 Source: https://www.workandincome.govt.nz/eligibility/seniors/superannuation/payment-rates.html
The Retirement Expenditure Guidelines : 5TABLE 4: ESTIMATED SAVINGS REQUIREMENT TO FUND THE DIFFERENCES BETWEEN
EXPENDITURE AND NZ SUPERANNUATION5
WEEKLY LUMP SUM WEEKLY SAVINGS WEEKLY SAVINGS
DIFFERENCE REQUIRED6 FROM AGE 507 FROM AGE 258
One-person households No Frills – Metro $190.96 $187,000 $230 $74
No Frills – Provincial $163.20 $160,000 $196 $64
Choices – Metro $779.22 $764,000 $937 $304
Choices – Provincial $419.39 $411,000 $504 $163
Two-person households No Frills – Metro $266.19 $261,000 $320 $104
No Frills – Provincial $7.36 $7,000 $8 $3
Choices – Metro $803.46 $787,000 $966 $313
Choices – Provincial $503.16 $493,000 $605 $196
These lump sums, and the associated savings to achieve them, can be reduced in a number of ways. For example,
we have assumed that the household has no income other than NZ Superannuation, but we know many New
Zealanders continue to work beyond the age of 65 when they become eligible for NZ Superannuation. In Table 5,
we consider the impact on the lump sum and savings required in two different scenarios.
Scenario 1: We assume that the household has ongoing additional income of $5,000 net per annum, perhaps
from part-time work. This has the effect of reducing the difference by $96 per week.
Scenario 2A: We assume that the household member(s) delays retirement until the age of 67. This allows an
additional two years of savings, and also reduces the retirement period that needs to be funded by
the same two years.
Scenario 2B: We make the additional assumption that the household member(s) receives NZ Superannuation
from the age of 65 and saves the full amount, which is $42,759 for the one-person household and
$65,784 for the two-person household for the two years (excluding any interest or other return on
these funds).
TABLE 5: ESTIMATED SAVINGS REQUIREMENT UNDER DIFFERENT SCENARIOS
SCENARIO 1 SCENARIO 2A SCENARIO 2B
WEEKLY WEEKLY WEEKLY
LUMP SUM LUMP SUM
SAVINGS SAVINGS SAVINGS
One-person households No Frills – Metro $93,000 $114 $167,000 $189 $143
No Frills – Provincial $66,000 $81 $148,000 $161 $115
Choices – Metro $670,000 $822 $718,000 $771 $725
Choices – Provincial $317,000 $389 $386,000 $414 $369
Two-person households No Frills – Metro $167,000 $204 $245,000 $263 $193
No Frills – Provincial N/A N/A $6,000 $7 N/A
Choices – Metro $693,000 $850 $740,000 $794 $724
Choices – Provincial $399,000 $490 $464,000 $498 $427
5 The lump sums in Tables 4 and 5 were calculated using the Sorted calculator available at https://sorted.org.nz/tools/retirement-planner. The actual length of retirement
to be planned for will vary for each person, depending on the age of retirement and life expectancy. To help work this out, use the retirement planner at sorted.org.nz.
We assumed retirement at age 65 with a life expectancy of 90 (for both in couples).
6 The Total Savings Required is rounded to the nearest $000
7 For a 50-year old individual/couple.
8 For a 25-year old individual/couple.
6 : The Retirement Expenditure Guidelines 2019KiwiSaver can help meet these savings requirements. In Table 6 we consider how much a person might have in
their KiwiSaver account at age 65. The first two columns consider two different contribution rates, and assume
the person is joining KiwiSaver today at the age of 50. The average KiwiSaver balance as at 30th June 2019
was $20,084. In the final column we have retained the assumption that the person is aged 50 but added an
assumption that they joined KiwiSaver at inception in 2007 and now has the average KiwiSaver balance of
$20,000 in their account.
TABLE 6: ESTIMATED KIWISAVER BALANCE9
JOINING TODAY JOINING TODAY EXISTING MEMBER
ANNUAL INCOME
(3% CONTRIBUTION) (4% CONTRIBUTION) (3% CONTRIBUTION)
$52,83210 $60,644 $70,378 $85,573
$75,000 $77,787 $91,577 $102,732
$100,000 $99,531 $117,817 $124,424
These calculations are for an individual, so the balances should be increased for couples to reflect their individual
incomes and contribution rates. For example, a couple where one person is earning $75,000 and contributing 4%
and the other person is on the median wage and contributing 3% would have $152,221 in total savings at age
65, assuming both join KiwiSaver today.
The benefit of a higher contribution rate is illustrated by the difference between columns one and two. The minimum
contribution rate is 3%, but as a result of recent legislative changes, KiwiSaver members can now choose to
contribute at higher rates of 4%, 6%, 8% or 10%. A KiwiSaver member can choose to amend their contribution
rate once every three months, and it would be useful for members to regularly consider whether a higher
contribution rate is possible. However, KiwiSaver is not the only option for retirement savings, so if an increase in
savings is possible, consideration should also be given to the best place for those savings to go.
Accessing the capital in the family home is another option available to some home owners to help provide this lump
sum. This option will not suit everyone and relies on the ability to sell the home and buy a replacement at a lower
price, either by downsizing or by moving to a less expensive area.
9 The KiwiSaver balances in Table 6 were calculated using the Sorted calculator available at https://sorted.org.nz/tools/kiwisaver-savings-calculator. We have assumed
investment in a balanced fund with fortnightly contributions.
10 $52,832 is the median annual income for the year ended 30th June 2019. Source: https://www.stats.govt.nz/information-releases/labour-market-statistics-income-june-
2019-quarter.
The Retirement Expenditure Guidelines : 7THE LOW INTEREST ENVIRONMENT
We have now been experiencing a low interest rate environment in New Zealand for ten years, so younger people
may see the current rates as normal. Older New Zealanders, however, can recall the higher rates we have had
historically. Figure 1 uses the six-month term deposit rate to illustrate how interest rates have changed since 1965.
FIGURE 1: SIX-MONTH TERM DEPOSIT RATE11
While the current low rates are good news for borrowers, they create challenges for savers, particularly those
relying on investment returns to provide income. This becomes clearer if put into dollar terms. At a rate of 2.79%
pa (the six-month term deposit rate in September 2019), a term deposit of $100,000 will generate income of
$2790, or $53 per week. This compares to $7560, or $145 per week, at an interest rate of 7.56% pa, which
would have been generated in September 2008 or $17,300 ($333 per week), at an interest rate of 17.30%, in
September 1987.
TABLE 7: REAL INTEREST RATES
NOMINAL
INFLATION RATE REAL INTEREST RATE
INTEREST RATE
September 1987 17.30% 16.90% 0.40%
September 2008 7.56% 5.10% 2.56%
September 2019 2.79% 1.70% 1.09%
It is important to remember these numbers represent nominal returns, before considering the effect of inflation.
Assuming an inflation rate of 1.7%, being the rate for the year ended June 2019, the six-month interest rate of
2.79% in September 2019 represents a real interest rate before tax of 1.09%. As we see in Table 7, when we
take account of the effect of the higher inflation rates historically, it offers a different perspective of the apparently
higher returns being received. In addition, we can see that the real return has been worse than what is currently
being experienced. It is important to remember that these rates are before taxes, which further reduce the return to
the investor.
11 Source: RBNZ Statistics B3 - Retail interest rates on lending and deposits.
8 : The Retirement Expenditure Guidelines 2019Prospects of further interest rate cuts suggest the real interest rate may fall further, and could even fall below zero.
The lump sums calculated in Tables 4 and 5 assume the funds are invested in balanced managed funds before and
after retirement, earning assumed net returns in excess of those that are expected to be achieved in term deposits.
This means if you intend to withdraw your KiwiSaver balance at age 65 to place the funds on term deposit, the
lump sum required would be greater.
The current low interest rates can encourage investors to seek out higher rates. On 11th October 2019, interest
rates for six-month investments of $10,000 ranged from 1% pa at the Public Trust to 4% pa for a Secured First
Ranking Debenture with FE Investments according to Good Returns12, with rates of up to 6.3% pa available for a
three-year term. However, the risks of such investments are greater, which is reflected in the Public Trust having a
long-term credit rating of AA from Fitch, compared to a “B” long-term issuer credit rating from Standard & Poor’s for
FE Investments. The consequences of chasing higher returns without full consideration of the risks were seen in the
finance company collapses of 2008/2009.
In general, KiwiSaver members are not required to withdraw their funds in full at the Qualifying Age of 65. Most
KiwiSaver providers will allow a gradual drawdown of the KiwiSaver balance, although there may be some
constraints such as withdrawal frequency and minimum withdrawals. An annuity is another option to consider, as it
offers a regular income throughout retirement. Currently there is only one provider of annuity-type products in New
Zealand, Lifetime (https://www.lifetimeincome.co.nz/).
Those saving for retirement and those in retirement need to think very carefully about where they put their savings,
particularly in the decumulation stage in retirement. The rate of return will have an impact on the level of income
generated but consideration also needs to be given to what is an acceptable level of risk for the individual(s).
SUMMARY AND CONCLUSIONS
All households in this survey continue to spend at levels in excess of New Zealand Superannuation. The
difference has slightly decreased for most household groups and increased slightly for the Choice-Metro One-
person household group. To achieve their desired standard of living in retirement, as reflected in these levels of
expenditure, most New Zealanders will still need to make provision for supplementary retirement income in addition
to what NZ Superannuation can provide.
Costs continue to rise for retirees, with the main contributors to increasing costs being related to food, including
Grocery Food (with inflation of 2.7%), Restaurant Meals and Ready-to-eat Food (3.3%), Property Rates and
Related Services (4.6%), Private Transport Supplies and Services (3.0%), and Accommodation Services (5.0%).
While the lump sum required to fund the difference in spending over NZ Superannuation for retired households
can seem daunting, there are ways in which it can be reduced. These include other income, delayed retirement,
and accessing value in the family home. In addition, KiwiSaver membership provides a useful start to providing the
savings needed to achieve these lump sums.
The continued low interest rate environment provides challenges for retired New Zealanders. It highlights the needs for
careful consideration of the decumulation stage of retirement savings, when the funds are accessed to contribute towards
expenditure in retirement. The need to achieve an appropriate return without taking undue risk must be paramount.
12 Source: depositrates.co.nz
The Retirement Expenditure Guidelines : 9The guidelines contained in the report can be used as input to planning for retirement income.
For example, the size of the weekly difference between NZ Superannuation and a particular
level of expenditure might be multiplied to calculate a “ball park” savings target for a given
length of retirement. Targets derived this way can range from zero to several hundred
thousand dollars. However, this crude method does not consider individual factors such as
existing savings, time to retirement and life expectancy, nor inflation, fees and interest.
A more sophisticated approach is to feed desired retirement expenditure levels into a
retirement planning calculator such as the one found at https://sorted.org.nz/tools/retirement-
planner.
The lump sum calculations and discussion of interest rates in this report assumes the savings
will be fully consumed over retirement. The New Zealand Society of Actuaries has prepared
some useful rules of thumb for spending down savings: see https://actuaries.org.nz/new-rules-
of-thumb-to-help-kiwis-spend-their-retirement-savings/.
Alternatively, those planning their retirement income can consult an Authorised Financial
Advisor (see http://fma.govt.nz/consumers/getting-financial-advice/).
KiwiSaver provides a simple means of achieving a lump sum that can provide that investment
income, with help from your employer, via the compulsory employer contribution, and the
Government, via the annual Member Tax Credit.
Whatever path is taken, we hope that the guidelines contained in this report will be of
assistance to New Zealanders as they plan for their retirements.
10 : The Retirement Expenditure Guidelines 2019APPENDIX 1: THE NEW ZEALAND RETIREMENT EXPENDITURE
GUIDELINES
ONE PERSON HOUSEHOLDS, EXPENDITURE PER WEEK
NO FRILLS CHOICES
METRO PROVINCIAL METRO PROVINCIAL
FOOD 107.79 84.11 125.75 89.51
Fruit and vegetables 21.22 12.12 18.09 11.54
Meat, poultry and fish 18.32 12.42 15.53 8.90
Grocery food 40.15 41.39 50.32 38.80
Non-alcoholic beverages 6.65 4.81 5.83 3.78
Restaurant meals and ready-to-eat food 20.82 13.01 36.10 26.89
ALCOHOLIC BEVERAGES, TOBACCO AND ILLICIT DRUGS 14.51 10.88 20.51 8.27
Alcoholic beverages 10.96 6.62 18.72 7.55
Cigarettes & tobacco ..S ..S ..S ..S
CLOTHING AND FOOTWEAR 7.73 18.33 55.40 51.33
Clothing 6.30 13.09 ..S 43.40
Footwear ..S 5.26 0.00 ..S
HOUSING AND HOUSEHOLD UTILITIES 129.27 166.97 185.44 180.19
Actual rentals for housing ..S 40.76 0.00 ..S
Home ownership 33.07 7.09 14.42 ..S
Property maintenance 3.17 33.36 7.66 43.53
Property rates and related services 54.65 44.29 69.67 51.53
Household energy 31.37 37.75 39.87 40.51
HOUSEHOLD CONTENTS AND SERVICES 26.47 20.54 55.09 64.19
Furniture, furnishings and floor coverings ..S 5.29 ..S 15.27
Household textiles 2.28 0.69 0.00 ..S
Household appliances ..S 5.96 14.08 23.33
Glassware, tableware and household utensils ..S ..S 13.14 ..S
Tools and equipment for house and garden 7.87 1.89 2.69 11.15
Other household supplies and services 7.18 6.03 15.50 8.64
HEALTH 86.18 22.25 31.28 82.71
Medical products, appliances & equipment 70.43 6.93 7.54 5.33
Out-patient services 12.68 15.11 23.57 77.69
TRANSPORT 62.33 77.75 284.30 124.97
Purchase of vehicles ..S 39.42 ..S 62.55
Private transport supplies & services 24.18 29.45 55.31 34.37
Passenger transport services ..S 7.95 147.66 24.52
COMMUNICATION (TELECOMMUNICATION) 21.56 20.68 24.20 19.10
Postal services ..S 1.37 ..S ..S
Telecommunications equipment 0.00 ..S 0.00 ..S
Telecommunications services 22.52 20.00 25.61 19.81
RECREATION AND CULTURE 53.22 69.98 235.30 104.52
Audio-visual and computing equipment 3.03 2.54 4.54 3.51
Other recreational equipment and supplies 8.40 11.13 19.73 23.67
Recreational and cultural services 19.61 26.49 75.67 39.53
Newspapers, books and stationery 13.39 6.43 11.89 4.50
Accommodation services ..S 26.79 142.51 37.95
EDUCATION ..S ..S 0.00 ..S
MISCELLANEOUS GOODS & SERVICES 93.06 82.84 173.09 105.75
Personal care 10.74 11.64 13.35 25.70
Personal effects nec ..S 7.84 24.58 7.10
Insurance 53.66 50.84 82.36 71.06
Credit services 0.52 0.26 1.74 0.78
Other miscellaneous services ..S 14.31 55.33 ..S
OTHER EXPENDITURE 6.20 4.50 92.40 16.50
Interest payments 6.10 ..S ..S ..S
Contributions to savings ..S ..S ..S 13.10
Money given to others (excluding donations) 11.40 ..S ..S ..S
TOTAL 602.11 574.35 1190.37 830.54
The Retirement Expenditure Guidelines : 11TWO PERSON HOUSEHOLDS, EXPENDITURE PER WEEK
NO FRILLS CHOICES
METRO PROVINCIAL METRO PROVINCIAL
FOOD 148.70 126.07 213.61 188.27
Fruit and vegetables 20.24 19.85 23.96 24.93
Meat, poultry and fish 24.43 22.26 28.78 30.95
Grocery food 65.36 54.57 76.98 78.95
Non-alcoholic beverages 7.57 7.77 9.92 9.71
Restaurant meals and ready-to-eat food 31.01 21.14 75.35 43.69
ALCOHOLIC BEVERAGES, TOBACCO AND ILLICIT DRUGS 21.65 21.08 41.82 35.93
Alcoholic beverages 15.41 16.03 30.61 24.41
Cigarettes & tobacco ..S ..S ..S ..S
CLOTHING AND FOOTWEAR 14.67 14.57 29.53 27.25
Clothing 10.82 9.35 ..S 21.85
Footwear 4.03 5.37 2.89 5.37
HOUSING AND HOUSEHOLD UTILITIES 235.26 161.50 210.13 196.80
Actual rentals for housing 28.32 26.82 ..S ..S
Home ownership 45.88 33.75 59.96 49.77
Property maintenance 57.31 11.37 29.53 31.39
Property rates and related services 46.52 44.74 68.78 55.42
Household energy 43.81 45.40 51.78 51.14
HOUSEHOLD CONTENTS AND SERVICES 39.76 31.58 64.80 52.94
Furniture, furnishings and floor coverings 11.60 3.56 14.35 9.36
Household textiles 4.36 1.98 2.28 2.87
Household appliances 8.94 8.53 12.23 9.15
Glassware, tableware and household utensils 2.33 0.85 3.92 4.88
Tools and equipment for house and garden 6.57 4.68 8.56 8.76
Other household supplies and services 5.83 12.17 23.82 18.21
HEALTH 43.25 35.48 70.75 98.14
Medical products, appliances & equipment 11.45 14.67 22.21 43.51
Out-patient services 23.89 20.29 47.88 53.06
TRANSPORT 190.40 87.28 384.63 189.67
Purchase of vehicles 118.17 27.23 225.22 46.55
Private transport supplies & services 50.49 48.37 71.21 79.94
Passenger transport services 16.85 12.49 72.98 60.67
COMMUNICATION (TELECOMMUNICATION) 26.14 21.82 36.26 29.31
Postal services 2.96 1.14 1.82 1.60
Telecommunications equipment 0.96 ..S ..S ..S
Telecommunications services 23.64 21.59 30.65 29.63
RECREATION AND CULTURE 90.69 59.78 178.95 153.30
Audio-visual and computing equipment 3.92 2.54 9.97 6.81
Other recreational equipment and supplies 14.67 7.69 27.62 17.60
Recreational and cultural services 33.37 20.12 58.22 65.92
Newspapers, books and stationery 8.36 7.71 13.61 12.00
Accommodation services 24.44 9.05 74.01 16.10
EDUCATION ..S 3.45 ..S ..S
MISCELLANEOUS GOODS & SERVICES 76.92 63.69 131.03 131.78
Personal care 15.76 14.96 23.99 28.91
Personal effects nec 8.48 3.81 8.37 7.73
Insurance 51.40 44.17 96.14 92.75
Credit services 0.87 1.04 1.91 1.39
Other miscellaneous services ..S 0.45 ..S 3.02
OTHER EXPENDITURE 11.30 13.60 74.50 32.30
Interest payments 9.80 7.20 42.20 20.80
Contributions to savings ..S 1.30 31.10 7.40
Money given to others (excluding donations) 0.50 5.00 ..S ..S
TOTAL 898.73 639.90 1436.00 1135.70
12 : The Retirement Expenditure Guidelines 2019APPENDIX 2: ABOUT THE RETIREMENT EXPENDITURE GUIDELINES
THE DATA
The data used to prepare the 2019 Retirement Expenditure Guidelines are from the Statistics New Zealand’s triennial
2015/16 HES13 for the year ended 30 June 2016. The HES does not include the entire New Zealand population;
rather it targets New Zealanders aged 15 years or older that are usually resident in New Zealand and that live in
private homes. The sample for the HES comprised approximately 5000 households, and a response rate of 78.1%14
was achieved. HES expenditure data was collected in different ways dependent on the nature of the expenditure: large
or irregular expenditure types (eg health) were collected on the basis of three-month recall; twelve-month recall was
used for housing-related costs and recreation and culture; regular commitments such as electricity, telephone and rates
were collected via the latest payment; and a fourteen-day diary was used for smaller, more regular expenditure types.
Although data from the HES is published on the Statistics New Zealand website, it is not in a form that is helpful to a
person interested in retirement expenditure. For this report, Statistics New Zealand extracted expenditure data from
the HES using specifications we supplied, which we have then adjusted for inflation for the 12 months to 30th June
2017, and subsequently for the 12 months to 30th June 2018 and then to 30th June 2019. The data extracted are
only for retired households, defined as being where one form of income received in the household is New Zealand
Superannuation, a war pension or other government pension, and grouped according to the number of people in the
household and geographic region.
THE RETIREMENT EXPENDITURE GUIDELINES
The New Zealand Retirement Expenditure Guidelines comprise a set of eight expenditure guidelines, with each guideline
reflecting a different group of retirees. The retirement groups represent specific combinations of geographic location,
household size and budget type. It is important to note that the guidelines do not represent suggested or recommended
levels of expenditure – they reflect actual levels of expenditure in retired households, as defined above, as determined
from the HES.
The guidelines have been produced for two geographic-related groupings based on a household’s location. The first is
the Metro budget, based on data for the Auckland and Wellington Regional Council areas and Christchurch City. The
second is the Provincial budget for the rest of New Zealand.
Two types of households have been included in the guidelines: the first is the one-person household; and, the other is a
two-person household. While it is true that retired households can comprise a range of living arrangements, including
households of three or more people, these guidelines cannot cater for every situation. Approximately 80% of all people
aged 65+ live in households of one and two persons according to data from the 2013 census.15
Finally, two levels of expenditure have been included in the guidelines. The No Frills guidelines reflect a basic standard
of living that includes few, if any, luxuries. The Choices guidelines represent a more comfortable standard of living,
which includes some luxuries or treats. The No Frills Guidelines are based on the average expenditure of the second
quintile of the HES for retired households, while the Choices Guidelines are based on the average expenditure of the
fourth quintile of the HES for retired households. The second quintile comprises households in the 21st to 40th percentile
for household income, while the fourth quintile comprises households in the 61st to 80th percentiles for household
income. The income ranges for the five quintiles, in 2016 figures, are shown below:
13 The description of the HES in this section is adapted from information on the Statistics New Zealand website. Detailed information about the triennial Household Economic
Survey can be found at http://archive.stats.govt.nz/browse_for_stats/people_and_communities/Households/HouseholdExpenditureStatistics_HOTPYeJun16
14 The final sample size and the response rate reflect steps taken to boost the response rate, including the use of imputation. Details are on the Statistics New Zealand
website.
15 Source: 2013 Census QuickStats about people aged 65 and over. Statistics NZ (available from http://archive.stats.govt.nz/Census/2013-census/profile-and-
summary-reports/quickstats-65-plus.aspx)
The Retirement Expenditure Guidelines : 13TABLE 8: QUINTILE INCOME RANGES
INCOME RANGE INCOME RANGE RETIREMENT EXPENDITURE
QUINTILE
METRO PROVINCIAL GUIDELINES
First Under $33400 Under $26000
Second $33400 to under $47200 $26000 to under $37100 No Frills
Third $47200 to under $78200 $37100 to under $54100
Fourth $78200 to under $122100 $54100 to under $86900 Choices
Fifth $122100 and over $86900 and over
Data for the HES is collected over a 12-month period and can include expenditure that overlaps two calendar
years – no adjustment is made for that difference in coverage. For this report the HES data have been adjusted for
the effect of inflation between the June 2016 quarter and the June 2019 quarter.16
EXPLANATORY NOTES
y These guidelines do not represent recommended levels of expenditure.
y The levels of expenditure shown in the guidelines may be used to assist in the development of projected
retirement budgets, by providing information about actual levels of expenditure in retired households in
standard expenditure categories.
y The guidelines are based on averages for quintiles.
y There are too few responses for spending in some expenditure sub-classes to permit reliable estimation;
however, these responses can be included in the class estimation where there are more responses. As a
result the classes are not always the totals of the sub-classes.
y The HES, on which the guidelines are based, relies on participants to accurately record their
expenditure, and is only for a two-week period, which may not represent a typical fortnight for that
household.
y The guidelines should not be used as a substitute for professional advice specific to individual
circumstances.
y There is no retirement age in New Zealand, but the age of eligibility for NZ Superannuation (currently
65) is commonly used as a proxy for this. The definition of a retired household follows from this, as
being a household where one form of income is New Zealand Superannuation, a war pension or other
government pension. However, it is recognised that a retired household may include one or more
persons who are still working part-time or even full-time.
16 CPI information and data was sourced from http://www.stats.govt.nz/browse_for_stats/economic_indicators/CPI_inflation.aspx
An overall CPI figure is calculated by Statistics New Zealand, as well as CPIs for the constituent classes and sub-classes. The HES data have been adjusted for the effect
of inflation using the appropriate class and sub-class CPIs.
14 : The Retirement Expenditure Guidelines 2019You can also read