Q4 2020 sector scorecard - Consumer discretionary, materials, and industrials led in the third quarter.
←
→
Page content transcription
If your browser does not render page correctly, please read the page content below
Boston Gas Company
1/29/2021                                                             Quarterly sector update Q4 2020 | Fidelity                    d/b/a National Grid
                                                                                                                                    D.P.U. 20-120
                                                                                                                                    Attachment DPU-19-14-1
                                                                                                                                    Page 1 of 17

            Q4 2020 sector scorecard
            Consumer discretionary, materials, and industrials led in the third quarter.
            BY D EN IS E CH IS H O LM , S EC TO R S TR ATEG I S T, F I D ELI TY M A N A G EM EN T & R ES EA R C H C O M PA N Y, EQ U I TY
            D IV IS IO N ,F ID ELI TY A S S ET M A N A G EM EN T – 1 0 /2 7 /2 0 2 0 11 M I N R EA D

                                                                                                                                                             /
Boston Gas Company
1/29/2021 Quarterly sector update Q4 2020 | Fidelity d/b/a National Grid
D.P.U. 20-120
Attachment DPU-19-14-1
Page 2 of 17
It may be time to shine for cyclical sectors—at least that is one of the top line findings from the Q4
sector update. The performance of cyclical sectors follows the expansion and contraction of the
business cycle and with the economy seemingly firmly in the early cycle phase, it could persist for a
bit.
Among the other insights from Fidelity's sector strategist, Denise Chisholm:
Tax increases may not be a drag on the market, and could encourage companies to invest.
Rising earnings forecasts suggest further stock market gains ahead, despite likely election-induced volatility.
A key valuation measure and low profit margins look bullish for industrials. Home prices look likely to rise
and homebuilding stocks may be a value.
Find out how the 11 US stock market sectors fared in Fidelity's sector scorecard, followed by
additional analysis from Denise Chisholm.
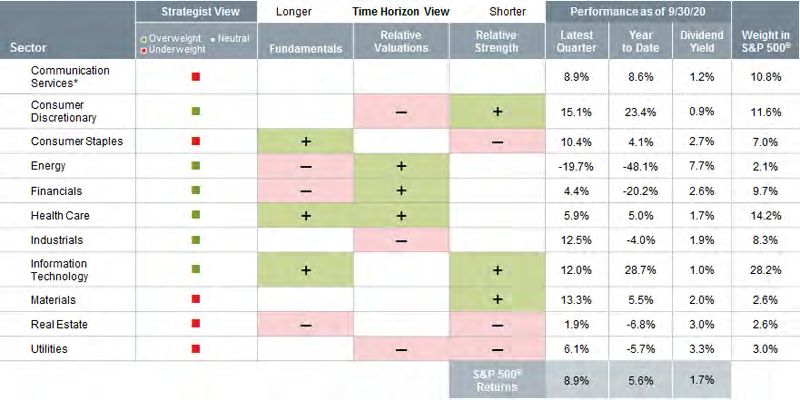
Scorecard: Investors stuck with cyclicals in Q3
The market continued to make up for lost ground in the third quarter, approaching pre-recession highs.
Consumer discretionary (+15.1%), materials (+13.3%), and industrials (+12.5%) were the best-
performing S&P 500 sectors for the quarter, while financials (+4.4%), real estate (+1.9%), and energy
(−19.7%) performed worst. In the context of market history, current trends highlighted later in this
report suggest that cyclical sectors may continue to generate strong returns in the months ahead.
/
Boston Gas Company
1/29/2021 Quarterly sector update Q4 2020 | Fidelity d/b/a National Grid
D.P.U. 20-120
Attachment DPU-19-14-1
Page 3 of 17
Past performance is no guarantee of future results. Strategist View, fundamentals, and relative valuations are based on the top 3,000
U.S. stocks by market capitalization. Sectors defined by the Global Industry Classification Standard (GICS®); see Appendix for details.
Performance metrics (including relative strength) are for S&P 500 sector indexes. * Changes were made to the GICS framework on Sep.
24, 2018; historical S&P 500 communication services sector data prior to Sep. 24, 2018, reflect the legacy telecommunication services
sector. Communication services data from the top 3,000 U.S. stocks by market capitalization has been restated back to 1962 to account
for the changes to the GICS. Strategist view is as of the date indicated based on the information available at that time, and may change
based on market or other conditions. This is not necessarily the opinion of Fidelity Investments or its affiliates. Fidelity does not assume
any duty to update any of the information. Overweight and underweight views represent opportunistic tilts in a hypothetical portfolio
relative to broad market sector weights. Sector weights may vary depending on an individual’s risk tolerance and goals. Time horizon
view factors are based on historical analysis and are not a qualitative assessment by any individual investment professional. Green
suggests outperformance; red suggests underperformance; unshaded indicates no clear pattern vs. the broader market. See Methodology
for more details. It is not possible to invest directly in an index. All indexes are unmanaged. Percentages may not total 100% due to
rounding. Source: Haver Analytics, FactSet, Fidelity Investments, as of 9/30/20.
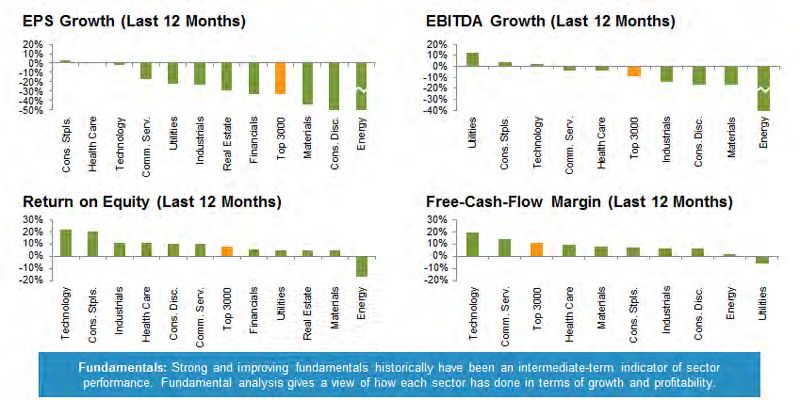
Fundamentals: tech, consumer staples, health care led
Stock market fundamentals have been broadly challenged by the pandemic-induced recession. In fact,
stocks have experienced their worst annual earnings growth since the global financial crisis. Among
the 11 sectors, technology led our fundamentals ranking over the past 12 months. Consumer staples
and health care also fared relatively well. Energy stocks continued to lag by most measures.
Past performance is no guarantee of future results. EPS = earnings per share. EBITDA = earnings before interest, taxes, depreciation,
and amortization. Energy EPS and EBITDA growth over the last 12 months were −271% and −48%, respectively. The financials and real
estate sectors are not represented in the EBITDA Growth or Free-Cash-Flow Margin charts because of differences in their business
models and accounting standards. See the Glossary and Methodology in the footnotes for further explanation. Sectors based on the top
3,000 US stocks by market capitalization and defined by GICS. Communication services data restated back to 1962. Source: Haver
Analytics, Fidelity Investments, as of 9/30/20.
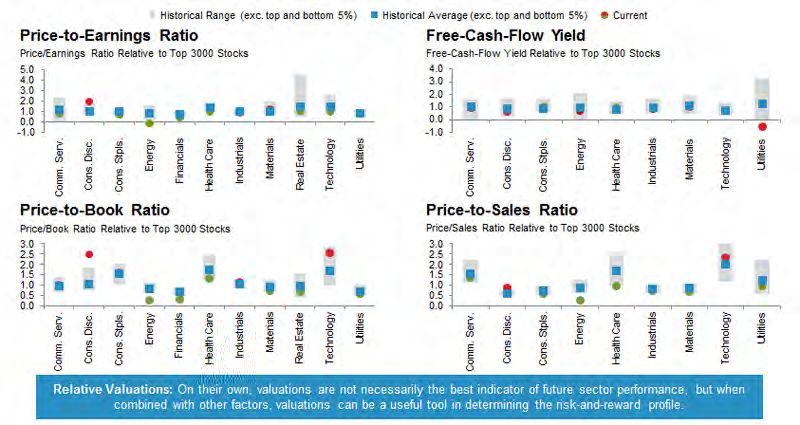
Relative valuations: Value in financials stocks
/
Boston Gas Company
1/29/2021 Quarterly sector update Q4 2020 | Fidelity d/b/a National Grid
D.P.U. 20-120
Attachment DPU-19-14-1
Page 4 of 17
Financials looked inexpensive at the end of the third quarter, with price-to-earnings and price-to-book
ratios near the low end of their historical range. Energy and health care stocks also traded at low
valuations compared with their histories. By contrast, the utilities, industrials, and consumer
discretionary sectors all looked relatively expensive.
Past performance is no guarantee of future results. Free-cash-flow yield reflects free cash flow divided by market price per share; it is
the inverse of the price-to-free-cash-flow ratio. The financials and real estate sectors are not represented in the Free-Cash-Flow Yield or
Price-to-Sales charts because of differences in their business models and accounting standards. Please see the Glossary and Methodology
in the footnotes for further explanation. Historical range since Jan. 1962. Sectors based on the top 3,000 US stocks by market
capitalization and defined by GICS. Communication services data restated back to 1962. Source: Haver Analytics, Fidelity Investments,
as of 9/30/20.
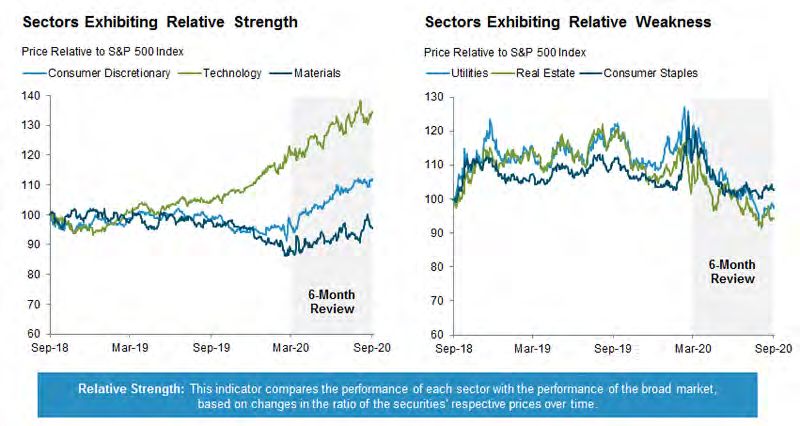
Relative strength: discretionary, tech, and materials on top
Strong third-quarter and 6-month performance helped push consumer discretionary, technology, and
materials stocks into the top 3 spots in our relative strength rankings. Utilities, real estate, and
consumer staples exhibited weakness relative to the other market sectors.
/
Boston Gas Company
1/29/2021                                                         Quarterly sector update Q4 2020 | Fidelity               d/b/a National Grid
                                                                                                                           D.P.U. 20-120
                                                                                                                           Attachment DPU-19-14-1
                                                                                                                           Page 5 of 17

            Past performance is no guarantee of future results. Charts represent performance of specified S&P 500 Sector Indexes relative to the
            broader S&P 500 index. It is not possible to invest directly in an index. All indexes are unmanaged. Source: FactSet, Fidelity
            Investments, as of 9/30/20.

            Tax increases may not drag on the markets
            Some investors have expressed concern that certain election outcomes could mean higher taxes that
            would hurt stock returns. Yet tax increases historically haven’t correlated with poor equity
            performance. In fact, the market gained during most previous years in which taxes rose, possibly in
            part because increased fiscal spending helped offset the tax impact. Although the sample size is
            relatively small, the data suggest that higher taxes may not imperil stocks.

                                                                                                                                                   /
Boston Gas Company
1/29/2021                                                           Quarterly sector update Q4 2020 | Fidelity                d/b/a National Grid
                                                                                                                              D.P.U. 20-120
                                                                                                                              Attachment DPU-19-14-1
                                                                                                                              Page 6 of 17

            Past performance is no guarantee of future results. S&P 500 returns were positive during 88% of the calendar years when personal
            taxes increased, in 100% of the years when corporate taxes increased, and in 80% of the years when capital gains taxes increased since
            1950. S&P 500 returns were positive in 72% of the years since 1950. Source: Standard and Poor’s, Haver Analytics, FactSet, Fidelity
            Investments, as of 12/31/19.

            Higher taxes may encourage corporate investment
            Higher taxes also may increase companies’ incentive to invest in their own businesses. Real
            investment spending—the money companies invest in new equipment, factories, and the like—is near
            previous recessionary lows. Corporate investment spending has tended to grow faster in years when
            taxes increase, possibly because companies are incentivized to reinvest higher-taxed profits into their
            business rather than pay taxes on them.

                                                                                                                                                     /
Boston Gas Company
1/29/2021 Quarterly sector update Q4 2020 | Fidelity d/b/a National Grid
D.P.U. 20-120
Attachment DPU-19-14-1
Page 7 of 17
Real investment spending was positive in 71% of years since 1962. Investment spending was positive in 71% of the years when personal
taxes increased, 80% of the years when corporate taxes increased, 80% of the years when capital gains taxes increased, and 77% of the
years when any of these taxes increased since 1962. Source: Haver Analytics, FactSet, Fidelity Investments, as of 12/31/19. Investment
spending data as of 7/15/20.
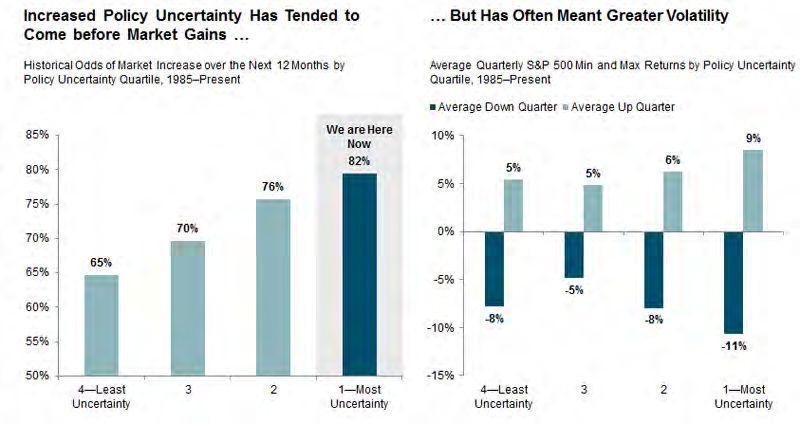
Policy uncertainty has historically meant volatility, gains
The election in November makes future economic policy unclear. Stanford and the University of
Chicago maintain an index of economic policy uncertainty; it’s now in the highest quartile of its
historical range. Since 1985, periods with more uncertainty had higher odds of a market advance over
the following year. They also had greater volatility—suggesting that investors may want to consider
staying the course but should be ready to ride out some bumps.
/
Boston Gas Company
1/29/2021 Quarterly sector update Q4 2020 | Fidelity d/b/a National Grid
D.P.U. 20-120
Attachment DPU-19-14-1
Page 8 of 17
Past performance is no guarantee of future results. Analysis based on S&P 500 returns. Source: Haver Analytics, FactSet, Fidelity
Investments, as 12/31/19. Economic Policy Index data from Stanford University and the University of Chicago.
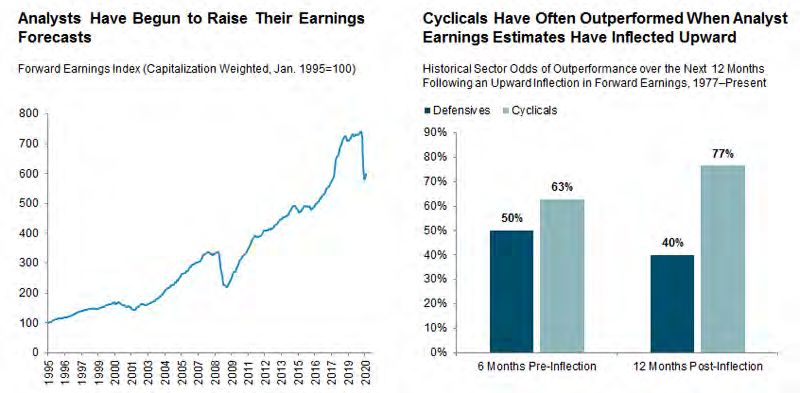
Rising earnings forecasts appear supportive of further rally
Stock analysts have begun increasing their earnings estimates after lowering them earlier this year.
Such upward inflections in earnings forecasts have historically happened in recessions, near the
beginning of bull markets. Cyclical sectors have had a slight edge over defensives leading up to past
inflections in forward earnings, as stock prices tend to anticipate future events, but that gap tended to
widen significantly in the 12 months that followed.
/
Boston Gas Company
1/29/2021 Quarterly sector update Q4 2020 | Fidelity d/b/a National Grid
D.P.U. 20-120
Attachment DPU-19-14-1
Page 9 of 17
Past performance is no guarantee of future results. Forward earnings: an average of analysts’ published earnings estimates for the
next 12 months. Upward inflection defined as any year-over-year decline followed by a sequential improvement in forward earnings.
Defensives represented by an average of three sectors: consumer staples, health care, utilities. Cyclicals represented by an average of
eight sectors: communication services, consumer discretionary, energy, financials, industrials, materials, real estate, and technology.
Forward earnings have inflected upward five times since 1977 (amid every recession), representing approximately 1% of the periods
since then. Analysis based on the top 3,000 stocks by market capitalization relative to the Russell 3000 Index. Source: Haver Analytics,
FactSet, Fidelity Investments, as of 7/15/20.
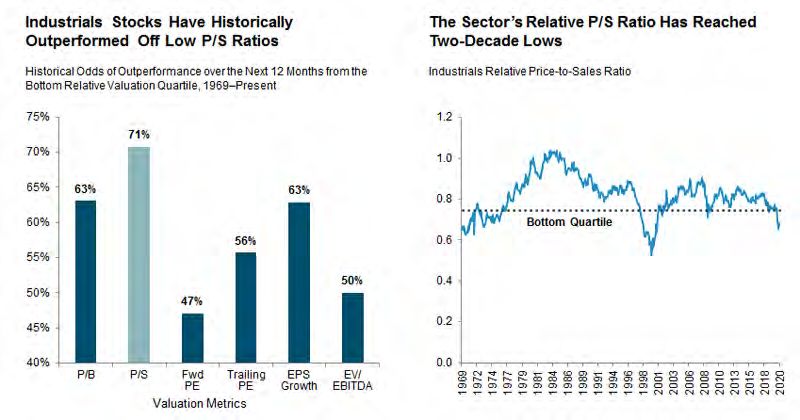
A key valuation metric for industrials is flashing green
Historically, the relative price-to-sales (P/S) ratio has been the most predictive valuation metric for
industrials. When industrials’ relative P/S ratios have been in the lowest quartile of their historical
range in the past, the sector outperformed the market 71% of the time over the next 12 months.
Industrials stocks currently sport their lowest P/S ratios in almost 20 years.
/
Boston Gas Company
1/29/2021 Quarterly sector update Q4 2020 | Fidelity d/b/a National Grid
D.P.U. 20-120
Attachment DPU-19-14-1
Page 10 of 17
Past performance is no guarantee of future results. Valuation metrics shown include price-to-book, price-to-sales, and forward and
trailing price-to-earnings ratios, as well as earnings-per-share growth and enterprise value-to-earnings before interest, taxes, depreciation,
and amortization ratio. See glossary for more details. Sector analysis based on the top 3,000 stocks by market capitalization relative to
the Russell 3000 Index. Source: Haver Analytics, FactSet, Fidelity Investments, as of 7/15/20.
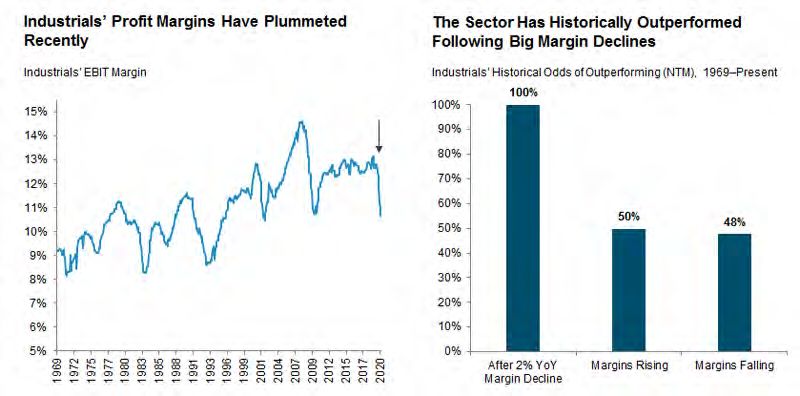
Are industrials’ low profit margins good news?
Industrials got inexpensive for a reason: Their profit margins have fallen swiftly and severely since
mid-2019. While declines of this magnitude are rare, historically they have presented buying
opportunities. Since 1950, industrials’ profit margins fell at least 2 percentage points year-over-year 8
times. Each time, the sector outperformed the market over the next 12 months. Falling profit margins
in the rearview mirror have been even more predictive of gains than profit margins on the rise.
/Boston Gas Company
1/29/2021 Quarterly sector update Q4 2020 | Fidelity d/b/a National Grid
D.P.U. 20-120
Attachment DPU-19-14-1
Page 11 of 17
Past performance is no guarantee of future results. EBIT: earnings before interest and taxes. NTM: next 12 months. YoY: year over
year Margin declines of 2% have happened only 8 times since 1969 (roughly 1% of the time), primarily in recessions. Margins rose
roughly 60% of the time and fell roughly 40% of the time since 1969. Industrial sector analysis based on the top 3,000 stocks by market
capitalization relative to the Russell 3000 Index. Source: Haver Analytics, FactSet, Fidelity Investments, as of 7/15/20.
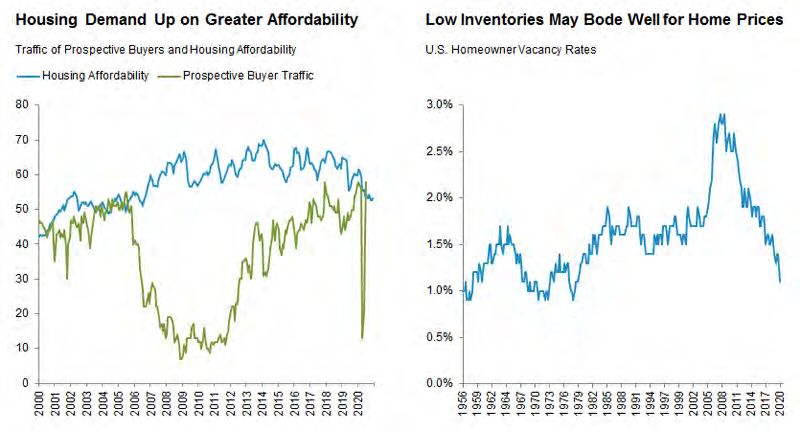
Home prices look likely to rise
The supply-and-demand picture may be constructive for the housing industry. Demand for housing has
recovered quickly after a sharp drop-off earlier in the year, as low interest rates have helped push
housing affordability near historic highs. At the same time, low homeowner vacancy rates indicate
tight supplies. The combination of strong demand and low supply is likely to push up home prices,
which could benefit homebuilding stocks.
/Boston Gas Company
1/29/2021 Quarterly sector update Q4 2020 | Fidelity d/b/a National Grid
D.P.U. 20-120
Attachment DPU-19-14-1
Page 12 of 17
Past performance is no guarantee of future results. Analysis based on the top 3,000 stocks by market capitalization relative to the
Russell 3000 Index. Source: Haver Analytics, FactSet, Fidelity Investments, as of 7/15/20.
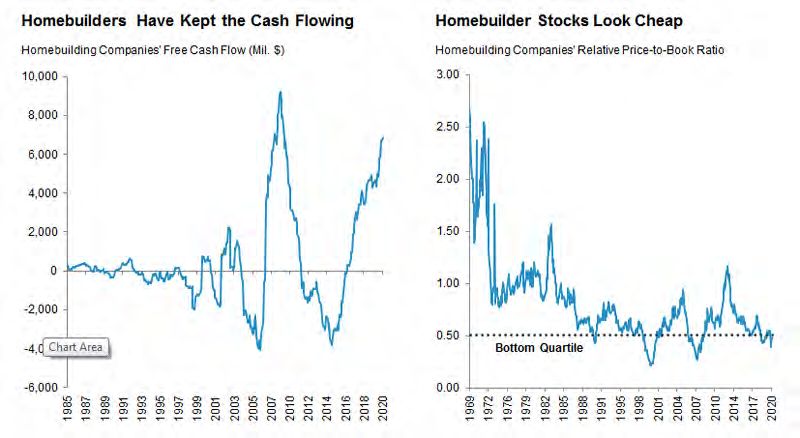
Homebuilding stocks may be undervalued
Homebuilders have maintained strong free cash flow this year despite the recession. Strong financials
have kept homebuilder valuations low even as their prices rallied, with their relative price-to-book
ratios in the bottom quartile of their historical range. Homebuilders beat the market 80% of the time
from these valuation levels in the past. Housing strength and homebuilder returns have historically
been key drivers of broader consumer discretionary performance.
/Boston Gas Company
1/29/2021 Quarterly sector update Q4 2020 | Fidelity d/b/a National Grid
D.P.U. 20-120
Attachment DPU-19-14-1
Page 13 of 17
Past performance is no guarantee of future results. Analysis based on the top 3,000 stocks by market capitalization relative to the
Russell 3000 Index. Source: Haver Analytics, FactSet, Fidelity Investments, as of 7/15/20.
Next steps to consider
Research investments
Get industry-leading investment analysis.
Research Fidelity sector funds
Get the details on the lineup of mutual funds.
/Boston Gas Company
1/29/2021 Quarterly sector update Q4 2020 | Fidelity d/b/a National Grid
D.P.U. 20-120
Attachment DPU-19-14-1
Page 14 of 17
Follow Denise Chisholm on LinkedIn
She uses history to share probability analysis on the US equity sectors.
Sign up for Fidelity Viewpoints®
Get a weekly email of our pros' current thinking about financial markets, investing strategies, and
personal finance.
First Name
Last Name
Email
Subscribe
/Boston Gas Company
1/29/2021 Quarterly sector update Q4 2020 | Fidelity d/b/a National Grid
D.P.U. 20-120
Attachment DPU-19-14-1
Page 15 of 17
Glossary
Cycle Hit Rate
Calculates the frequency of a sector outperforming the broader equity market over each business cycle phase since 1962.
Dividend Yield
Annual dividends per share divided by share price.
Earnings before Interest, Taxes, Depreciation, and Amortization (EBITDA)
A non-GAAP measure often used to compare profitability between companies and industries, because it eliminates the effects of financing
and accounting decisions.
Earnings per Share Growth
Measures the growth in reported earnings per share over the specified past time period.
Earnings Yield
Earnings per share divided by share price. It is the inverse of the price-to-earnings (P/E) ratio.
Enterprise Value
A measure of a company’s total value that includes its market capitalization as well as short- and long-term debt and cash on its balance
sheet.
Free Cash Flow (FCF)
The amount of cash a company has remaining after expenses, debt service, capital expenditures, and dividends. High free cash flow
typically suggests stronger company value.
Free-Cash-Flow Margin
The amount of free cash flow as a percentage of revenue. High FCF margin often denotes strong profitability.
Free-Cash-Flow Yield
Free cash flow per share divided by share price. A high FCF yield often represents a good investment opportunity, because investors
would be paying a reasonable price for healthy cash earnings.
Full-Phase Average Performance
Calculates the (geometric) average performance of a sector in a particular phase of the business cycle and subtracts the performance of
the broader equity market.
Median Monthly Difference
Calculates the difference in the monthly performance of a sector compared with the broader equity market, and then takes the midpoint of
those observations.
Price-to-Book (P/B) Ratio
The ratio of a company's share price to reported accumulated profits and capital.
Price-to-Earnings (P/E) Ratio
The ratio of a company's current share price to its reported earnings. A forward P/E ratio typically uses an average of analysts’ published
earnings estimates for the next 12 mos.
Price-to-Sales (P/S) The ratio of a company's current share price to reported sales.
Relative Strength
The comparison of a security's performance relative to a benchmark, typically a market index.
Return on Equity
The amount, expressed as a percentage, earned on a company's common stock investment for a given period.
Risk Decomposition
A mathematical analysis that estimates the relative contribution of various sources of volatility.
Methodology
Strategist View
Our sector strategist, Denise Chisholm, tracks key indicators that have influenced the historical likelihood of outperformance of each
sector. This historical probability analysis informs the Strategist Views.
Fundamentals
Sector rankings are based on equally weighting the following 4 fundamental factors: EBITDA growth, earnings growth, return on equity
(ROE), and free-cash-flow margin. However, we evaluate the Financials sector only on earnings growth and ROE because of differences
in its business model and accounting standards.
Relative Strength
Compares the strength of a sector versus the S&P 500 Index over a 6-month period, with a one-month reversal on the latest month;
identifying relative strength patterns can be a useful indicator for short-term sector performance.
Relative Valuations
Valuation metrics for each sector are relative to the S&P 500 Index. Ratios compute the current relative valuation divided by the 10-year
historical average relative valuation, eliminating the top 5% and bottom 5% values to reduce the effect of potential outliers. Sectors are
then ranked by their weighted average ratios, weighted as follows: P/E: 35%; P/B: 20%; P/S: 20%; free-cash-flow yield: 20%; dividend
yield: 5%. However, the Financials sector is weighted as follows: P/E: 59%; P/B: 33%; dividend yield: 8%.
/Boston Gas Company
1/29/2021 Quarterly sector update Q4 2020 | Fidelity d/b/a National Grid
D.P.U. 20-120
Attachment DPU-19-14-1
Page 16 of 17
Primary Contributors
Fidelity Management & Research Company, Equity Division
The Equity Division within Fidelity Asset Management consists of 11 portfolio groups, as well as Select and Advisor Focus sector
portfolios. Each group is responsible for portfolio management supported by in-depth fundamental research.
Unless otherwise disclosed to you, any investment or management recommendation in this document is not meant to be impartial
investment advice or advice in a fiduciary capacity, is intended to be educational, and is not tailored to the investment needs of any
specific individual. Fidelity and its representatives have a financial interest in any investment alternatives or transactions described in this
document. Fidelity receives compensation from Fidelity funds and products, certain third-party funds and products, and certain investment
services. The compensation that is received, either directly or indirectly, by Fidelity may vary based on such funds, products, and services,
which can create a conflict of interest for Fidelity and its representatives. Fiduciaries are solely responsible for exercising independent
judgment in evaluating any transaction(s) and are assumed to be capable of evaluating investment risks independently, both in general
and with regard to particular transactions and investment strategies.
Information presented herein is for discussion and illustrative purposes only and is not a recommendation or an offer or solicitation to buy
or sell any securities. Views expressed are as of the date indicated, based on the information available at that time, and may change
based on market and other conditions. Unless otherwise noted, the opinions provided are those of the authors and not necessarily those
of Fidelity Investments or its affiliates. Fidelity does not assume any duty to update any of the information.
References to specific investment themes are for illustrative purposes only and should not be construed as recommendations or
investment advice. Investment decisions should be based on an individual's own goals, time horizon, and tolerance for risk.
This piece may contain assumptions that are "forward-looking statements," which are based on certain assumptions of future events.
Actual events are difficult to predict and may differ from those assumed. There can be no assurance that forward-looking statements will
materialize or that actual returns or results will not be materially different from those described here.
Investing involves risk, including risk of loss.
All indices are unmanaged. You cannot invest directly in an index. Index or benchmark performance presented in this document does not
reflect the deduction of advisory fees, transaction charges, and other expenses, which would reduce performance.
Stock markets are volatile and can decline significantly in response to adverse issuer, political, regulatory, market, or economic
developments.
Because of its narrow focus, sector investing tends to be more volatile than investments that diversify across many sectors and
companies. Sector investing is also subject to the additional risks associated with its particular industry.
Business Cycle Definition
The typical Business Cycle depicts the general pattern of economic cycles throughout history, though each cycle is different. In general,
the typical business cycle demonstrates the following:
Early-cycle: The economy bottoms and picks up steam until it exits recession, then begins the recovery as activity accelerates.
Inflationary pressures are typically low, monetary policy is accommodative, and the yield curve is steep.
Mid-cycle: The economy exits recovery and enters into expansion, characterized by broader and more self-sustaining economic
momentum but a more moderate pace of growth. Inflationary pressures typically begin to rise, monetary policy becomes tighter, and the
yield curve experiences some flattening.
Late-cycle: Economic expansion matures, inflationary pressures continue to rise, and the yield curve may eventually become flat or
inverted. Eventually, the economy contracts and enters recession, with monetary policy shifting from tightening to easing.
Please note that there is no uniformity of time among phases, nor is the chronological progression always in this order. For example,
business cycles have varied between 1 and 10 years in the US, and there have been examples when the economy has skipped a phase
or retraced an earlier one.
Market Indexes
The Russell 3000® Index is a market capitalization-weighted index designed to measure the performance of the 3,000 largest companies
in the U.S. equity market.
The S&P 500® Index is a market capitalization–weighted index of 500 common stocks chosen for market size, liquidity, and industry group
representation to represent US equity performance. S&P 500 is a registered service mark of Standard & Poor's Financial Services LLC.
Sectors and industries are defined by the Global Industry Classification Standard (GICS) /Boston Gas Company
1/29/2021 Quarterly sector update Q4 2020 | Fidelity d/b/a National Grid
D.P.U. 20-120
Attachment DPU-19-14-1
Page 17 of 17
The S&P 500 sector indices include the standard GICS sectors that make up the S&P 500 Index. The market capitalization of all S&P 500
sector indexes together comprises the market capitalization of the parent S&P 500 Index; each member of the S&P 500 Index is assigned
to 1 (and only 1) sector.
Sectors are defined as follows: Consumer Discretionary: companies that provide goods and services that people want but don't
necessarily need, such as televisions, cars, and sporting goods; these businesses tend to be the most sensitive to economic cycles.
Consumer Staples: companies that provide goods and services that people use on a daily basis, like food, household products, and
personal-care products; these businesses tend to be less sensitive to economic cycles. Energy: companies whose businesses are
dominated by either of the following activities: the construction or provision of oil rigs, drilling equipment, or other energy-related services
and equipment, including seismic data collection; or the exploration, production, marketing, refining, and/or transportation of oil and gas
products, coal, and consumable fuels. Financials: companies involved in activities such as banking, consumer finance, investment banking
and brokerage, asset management, and insurance and investments. Health Care: companies in 2 main industry groups: health care
equipment suppliers and manufacturers, and providers of health care services; and companies involved in the research, development,
production, and marketing of pharmaceuticals and biotechnology products. Industrials: companies whose businesses manufacture and
distribute capital goods, provide commercial services and supplies, or provide transportation services. Materials: companies that are
engaged in a wide range of commodity-related manufacturing. Real Estate: companies in 2 main industry groups—real estate investment
trusts (REITs), and real estate management and development companies. Technology: companies in technology software and services
and technology hardware and equipment. Telecommunication Services: companies that provide communications services primarily
through fixed-line, cellular, wireless, high-bandwidth, and/or fiber-optic cable networks. Utilities: companies considered to be electric, gas,
or water utilities, or companies that operate as independent producers and/or distributors of power.
Third-party marks are the property of their respective owners; all other marks are the property of FMR LLC.
Fidelity Brokerage Services LLC, Member NYSE, SIPC, 900 Salem Street, Smithfield, RI 02917
949658.5.0
Stay Connected
Locate an Investor Center by ZIP Code
Search
Careers News Releases About Fidelity International
Copyright 1998-2021 FMR LLC. All Rights Reserved.
Terms of Use Privacy Security Site Map Accessibility Contact Us Share Your Screen Disclosures
This is for persons in the U.S. only.
/You can also read