Invesco India DAWN Portfolio - December 2018
←
→
Page content transcription
If your browser does not render page correctly, please read the page content below

Invesco India DAWN Portfolio
                                         DAWN: D - Demand recovery across cyclical & consumer discretionary sectors, A - Attractive
                                         valuation to provide margin of safety, W - Winning companies on the cusp of a new demand cycle
                                         leading to operating & financial leverage efficiencies, N - New credit & investment cycle to provide
                                         a boost to earnings recovery

                                         December 2018

This document is prepared by Invesco Asset Management (India) Private Ltd (‘IAMI’). for informational purposes only and is not an offering. Circulation,
disclosure, or dissemination of all or any part of this material to any unauthorized persons is prohibited.
Invesco India DAWN Portfolio
DAWN: D - Demand recovery across cyclical & consumer discretionary sectors, A - Attractive valuation to provide margin of safety, W - Winning
companies on the cusp of a new demand cycle leading to operating & financial leverage efficiencies, N - New credit & investment cycle to
provide a boost to earnings recovery

                             Demand recovery across cyclical & consumer discretionary sectors

                             Attractive valuation to provide margin of safety

                             Winning companies on the cusp of a new demand cycle leading to operating
                             & financial leverage efficiencies

                             New credit & investment cycle to provide a boost to earnings recovery

Invesco India DAWN Portfolio (DAWN: D - Demand recovery across cyclical & consumer discretionary sectors, A - Attractive valuation to provide margin of safety, W - Winning companies on the cusp of a new
demand cycle leading to operating & financial leverage efficiencies, N - New credit & investment cycle to provide a boost to earnings recovery) henceforth will be referred as “DAWN”.

2
Investment philosophy
Value strategy investing at the cusp of recovery
Catalyst for investing Benefit to investors
Cyclical recovery Focused strategy on earnings
Financials recovery
Industrials Mean Reversion – key driver
Consumer Discretionary of returns
Levers for recovery Exposure to under owned
Operating Leverage companies
Financial Leverage Complement to existing
Under owned to Value style growth oriented strategies
Pharma Investment style
IT
Portfolio of 20 – 25 companies
Focus on mean reversion & value style
High impetus on quality business models & management
Bottom up stock picking approach without bias towards market cap or
sector
Value style investing is an investment strategy where stocks are selected that trade for less than their intrinsic values. Disclaimer: The sector referred above should not be construed as recommendations from
Invesco Asset Management (India) Private Ltd. The Portfolio may or may not have any present or future positions in these sectors or in any other portfolios offered by Invesco Asset Management (India) Private Ltd.
3
Invesco India DAWN Portfolio

    Portfolio Name     Invesco India DAWN Portfolio
                       (DAWN: D - Demand recovery across cyclical & consumer discretionary sectors, A - Attractive valuation to provide margin of safety, W -
                       Winning companies on the cusp of a new demand cycle leading to operating & financial leverage efficiencies, N - New credit & investment
                       cycle to provide a boost to earnings recovery)

    Portfolio          To generate capital appreciation by investing in companies available at reasonable valuations.
    Objective

    Portfolio          The focus of this portfolio would be on identifying sectors and stocks which are expected to benefit from revival in cyclical recovery. The
    Description        portfolio will also favour companies that will benefit from operating /financial leverage and are available at a discount to their fair/intrinsic
                       value.

    Indicative Asset   Under normal circumstances, the asset allocation of the portfolio shall be as follows:
    Allocation
    Pattern            Instrument                                                                       Indicative Allocations (% of portfolio value)

                       Equity & Equity Related Instruments                                              65% to 100%

                       Cash & Cash Equivalent                                                           0% to 35%

                       The portfolio will not have any capitalization bias. The asset allocation pattern indicated above may change from time to time, keeping in
                       view market conditions. It must be clearly understood that the percentages stated above are only indicative and not absolute and that they
                       can vary substantially depending upon the perception of market conditions of the Portfolio Manager, the intention being at all times to seek
                       to protect the interests of the Client. Such changes in the asset allocation pattern will be for defensive considerations.

    Benchmark          S&P BSE 500

4
Equity Market Outlook
Valuations – Premium to long-term average

Sensex PE Ratio (trailing twelve months)
    30

    25                                                                                 Average since Dec ‘2003 : 18.73x
                                                                                                                                                                                        23.78x

    20

    15

    10

      5

      0
          Dec-03

                    Dec-04

                                Dec-05

                                           Dec-06

                                                       Dec-07

                                                                   Dec-08

                                                                              Dec-09

                                                                                          Dec-10

                                                                                                     Dec-11

                                                                                                                 Dec-12

                                                                                                                             Dec-13

                                                                                                                                        Dec-14

                                                                                                                                                    Dec-15

                                                                                                                                                             Dec-16

                                                                                                                                                                      Dec-17

                                                                                                                                                                               Dec-18
Despite recent correction, Sensex trades at a 27% premium to its long-term trailing 12 months average P/E multiple.

Source: MOSL, Invesco Asset Management (India) Research, Bloomberg, Data as on December 31, 2018. Past performance may or may not be sustained in future.

5
Equity Market Outlook
Profitability - Below long term average
Corporate profit as a share of GDP is lowest in more than a decade
7.36%
7.04%
5.81% 5.78%
5.36% 5.20% 5.38%
4.60% 3.80% Average : 4.17%
3.76%
3.50%
3.33%
2.94% 2.82%
2.63%
2.06% 1.90%
1.76%
FY01
FY02
FY03
FY04
FY05
FY06
FY07
FY08
FY09
FY10
FY11
FY12
FY13
FY14
FY15
FY16
FY17
FY18
PAT (% of GDP) Average
Cyclically low corporate profits have significant room to recover
Source: CMIE, IIFL Research. Based on a standalone financials of more than 15,000 companies. PAT: Profit After Tax. Disclaimer: Past performance may or may not be sustained in future.
6
Where do we see opportunity

7

Cyclical Recovery: Financials
Credit growth recovering; credit cost expected to normalise
Credit growth – on path of recovery Credit cost at cyclical high, expected to come down
1.5%
1.6%
30%
1.4%
1.4%
1.2%
25%
1.1%
1.2%
Average: 0.79%
0.9%
20%
1.0%
0.8%
13.58%
0.7%
0.7%
0.7%
0.7%
0.8%
0.7%
15%
0.5%
0.5%
0.6%
10%
0.3%
0.4%
0.2%
5%
0.2%
0% 0.0%
Apr-10
Nov-13
Jan-11
Oct-11
Jun-12
Mar-13
Aug-14
Apr-15
Jan-16
Sep-16
Jun-17
Feb-18
Nov-18
FY06
FY07
FY08
FY09
FY10
FY11
FY12
FY13
FY14
FY15
FY16
FY17
FY18
FY19E
FY20E
Source: IAMI. Credit Cost = Provisions for NPA’s/Average total assets. The sector referred above should not be construed as recommendations from Invesco Asset Management (India) Private Ltd. The Portfolio may
or may not have any present or future positions in the above sector or in any other portfolios offered by Invesco Asset Management (India) Private Ltd.
8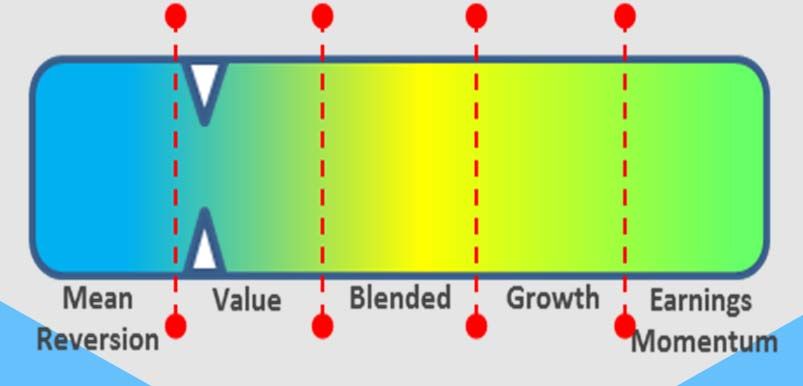
Cyclical Recovery: Financials
Asset Quality – Improvement ahead
Impaired asset as % of total advances Gross slippages outside stress pool as % of previous
year advances
5.07% 3.88%
4.92%
5.06%
2.71% 3.06%
3.21%
% of total advances
3.10%
2.46%
2.22%
5.74% 1.99% 2.00%
5.21%
4.99% 4.80%
4.50%
4.11%
1Q FY18 2Q FY18 3Q FY18 4Q FY18 1Q FY19 2Q FY19 1Q FY18 2Q FY18 3Q FY18 4Q FY18 1Q FY19 2Q FY19
Net NPA as % of advance Unrecognised stressed assets as % of advances
Impaired assets for corporate lenders have consistently come down over last few quarters
Incremental gross slippages outside known stress pool has come down indicating recovery ahead
Source: Invesco Internal Research, companies covered : SBI, Bank of Baroda, Indian Bank, ICICI Bank and Axis Bank. NPA: Non Performing Assets. The list is not exhaustive. It represents the companies which are
the largest corporate lenders within Indian banking system. Impaired asset: Includes unrecognized stress assets and net non performing assets. Gross slippages: Include accounts that have become NPA during the
quarter. The sector referred above should not be construed as recommendations from Invesco Asset Management (India) Private Ltd. The Portfolio may or may not have any present or future positions in the above
sector or in any other portfolios offered by Invesco Asset Management (India) Private Ltd.
9
Cyclical Recovery: Financials
Catalyst: Significant De-leveraging underway across corporate India

Deleveraging (Rs. bn)

  350

                      303
  300
                                                 275

  250

                                                                            193                        189
  200

  150

  100

                                                                                                                                   52
     50                                                                                                                                                       28
                                                                                                                                                                                           5
      0
                   Power                     Cement                       Roads                       Ports                      Land                     Airports                     Metro

                                    Stressed assets belonging to Steel sector being addressed
                                          through resolutions under the bankruptcy code
Source: IDFC, De-leveraging data as on December 31, 2017. The sector referred above should not be construed as recommendations from Invesco Asset Management (India) Private Ltd. The Portfolio may or may
not have any present or future positions in the above sector or in any other portfolios offered by Invesco Asset Management (India) Private Ltd.

10
Cyclical Recovery: Financials
Catalyst: Stressed assets coming down across various stress buckets, early
recognition of net performing assets
%100%
change in the asset quality of large borrowers between March 2017 and March 2018: Based on Exposure
58.6%
50%
0%
-3.2% -4.3%
-14.4%
-30.7%
-50%
-52.8%
-100%
SMA-0 SMA-1 SMA-2 Restructured NPAs Total Stressed
Standard Advance Advances
Source: Reserve Bank of India, Financial Stability Report Issue No. 18. December 2018. SMA-0: Principal or interest payment not overdue for more than 30 days but account showing signs of incipient stress, SMA-1:
Principal or interest payment overdue between 31-60 days, SMA-2: Principal or interest payment overdue between 61-90 days, NPAs: Gross Non-Performing Advances. The sector referred above should not be
construed as recommendations from Invesco Asset Management (India) Private Ltd. The Portfolio may or may not have any present or future positions in the above sector or in any other portfolios offered by Invesco
Asset Management (India) Private Ltd.
11Cyclical Recovery: Industrials
Current Trends: Capex led by Government spending
Road project award – NHAI delivers strong performance Project award cost ~2x during FY17-18
18,000 1400
16,000 1200
14,000
1000
12,000
800
Rs. bn
10,000
Km.
8,000 600
6,000 400
4,000
200
2,000
0 0
FY10 FY11 FY12 FY13 FY14 FY15 FY16 FY17 FY18 FY19 FY11 FY12 FY13 FY14 FY15 FY16 FY17 FY18
NHAI award MoRTH award BOT (Toll/Annuity) EPC Hybrid annuity
Order award (ex Roads) Share of Government capex has increased
80,000
Average orders – Rs. 1,347.25 bn
60,000
INR bn
40,000
Rs. bn
1603
1449
20,000
1399
1375
1366
1271
1177
1138
-
Dec-09
Dec-10
Mar-14
Mar-15
Nov-17
Dec-18
Jun-10
Jul-11
Jan-12
Jul-12
Feb-13
Aug-13
Sep-14
Oct-15
Apr-16
Oct-16
May-17
Jun-18
FY11 FY12 FY13 FY14 FY15 FY16 FY17 FY18
Order award (ex Roads) Average Government Private
NHAI Awarded projects worth Rs. 1220 bn in FY18 but current year data is weak. BoT model may no longer exist as funding norms gets stricter
Overall Order awards, ex-Roads, still remain subdued
Share of Government capex in gross projects has increased to almost 63% till December 2018
Source: Government Documents, SBICAP securities, Investec Research, Companies, MoRTH – Ministry of Road Transport and Highways, NHAI – National Highway Authority Of India, Powergrid, Media Reports,
Motilal Oswal Research. FY19: April 18-November 18.The sector referred above should not be construed as recommendations from Invesco Asset Management (India) Private Ltd. The Portfolio may or may not have
any present or future positions in the above sector or in any other portfolios offered by Invesco Asset Management (India) Private Ltd. BOT: Build–operate–transfer. EPC: Engineering, Procurement, and Construction
12Cyclical Recovery: Consumer Discretionary
Current Trends: Consumption rebounds; Sustainability key
Domestic two wheeler sales Staples volume growth
30% 6.00%
25.50% 25.70% 5.60%
5.50%
20% 15.70% 14.80%
Average: 7.90%
11.10% 9.58%
7.30% 6.90% 9.60% 4.00%
10%
%
1.60% 2.90% 3.00%
%
0%
-10% -7.50% 1.10%
Mar-07
Mar-08
Mar-09
Mar-10
Mar-11
Mar-12
Mar-13
Mar-14
Mar-15
Mar-16
Mar-17
Mar-18
Dec-18
Two wheeler sales Average Growth FY14 FY15 FY16 FY17 FY 18
Air Passenger Traffic – Number of Passengers Flown Tractor sales growth
32.20%
35%
30% 30% 22.10%
25% 25% 19.80% 20.20%
20% Average: 18.00% 14.00%
20% 15% 11.30%
9.13%
10%
15% 14.3% 5% 0.60%
%
0%
10% -5%
11.0% -1.70%
5% -10% -3.50%
-15% -10.50%
-20% -13.00%
0%
Mar-08
Mar-09
Mar-10
Mar-11
Mar-12
Mar-13
Mar-14
Mar-15
Mar-16
Mar-17
Mar-18
Dec-18
Dec-13
Nov-14
May-14
Apr-15
Mar-16
Dec-17
Jan-17
Jun-17
May-18
Oct-18
Feb-13
Jul-13
Sep-15
Aug-16
-5%
YoY(%) YoY(%), 3MMA Tractor Domestic Sales growth Average Growth
Overall consumption demand momentum has slowed down in recent months;
Growth outcomes are reasonably strong
Source: Bloomberg, Morgan Stanley, CEIC. 3 MMA: 3 months moving average. Past performance may or may not be sustained in future. The sector referred above should not be construed as recommendations
from Invesco Asset Management (India) Private Ltd. The Portfolio may or may not have any present or future positions in the above sector or in any other portfolios offered by Invesco Asset Management (India)
Private Ltd.
13Cyclical Recovery: Consumer Discretionary
Catalyst: Unorganised to Organised
Share of Unorganised Business with in each sector
90%
80% 80%
80%
70%
70%
60%
60%
50%
50% 45%
40% 35% 35%
30% 30%
30%
20%
10%
0%
Jewellery Apparel Plywood Tiles Pipes Footwear Fans Wires Paint Lighting
Source: Antique Stock Broking Limited. The Force Awakens: GST implementation to drive large scale benefits. The sector referred above should not be construed as recommendations from Invesco Asset
Management (India) Private Ltd. The Portfolio may or may not have any present or future positions in the above sector or in any other portfolios offered by Invesco Asset Management (India) Private Ltd.
14Operating & Financial Leverage
Levers for Recovery
Capacity Utilisation vs. EBITDA Margin trends & Gross Profit Financial Leverage
Margin 32%
60 80 3,05,000
30% 28.8%
51 51 2,55,000
49 28% 2,13,775
50 46 47
43 44 77 26.4% 1,90,777
43 26% 1,96,988 2,05,000
77
78 24% 22.5%
40 1,55,000
1,37,218 24.0% 24.0%
RS. Crs
75 73 74 22% 20.7%
72
%
74 72 72 98,543 1,05,000
30 20%
%
%
17.8%
71 18% 55,000
20 15.77 16% 20,471
13.89 12.98 13.87 14.55 15.72 5,000
13.39
14% 13.3%
68
10 15.94 -45,000
12% -37,819
-65,506
10% -95,000
0 65 FY FY FY FY FY FY FY FY
FY 11 FY 12 FY 13 FY 14 FY 15 FY 16 FY 17 FY 18 2011 2012 2013 2014 2015 2016 2017 2018
EBITDA Margins (LHS) Gross Profit Margin (LHS) CU (RHS) Free Cash Flow (RHS) Interest Exp/EBIT (LHS)
While current earning's cycle is weak, there are levers to earning's recovery
India's incorporation’s capacity utilization has improved from 72.3% in FY 17 to 73.1% in FY 18
Interest expense in FY18 constitutes 24% of EBIT as compared to 13.3% in 2011 highlighting significant financial leverage; this
should improve despite rise in interest rates as free cashflows are improving
Any cyclical recovery in demand should result in more than proportionate uptick in earnings due to a higher degree of operating
and financial leverage
Source: RBI, IIFL, Capitaline, Invesco Asset Management (India) Research. EBITDA: Earnings before interest, taxes, depreciation, and amortization. EBIT: Earnings before interest and
tax. Above graphs include company data, which are constituents of S&P BSE 200 Index (excluding financials and insurance). CU: Capacity utilization. Note: Free cash flow (FCF) is arrived
at after reducing capital expenditure from companies cash flow from operations.
15Value
Growth Index trading at Premium to long term average
MSCI India Growth Index at premium to the MSCI Value Index
140%
120%
100%
80%
Average: 55% 66%
60%
40%
20%
0%
May-06
Aug-06
Dec-06
Apr-07
Aug-07
Dec-07
Apr-08
Aug-08
Dec-08
Apr-09
Aug-09
Dec-09
Apr-10
Aug-10
Dec-10
Apr-11
Aug-11
Dec-11
Apr-12
Aug-12
Dec-12
Apr-13
Aug-13
Dec-13
Apr-14
Aug-14
Dec-14
Apr-15
Aug-15
Dec-15
Apr-16
Aug-16
Dec-16
Apr-17
Aug-17
Dec-17
Apr-18
Aug-18
Dec-18
Jan-06
MSCI growth index presently trades at 66% premium to the MSCI Value index, which is higher than long period average of
55%
Source: Invesco Asset Management (India) Research, Bloomberg, Data as on December 31, 2018. Past performance may or may not be sustained in future.
16Portfolio details 17
Model Portfolio Holdings
December 31, 2018

Portfolio Holdings                                                                                          Sector
Top 15 Holdings                                                            % of Net Assets                  Sector                                                                      % of Net Assets
ICICI Bank Ltd.                                                                              9.99           Financials                                                                                  30.69

Reliance Industries Ltd.                                                                     8.10           Industrials                                                                                 11.79
                                                                                                            HealthCare                                                                                  11.17
I T C Ltd.                                                                                   5.91
                                                                                                            Consumer Staples                                                                            10.14
Infosys Ltd.                                                                                 5.56
                                                                                                            Information Technology                                                                      10.06
Exide Industries Ltd.                                                                        5.23
                                                                                                            Energy                                                                                        8.10
Axis Bank Ltd.                                                                               5.05
                                                                                                            Consumer Discretionary                                                                        6.93
Tech Mahindra Ltd.                                                                           4.50
                                                                                                            Utilities                                                                                     3.66
Indusind Bank Ltd.                                                                           4.47           Materials                                                                                     2.84
L & T Finance Holdings Ltd.                                                                  4.41           Cash & Cash Equivalent                                                                        4.63
Apollo Hospitals Enterprises Ltd.                                                            4.28
United Spirits Ltd.                                                                          4.23
                                                                                                            Theme
                                                                                                            Theme                                                                       % of Net Assets
Cipla Ltd.                                                                                   4.17
                                                                                                            Operating & Financial Leverage                                                              39.59
Equitas Holdings Ltd.                                                                        3.81
                                                                                                            Cyclical Recovery                                                                           35.35
Gujarat State Petronet Ltd.                                                                  3.66
                                                                                                            Value                                                                                       20.44
Container Corporation Of India Ltd.                                                          3.36

The stocks & sectors referred above should not be construed as recommendations from Invesco Asset Management (India) Private Ltd. (“the Portfolio Manager”). The Portfolio Manager may or may not hold position
in these stocks in future. This should not be seen as an investment advice. Cyclical Recovery: Transition of a company from a period of recession to expansion as part of business cycle which is affected by ups and
downs in the overall economy. Operating Leverage: Companies currently operating at low capacity utilization and have large portion of costs fixed in nature. These companies can make more money from each
additional sale as demand recovers. Financial Leverage: Companies which can generate returns greater than the interest expense associated with the debt they use to fund growth. Further, could increase their profit
margin from decline in interest rates and reduction in debt due to profit growth. Value: Stocks trading at discount to their intrinsic value. Securities investments are subject to market risks, please read the
Disclosure Document carefully before investing.

18
Model Portfolio Characteristic December 31, 2018 Parameters Portfolio S&P BSE 500 Value1 12 Month Trailing Price to Earnings1 26.0 20.9 Price to Earnings1 FY 19 Estimate 21.5 20.4 Price to Earnings1 FY 20 Estimate 16.7 16.9 Growth Earnings Per Share Growth - FY19e2 21.2% 3.4% Earnings Per Share Growth – FY20e2 28.4% 20.8% 2 Year EPS Growth - Forecast (FY18-FY20) 22.3% 11.4% Return on Equity - FY18 11.6% 14.9% Weighted Market Cap (Rs. Crs) 1,52,312 2,20,707 1. Weighted Harmonic Mean 2. Weighted Arithmetic Mean, EPS Growth is derived from P/E ratios “Weighted Arithmetic Mean” is an average resulting from the multiplication of observation for each company by the weightage of that stock in the portfolio/index. “Weighted Harmonic Mean” is an average resulting from the multiplication of the reciprocal of the observation for each component by the weightage of that stock in the portfolio/index. It reduces the impact of outliers. Note: Excludes companies with net loss for appropriate results for various ratios Source: Factset, Bloomberg, IAMI 19
Cyclical Recovery
ICICI Bank Ltd.

                                                                                                                                           Stressed asset watch list has reduced significantly
 Credit growth below long term average                               Credit costs above long term average
                                                                                                                                           (in Rs. Crs)

20%                                                                  3%

                17%                                                                                                                                 44,065
18%
                               17%

16%
        14%            14%            14%                                                                                          2.1%
14%
                                             12%                     2%
12%
                                                                                                                           1.6%
                                                           10%
10%
                                                                                                                   1.2%                                                19,039
 8%
                                                    7%
                                                                     1%
 6%
                                                                           0.6%                            0.6%
 4%                                                                                                0.5%
                                                                                    0.4% 0.4%
                                                                                                                                                                                           4,728
 2%

 0%                                                                  0%
                                                                             FY11

                                                                                     FY12

                                                                                            FY13

                                                                                                    FY14

                                                                                                            FY15

                                                                                                                    FY16

                                                                                                                            FY17

                                                                                                                                    FY18
                                                                                                                                                   FY2016              FY2017             FY2018
         FY11

                FY12

                        FY13

                               FY14

                                      FY15

                                             FY16

                                                    FY17

                                                           FY18

Source: IAMI, Bloomberg.
Disclaimer: Past performance may or may not be sustained in future. The above analysis is based on internal research done by IAMI. The stock referred above should not be construed as recommendations from
Invesco Asset Management (India) Pvt. Ltd. (“the Portfolio Manager”). The Portfolio Manager may or may not hold position in this stock.

20
Cyclical Recovery
KNR Constructions Ltd.
Pick up in order book and revenue Growth Improvement in Margins and Return Ratios
7,000 3,000 25% 500
6,300
6,000 20%
2,500 20% 400
17%
5,000
15%
2,000 15% 300
4,000 3,769
3,464
1,893
11%
10%
3,000
1,500 10% 386 200
1,541
2,000
1,296 1,318 230
1,000 5% 100
1,000 153
126 126
876 903
835
0 500 0% 0
FY14 FY15 FY16 FY17 FY18 FY14 FY15 FY16 FY17 FY18
Order Book (LHS) Revenue (RHS) EBIDTA (RHS) ROCE (LHS)
Source: IAMI, Bloomberg. EBITDA: Earnings before interest, taxes, depreciation, and amortization. ROCE: Return on Capital Employed.
Disclaimer: Past performance may or may not be sustained in future. The above analysis is based on internal research done by IAMI. The stock referred above should not be construed as recommendations from
Invesco Asset Management (India) Pvt. Ltd. (“the Portfolio Manager”). The Portfolio Manager may or may not hold position in this stock.
21Operating Leverage
L & T Finance Holdings Ltd.
Lower operating expenses leading to operating leverage Improvement in Return on equity along with
improvement in provision ratio
1.4% 5.40% 5.5% 23% 100%
5.20% 5.20% 21.2%
5.10% 5.12% 21% 90%
1.30% 20.1%
5.00%
1.2% 4.90% 5.0%
1.20% 4.80% 1.20% 19% 80%
17.3% 17.1% 17.1%
1.10% 1.10% 1.10% 17% 70%
16.2%
15.8%
1.0% 4.40% 4.5% 15.5% 62.0%
1.00% 1.00% 58.0%
15% 14.5% 60%
14.0%
4.10% 52.0%
0.90% 0.90%
13% 47.7% 50%
0.8% 4.0%
41.3% 42.4% 41.7%
11% 40%
34.1% 34.1%
31.6%
0.6% 3.5% 9% 30%
1Q 2Q 3Q 4Q 1Q 2Q 3Q 4Q 1Q 2Q 1Q 2Q 3Q 4Q 1Q 2Q 3Q 4Q 1Q 2Q
FY17 FY18 FY19 FY17 FY18 FY19
Operating expenses (LHS) Pre-provision profit (RHS) Return on Equity (LHS) Coverage Ratio (RHS)
Source: IAMI, Bloomberg.
Disclaimer: Past performance may or may not be sustained in future. The above analysis is based on internal research done by IAMI. The stock referred above should not be construed as recommendations from
Invesco Asset Management (India) Pvt. Ltd. (“the Portfolio Manager”). The Portfolio Manager may or may not hold position in this stock.
22Operating Leverage
Apollo Hospitals Enterprise Ltd.
Operating Leverage: Improvement in occupancy to drive Growth in EBIT, fall in interest leading to financial
improvement in EBIT margin leverage
75% 24% 3,300 30%
72%
71% 71%
3,068
23% 3,100 25%
70% 68%
23.0% 67% 20.47% 20.83%
66% 19.91%
22.4% 22.5% 22% 2,900 2,816
64% 64% 20%
65% 22.0% 63% 63%
21% 2,700 2,612
2,574 12.88% 15%
60% 20%
20.3% 2,500
10%
19% 2,300 2,254
55%
5%
18.5% 18% 2,100
50% 18.2% 18.1%
17.9%
17.5% 17% 0%
1,900
45% -6.82%
16% -5%
1,700
40% 15%
1,500 -10%
FY12
FY13
FY14
FY15
FY16
FY17
FY18
FY19E
FY20E
FY21E
FY17 FY18 FY19E FY20E FY21E
Growth in EBIT -YOY (LHS) Conslidate Interest (RHS)
Occupancy (%) EBIT - Standalone
Source: IAMI, Bloomberg. EBIT: Earnings before interest and tax
Disclaimer: Past performance may or may not be sustained in future. The above analysis is based on internal research done by IAMI. The stock referred above should not be construed as recommendations from
Invesco Asset Management (India) Pvt. Ltd. (“the Portfolio Manager”). The Portfolio Manager may or may not hold position in this stock.
23Why Us 24
Process Driven Stock Selection Approach

                            Stock
                                                                                                                           Portfolio Construction
                        Categorization                                  Investment Strategy
                                                                                                                                   Levers
                         Framework#

      5 Benchmark
         Indices*
            +                                          Categorized                                        Portfolio                           Portfolio
     Select Bottom-                                      Stocks                                           Universe
        up ideas

     No. of Stocks:                                  No. of Stocks:                                   No. of Stocks:                       No. of Stocks:
          301                                             115                                               69                                 15–25

            Recovery                                                       Attractive
                                                                                                                                        Portfolio
            Potential                                                      Valuations

Data as on December 31, 2018
#For details on Stock Categorization Framework please refer next slide.
*5 Benchmark Indices: S&P BSE 200 Index, Nifty Midcap 100 Index, Nifty Infrastructure Index, Nifty Bank Index and S&P BSE PSU Index

25
Stock Categorization Framework
Stock Descriptions Growth Prospects Company Attribute Financial Parameter
Category (e.g.) (e.g.) (e.g.) (e.g.)
In line or better than Track record of leadership, Industry leading
Leader Established companies
industry globally competitive margin / ROE
Young / established Unique proposition and / Margin & ROE
Warrior Better than industry Growth
companies or right place, right time expansion
Entrepreneur vision,
Star Young companies High growth Operating Leverage
scalability
Company with Management intent to Value of
Diamond Low growth
valuable assets unlock value asset / business
Value
Company in a Intrinsic strengths in
Frog Prince Back to growth P2P, ROE expansion
turnaround situation core business
Corporate event,
Shotgun Opportunistic investment Positive surprise restructuring, earnings Event visibility Event
news
Call on the cycle Integration, cost efficiency,
Commodities Positive Profit leverage
is paramount globally competitive
P2P: Path to Profit; ROE: Return on Equity.
Based on internal stock classification and subject to change from time to time
26Portfolio Manager
Mr. Amit Nigam
Portfolio Manager – Portfolio Management Services
Amit has over 17 years’ experience in the Indian equity market. In his last assignment,
Amit was working with Essel Mutual Fund as Head of Equities where he was responsible
for the equity management function at the firm. In the past, he has also worked with
companies like BNP Paribas Investment Partners, BNP Paribas Mutual Fund, SBI Funds
Management & Reliance Industries Ltd. Amit holds a Mechanical Engineering Degree from
Indian Institute of Technology Roorkee and a PGDBM from Indian Institute of
Management,Indore.
27About Invesco Invesco Limited US$ 980.9 billion in assets under management around the globe. Specialized investment teams managing investments across a wide range of asset classes and investment styles. On-the-ground presence in more than 20 countries, serving clients in more than 120 countries with more than 7,000 employees worldwide. Publicly traded on NYSE; S&P 500 constituent. Invesco Asset Management (India) Private Ltd. Expertise across equity, fixed income and gold investments with assets under management & advisory mandates of INR 36,088.99 crores. More than 29 investment strategies across fixed income, equity and gold Proprietary stock selection process for Equity & Credit Appraisal process for Debt. Experienced Investment Management Team of 21 members with combined experience of over 260 years. Broad, deep and stable research platform. Defined and robust Risk Management Processes Data of Invesco Limited: Invesco Ltd. Client-related data, investment professional, employee data and AUM are as of September 30, 2018, and include all assets under advisement, distributed and overseen by Invesco. Data of Invesco Asset Management (India) Private Ltd.: AUM represents Average AUM for the quarter ending December 2018. Decimals have been rounded off. 28
Disclaimer

Disclaimer: This presentation does not solicit any action based on the material contained herein. Invesco Asset Management (India) Private Ltd. (“the Portfolio
Manager / the Company”) will not treat recipients as clients by virtue of their receiving this presentation. It does not constitute a personal recommendation or take into
account the particular investment objectives, financial situation / circumstances and the particular needs of any specific person who may receive this presentation. The
Co's/sectors referred in this presentation are only for the purpose of explaining the concept of Portfolio and should not be construed as recommendations from Portfolio
Manager. The Portfolio may or may not have any present or future positions in these stock. The Portfolio(s) discussed in the presentation may not be suitable for all
the investors. The recipient of this material alone shall be fully responsible / liable for any decision taken on the basis of this material. The appropriateness of a
particular investment or strategy will depend on an investor’s individual circumstances and objectives. The distribution of this presentation in certain jurisdictions may
be restricted or totally prohibited to registration requirements and accordingly, persons who come into possession of this presentation are required to inform
themselves about and to observe any such restrictions and/ or legal compliance requirements. Persons who may receive this presentation should consider and
independently evaluate whether it is suitable for his / her / their particular circumstances and are requested to seek professional / financial advice. Past performance is
not a guide for future performance. Future returns are not guaranteed and a loss of principal may occur. The Company and its affiliates accept no liabilities for any kind
of loss arising out of the use of this presentation. With respect to all information found in this presentation the Company has obtained data from sources it considers
reliable however, the Company and its directors, officers, agents, or employees and its affiliates make no warranty, express or implied, including the warranties of
merchantability and fitness for a particular purpose, or assume any legal liability or responsibility for the accuracy, completeness, or usefulness of any information
contained therein and the Company shall not be liable for any indirect, incidental or consequential damages sustained or incurred in connection with the use,
operation, or inability to use this presentation and information contained therein. Under no circumstances will the Portfolio Manager be liable for any loss or damage
caused by anyone’s reliance on information contained in this presentation.
Risk Factors: All securities investments are subject to market risks and there can be no assurance that the objectives of the portfolio(s) will be achieved. Each
portfolio will be exposed to various risks depending on the investment objective, investment strategy and the asset allocation. The performance of the portfolio may be
affected by changes in factors affecting the securities markets such as volume and volatility in the capital markets, interest rates, currency exchange rates, changes in
law/policies of the Government, taxation laws, political, economic or other developments, general decline in the Indian markets, which may have an adverse impact on
individual securities, a specific sector or all sectors. Further, the investments by the portfolio shall involve investment risks such as trading volumes, settlement risk,
liquidity risk, default risk including the possible loss of capital. The portfolio with investment objective to invest in a specific sector / industry would be exposed to risk
associated with such sector / industry and its performance will be dependent on performance of such sector / industry. The Portfolio Manager in accordance with the
features of respective Portfolio may use derivatives which require an understanding not only of the underlying instrument but of the derivative itself. Derivative products
are leveraged instruments and can provide disproportionate gains as well as disproportionate losses to the investor. Execution of such strategies depends upon the
ability of the Portfolio Manager to identify such opportunities. The decisions of Portfolio Manager may not always be profitable. The portfolio, returns and expenses
charged including Portfolio Management fees for each Client may differ from that of the other Client. Investors of the Portfolio Management Services are not being
offered any guaranteed / assured returns. The Portfolio Manager may invest in shares, debt, units of mutual funds, deposits or other financial instruments of associate/
group Co's. The name of the portfolio(s) does not in any manner indicate either the quality of the product or their future prospects and returns. Investors are advised to
read the risk factors given in the Portfolio Management Services Agreement and Disclosure Document before making investments.

29
Get in Touch

Corporate Office:
Invesco Asset Management (India) Private Limited
2101-A, A Wing, 21st Floor, Marathon Futurex,
N. M. Joshi Marg, Lower Parel, Mumbai – 400013
T: +91-22-6731000 F: +91-22-23019422

                                                   Follow us on
To invest:
Call 1800-209-0007 ∆ sms ‘Invest’ to 56677
Invest Online www.invescomutualfund.com
Thank you
You can also read