STRATEGIC RESTRUCTURING OF CAPITALAND LIMITED AND LISTING OF CAPITALAND INVESTMENT MANAGEMENT - 22 MARCH 2021
←
→
Page content transcription
If your browser does not render page correctly, please read the page content below
Strategic Restructuring of CapitaLand Limited and
Listing of CapitaLand Investment Management
22 March 2021
Disclaimer
This presentation may contain forward-looking statements. Actual future performance, outcomes and results may differ materially from those expressed in
forward-looking statements as a result of a number of risks, uncertainties and assumptions. Representative examples of these factors include (without limitation)
general industry and economic conditions, interest rate trends, cost of capital and capital availability, availability of real estate properties, competition from
other developments or companies, shifts in customer demands, shifts in expected levels of occupancy rate, property rental income, charge out collections,
changes in operating expenses (including employee wages, benefits and training, property operating expenses), governmental and public policy changes
and the continued availability of financing in the amounts and the terms necessary to support future business.

You are cautioned not to place undue reliance on these forward-looking statements, which are based on the current view of management regarding future
events. No representation or warranty express or implied is made as to, and no reliance should be placed on, the fairness, accuracy, completeness or
correctness of the information or opinions contained in this presentation. Neither CapitaLand Limited (“CapitaLand”) nor any of its affiliates, advisers or
representatives shall have any liability whatsoever (in negligence or otherwise) for any loss howsoever arising, whether directly or indirectly, from any use of,
reliance on or distribution of this presentation or its contents or otherwise arising in connection with this presentation.

The past performance of CapitaLand or any of the listed funds managed by CapitaLand Group (“CL Listed Funds”) is not indicative of future performance.
The listing of the shares in CapitaLand (“Shares”) or the units in the CL Listed Funds (“Units”) on the Singapore Exchange Securities Trading Limited (“SGX-ST”)
does not guarantee a liquid market for the Shares or Units.

This presentation is for information only and does not constitute an invitation or offer to acquire, purchase or subscribe for the Shares or Units.

The directors of the Company (including any who may have delegated detailed supervision of the preparation of this presentation) have taken all reasonable
care to ensure that the facts stated and all opinions expressed in this presentation in each case which relate to the Company (excluding information relating
to the Offeror or any opinion expressed by the Offeror) are fair and accurate and that, where appropriate, no material facts which relate to the Company
have been omitted from this presentation, and the directors of the Company jointly and severally accept responsibility accordingly. Where any information
which relates to the Company has been extracted or reproduced from published or otherwise publicly available sources or obtained from the Offeror, the sole
responsibility of the directors of the Company has been to ensure that, through reasonable enquiries, such information is accurately extracted from such
sources or, as the case may be, reflected or reproduced in this presentation. The directors of the Company do not accept any responsibility for any
information relating to the Offeror or any opinion expressed by the Offeror.

                                                                                                                                                                 2
Rationale and
Transaction
Summary
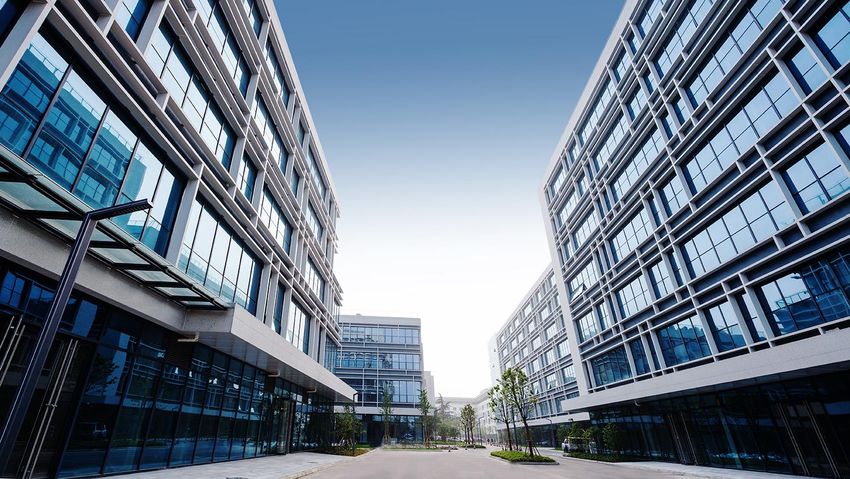
Singapore Science Park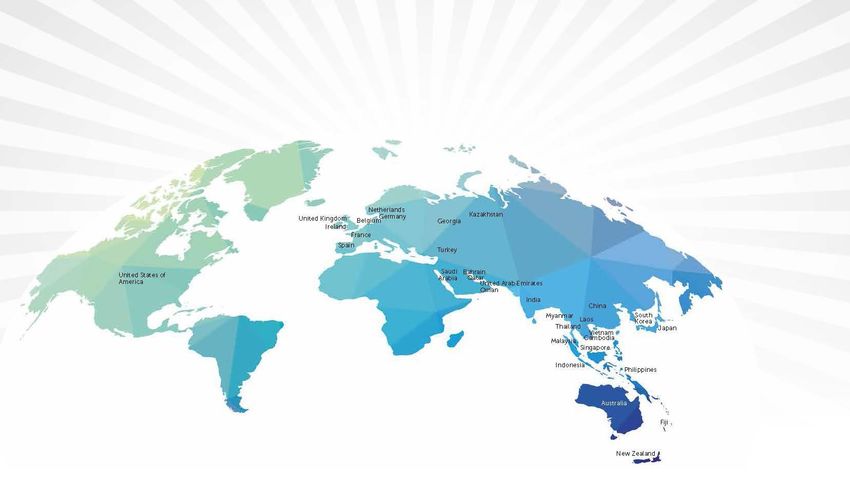
CapitaLand 3.0 Execution on Track
Significant progress made since January 2019 (1)

              Delivering ROE                            Pivot towards                            Consistently                              Top 10 global                      Strengthened
               above COE                              “new economy”                            exceed capital                                 REIMs(4)                        best-in-class
                                                        asset classes                          recycling target                                                                    REITs
             • Double digit ROE                        • Business Parks,                        • Annual premium                        • FY 2018 – FY 2020                  • Largest S-REITs/BTs
               of 10.0% in FY 2019                       Logistics, Industrial                    of ~11% achieved                        Fee Income                           platform on
                                                         and Data Centre                          over the last 3                         CAGR(5): 16%                         SGX-ST
                                                         sectors                                  years

                                                                                                                                           RE AUM(6):
                                                                                                                                            S$132.5B
                Average                                     16%                                    Capital                                      FY 2020                           31%(7)
               ROE: ~9.3%                                of FY 2020                               recycled:                                   FUM(6):
                                                                                                                                                                               of S-REITs/BTs
                                                                                                                                                                                  market
             FY 2017 – FY 2019(2)                         RE AUM                                   S$13B(3)                                   S$77.6B                          capitalisation
                                                                                                FY 2018 – FY 2020                               FY 2020

Notes:
(1)      CapitaLand Limited announced acquisition of Ascendas-Singbridge (ASB) on 14 Jan 2019
(2)      FY 2020 has been excluded from average given reported numbers are not representative of CapitaLand’s normalised ROE due to COVID-19
(3)      Includes assets divested/transferred by CapitaLand and CapitaLand REITs/Business Trusts/Funds. Based on agreed property value (100% basis) or sales consideration
(4)      IPE Top 150 Real Estate Investment Managers 2020. Ranking by RE AUM, as at 30 Jun 2020, based on SGD/EUR = 1.545
(5)      Fee Income refers to income from REITS and Fund Management. Includes fee-based revenue earned from consolidated REITs before elimination at Group level
(6)      See Glossary                                                                                                                                                                                4
(7)      Market cap of CapitaLand’s REITs/BTs stakes: ~S$34B as at 19 Mar 2021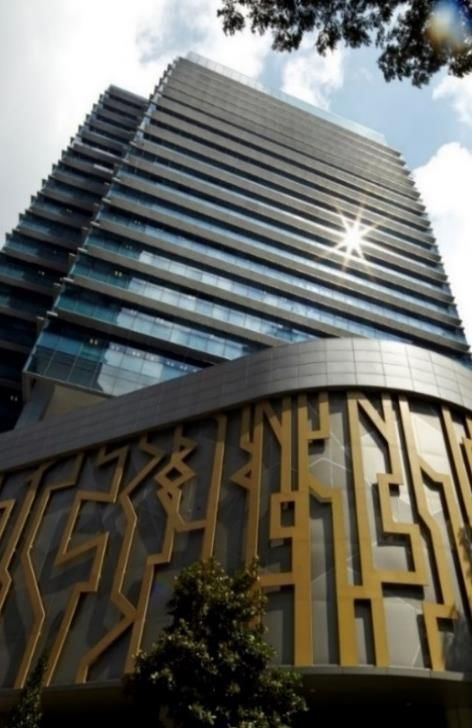
Restructuring to Sharpen Focus on Strategic Growth…

                                                    CapitaLand Investment Management
                                             Fund Management                        Lodging

                                        • Asset and capital efficient
                                        • Scalability through Fee Related Earnings (“FRE”) and Fund
                              Public      AUM (“FUM”) growth
                                        • Full stack investment and operating capabilities

                                                           CapitaLand Development
                                                                 Development

                                        • Asset and capital intensive
 3 strategic growth pillars   Private
                                        • Development of longer gestation projects and incubation
     Fund Management                      of new businesses requiring patient capital
          Lodging                       • Full stack development and project management
                                          capabilities
       Development

                                                                                                      5
…And Create Shareholder Value
                                        Historical P/NAV(1)                                                                                                       Forward P/E(1)
         4.0x                CapitaLand                                                                                   40.0x              CapitaLand
                             REIMs(2)                                                                                                        REIMs (4)
                                                                                  (3)                                                                                                                     (5)
                             SG+HK Developers (ex CapitaLand)                                                                                SG+HK+CN Developers (ex CapitaLand)

         3.0x                                                                                                             30.0x

                                                                                                         2.6x
                                                                                                                                                                                                                            19.4x
         2.0x                                                                                                             20.0x

                                                                                                                                                                                                                          15.8x

         1.0x                                                                                             0.8x            10.0x
                                                                                                                                                                                                                             9.3x
                                                                                                          0.6x

         0.0x                                                                                                               0.0x
                2016            2017            2018                2019                2020             2021                      2016             2017               2018               2019                  2020         2021

            Public markets value REIMs differently from developers; listed REIMs trade at a premium to
Source: FactSet as at 19 Mar 2021             traditional developers
Notes:
(1)             From 18 Mar 2016 to 19 Mar 2021
(2)             Based on market cap weighted average; includes   Charter Hall Group, Goodman Group, Lendlease Group, ESR Cayman Ltd.
(3)             Based on market cap weighted average; includes   City Developments Limited, Frasers Property Ltd., United Industrial Corp Ltd., Sun Hung Kai Properties Limited, Hang Lung Properties Limited, CK Asset
                Holdings Limited
(4)             Based on market cap weighted average; includes   Charter Hall Group, Goodman Group, Brookfield Asset Management Inc., Blackstone Group Inc., Lendlease Group, ESR Cayman Ltd; excludes data

(5)
                points where P/E > 50x
                Based on market cap weighted average; includes   City Developments Limited, Frasers Property Ltd., Sun Hung Kai Properties Limited, Hang Lung Properties Limited, CK Asset Holdings Limited, China Vanke
                                                                                                                                                                                                                              6
                Co. Ltd, China Resources Land Limited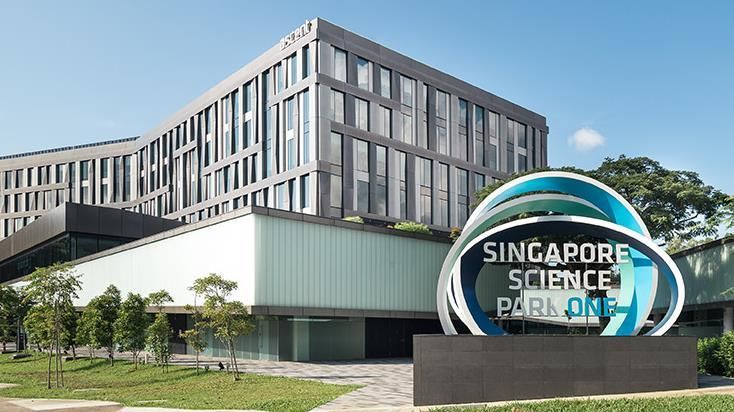
Distinct Entities to Optimise Growth

                               CapitaLand Development                                                CapitaLand Investment Management
                                       Development                                         Fund Management                           Lodging

   • Development of residential, commercial and integrated                           • REITs/BTs, PE Funds, Property and SR management platform
         development                                                                 • Stakes in 6 listed REITs/BTs and >20 PE Funds
   • Large scale and multi-phased development and                                    • Diversified IPs with visible, near-term monetisation potential
         redevelopment projects
   • Incubator for new businesses such as data centres

     Raffles City Chongqing,         Suzhou Center Mall and   Ascendas OneHub GKC,     Arlington Business Park,     ION, Singapore      The Ashton, U.S.
              China                       Office, China              China                       U.K.

                                   NAV: S$6.7B(1),(2)                                                             NAV: S$14.8B(1)
Notes:
(1)          Pro-forma NAV as at 31 Dec 2020                                                                                                               7
(2)          Adjusted for DIS of CICT Units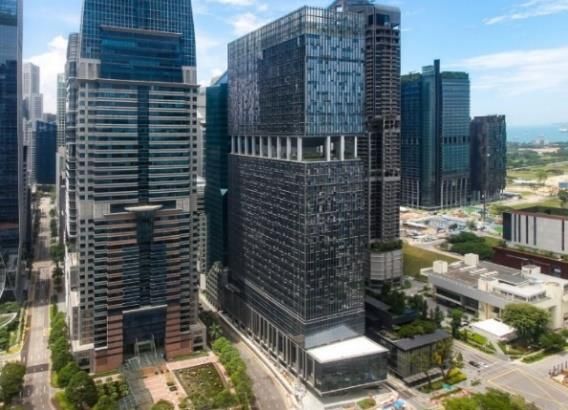
Proposed Transaction
Strategic restructuring to be carried out through Scheme of Arrangement

                                  Current Structure(1)                                      Post-transaction Structure(1)

           CLA Real Estate                                    Eligible           CLA Real Estate                       Eligible
           Holdings (“CLA”)                                 Shareholders         Holdings (“CLA”)                    Shareholders

           51.8%(2)                                                48.2%(2)
                                                                                            100.0%

                                                                                                      51.8%(2)
                                                                                                                   48.2%(2)
                                        (Listed on SGX)                            (Privately held)

                                                                                            100.0%
        100.0%                                     100.0%              100.0%

                                           Fund
         Development                                             Lodging          Development
                                        Management                                                               Investment Management
                                                                                                                      (Listed on SGX)

                                                  Investment Management (CLIM)

Note:
(1)      Illustrating relevant entities only                                                                                             8
(2)      Based on current shareholdings as at 19 Mar 2021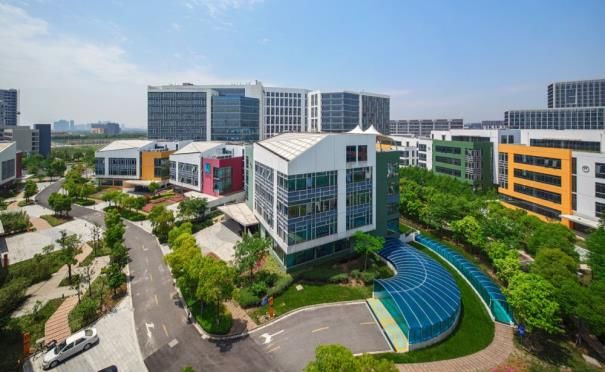
Implied Consideration of S$4.102 for Eligible Shareholders
                                                                                   S$0.158(2),(3),(4)/CICT Unit
                                               8%             CICT                 Eligible Shareholder’s pro-rata entitlement 0.075 CICT Units
                                                              Units                S$0.170(2),(3),(4)/CICT Unit
                                                                                   Offeror’s entitlement distributed in favour of the Eligible Shareholders of 0.080 CICT Units                                                                    Implied CLA
                                                                                                                                                                                                                                                   consideration:
                                                                                                                                                                                                                                                   S$1.121
                                                                                                                                                                                                                                                   representing
                                              23%                                                                                                                                                                                                  0.95x
                                                             Cash                  S$0.951(5) Cash Consideration
                                                                                                                                                                                                                                                   pro-forma
                                                                                                                                                                                                                                                   NAV(8)
 S$4.102(1)

                                                             CLIM                  S$2.823(6),(7) NAV/share
                                              69%                                  1 CLIM share

Note: Eligible Shareholders exclude CLA
(1)               Based on current share capital of 5,202,962,608 as at 19 Mar 2021. Assuming conversion of all outstanding convertible bonds, vesting of awards between Joint Announcement Date and Scheme Effective Date and estimated number of
                  ordinary shares to be issued as payment of director fees, fully diluted shares outstanding will be 5,409,995,696. In such case, Eligible Shareholders will receive the following for every 1 CapitaLand share: (a) 1 CLIM share at NAV per share of
                  S$2.715, (b) S$0.951 in cash, (c) 0.071 CICT Units (representing CLA’s share of DIS of CICT Units distributed to Eligible Shareholders) valued at S$0.151, based on CICT’s 1M VWAP of S$2.122/share as at 19 Mar 2021, (d) 0.072 CICT Units
                  distributed to Eligible Shareholders valued at S$0.152, based on CICT’s 1M VWAP of S$2.122/share as at 19 Mar 2021
(2)               The number of CICT Units which each CapitaLand Eligible Shareholder shall be entitled to pursuant to the Scheme shall be rounded down to the nearest whole number, and fractional entitlements shall be disregarded
(3)               388,242,247 CICT Units divided by 5,202,962,608 total CapitaLand shares as at 19 Mar 2021. CLA will not participate in the DIS of CICT Units and CLA’s share of DIS of CICT Units will be distributed to Eligible Shareholders as part of the
                  Scheme
(4)               Based on CICT’s 1M VWAP of S$2.122/share as at 19 Mar 2021
(5)               The aggregate Cash Consideration that is payable by CLA to any Eligible Shareholder as at the Record Date in respect of the shares held by such Eligible Shareholder will be rounded down to the nearest whole cent
(6)               Based on CLIM’s pro-forma NAV of S$14.7B as at 31 Dec 2020, adjusted for transaction costs. CLIM is valued at 1x NAV for illustrative purpose to determine Implied Consideration                                                                 9
(7)               Based on 5,202,962,608 CapitaLand shares outstanding as at 19 Mar 2021
(8)               Based on CapitaLand Development’s adjusted pro-forma NAV of S$6.1B, as at 31 Dec 2020, adjusted for transaction costs and FY 2020 dividends declared
Proposed Transaction Implies a Significant Premium to
CapitaLand’s Share Price
24% – 28% premium to Implied Consideration for Eligible Shareholders
(S$/share)                                                    CapitaLand’s FY 2020 dividends of S$0.09 per share is
                                                              not part of the Implied Consideration and will still be
                                    S$4.102(1)                              payable to shareholders(8)

         CICT Units                0.328(2).(3),(4)                                                   24%                                                       24%                                                         28%
                                                                                                      upside to Implied                                         upside to Implied                                           upside to Implied
          Cash                                                                                        Consideration                                             Consideration                                               Consideration
                                      0.951(5)
  Consideration

                                                                                                   S$3.310
                                                                                                                                                               S$3.317                                                     S$3.204
                  CLIM              2.823(6),(7)

                         Implied Consideration (7)                                               Last close                                               5-year VWAP                                                10-year VWAP

Source: Bloomberg, FactSet as at 19 Mar 2021
Note: Eligible Shareholders exclude CLA
(1)               Based on current share capital of 5,202,962,608 as at 19 Mar 2021. Assuming conversion of all outstanding convertible bonds, vesting of awards between Joint Announcement Date and Scheme Effective Date and estimated number of
                  ordinary shares to be issued as payment of director fees, fully diluted shares outstanding will be 5,409,995,696. In such case, Eligible Shareholders will receive the following for every 1 CapitaLand share: (a) 1 CLIM share at NAV per share of
                  S$2.715, (b) S$0.951 in cash, (c) 0.071 CICT Units (representing CLA’s share of DIS of CICT Units distributed to Eligible Shareholders) valued at S$0.151, based on CICT’s 1M VWAP of S$2.122/share as at 19 Mar 2021, (d) 0.072 CICT Units
                  distributed to Eligible Shareholders valued at S$0.152, based on CICT’s 1M VWAP of S$2.122/share as at 19 Mar 2021
(2)               The number of CICT Units which each CapitaLand Eligible Shareholder shall be entitled to pursuant to the Scheme shall be rounded down to the nearest whole number, and fractional entitlements shall be disregarded
(3)               388,242,247 CICT Units divided by 5,202,962,608 total CapitaLand shares as at 19 Mar 2021. CLA will not participate in the DIS of CICT Units and CLA’s share of DIS of CICT Units will be distributed to Eligible Shareholders as part of the
                  Scheme
(4)               Based on CICT’s 1M VWAP of S$2.122/share as at 19 Mar 2021
(5)               The aggregate Cash Consideration that is payable by CLA to any Eligible Shareholder as at the Record Date in respect of the shares held by such Eligible Shareholder will be rounded down to the nearest whole cent
(6)               Based on CLIM’s pro-forma NAV of S$14.7B as at 31 Dec 2020, adjusted for transaction costs. CLIM is valued at 1x NAV for illustrative purpose to determine Implied Consideration                                                               10
(7)               Based on 5,202,962,608 CapitaLand shares outstanding as at 19 Mar 2021
(8)               FY 2020 dividends is subject to approval at CapitaLand’s upcoming AGM
Strategic Restructuring Preserves CapitaLand Group’s
Valuable Ecosystem
✓ Multi-sector development capability
✓ Long-term asset pipeline
✓ Incubator for new businesses
✓ Capital and investment partner
• Strategic arrangements for asset recycling and
co-investment opportunities
Development • Shared services Investment
Management
✓ Asset management services
11Introducing
CapitaLand
Investment
Management
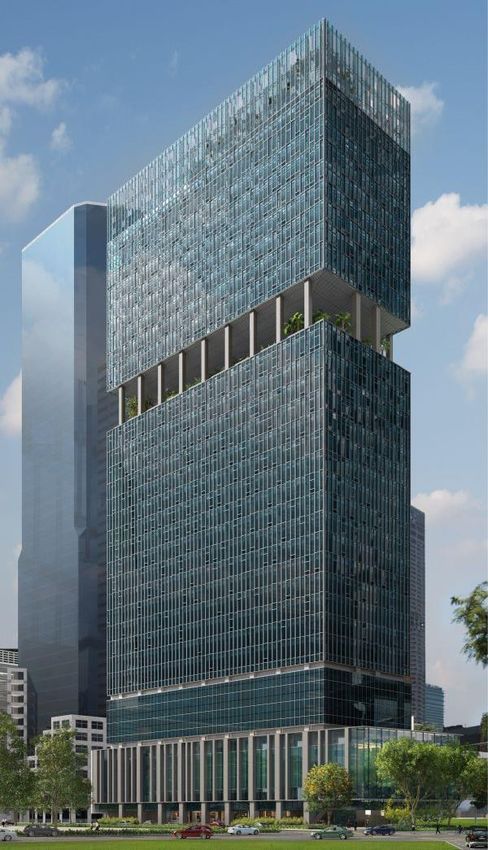
Capital Tower, SingaporeA Leading Global Real Estate Investment Manager
Optimally Structured for Sustainable Growth

                             Investments                                                                                                                             Investment Management (“IM”)

         1   Stakes in REITs/BTs and                                                                                                                             1    Funds Management
             private funds                                                                                                                                            • Leading Global REIM with ~11%
             • Stable, high quality recurring                                                                                                                           FUM CAGR (FY 2015 – FY 2020)
               income base                                                                                                                                            • Largest S-REIT/BTs platform on
             • REITs/BTs stake(1): S$7.8B                                                                                                                               SGX-ST
             • Private funds stake(2): S$5.5B                                                                                                                         • FUM: S$77.6B

                                                                                                        Investment
         2   Investment Properties (“IPs”)                                                                                                                       2    Lodging
                                                                                                       Management
             • Visible, high quality pipeline for                                                                                                                     • Global SR manager
               monetisation                                                                                                                                           • 122,607 units under management(4),
             • RE AUM (3): S$10.1B                                                                                                                                      with 2023 target of 160,000 units(5)
                                                                                                                                                                      • RE AUM: S$27.7B

                                                                                                       NAV: S$14.7B(6)
Notes:
(1)            Market data as at 19 Mar 2021
                                                                                                     RE AUM: S$114.5B(7)
(2)            Carrying value of stakes owned as at 31 Dec 2020
(3)            Includes investment properties and investment properties under development
(4)            As at FY 2020, of which ~52,884 are pipeline units
(5)            Based on press release “Ascott Targets To Double Its Global Portfolio To 160,000 Units In Five Years”, published on 29 January 2018 by The Ascott Limited
(6)            Pro-forma NAV as at 31 Dec 2020, adjusted for transaction costs                                                                                                                           14
(7)            Pro-forma RE AUM as at 31 Dec 2020
Full Stack of Investment and Operating Capabilities
Multi-sector operating capabilities
Commercial/Integrated New Economy(1) Lodging Alternative Assets(2) FY 2020 FUM
DM/
-
Listed Global S$52B
REITs/BTs Country
- -
focused
Funds management
• RCCIV
• RCCN JV
• RCCIP III
• CMCIF I, II, III
• ACBPF 4(3)
• CMCDF III • CTDF I, II
Unlisted Funds/ • AIGP
• CMIDF • ASRGF • VJVF S$26B
Programs/JVs • CVCVF
• AILF
• CREDO I China
• KDCF I
• CAP I
• Athena LP
• ACCF 3
• AKOPREIT 1, 3, 4, 5
FY 2020 FUM: S$51B S$18B S$8B S$1B S$78B
Core/Core+ ✓ ✓ ✓ -
Strategies
Credit - - - ✓
Value-add/Opportunistic ✓ ✓ ✓ ✓
Operating
Platforms
Best-in-class in-house operating platform in primary markets, complemented by third-party
operating partners in growth and secondary markets
Notes:
(1) Includes Industrial, Logistics, Business Parks and Data Centres
(2) Includes real estate debt and residential focused PE Funds
(3) ACBPF 4 will be wound up after all proceeds from the sale of Ascendas Innovation Tower, Xi’an, Ascendas Innovation Hub, Xi’an and Ascendas Xinsu Portfolio, Suzhou, as announced on 6 Nov 15
2020, have been distributed to investorsA Leading Global Real Estate Investment Manager
Asia-centric global leader in Real Proven fund management
1 Estate Investment Management 2 track record
Investment
Experienced Investment and Management
5 Asset Management team 3 Highly scalable pipeline
Distinctive lodging
4
management platform
161 Top 15 Global Real Estate Investment Managers
By RE AUM(1) (S$B)
Flag Global Headquarters
Listed companies
Asia’s largest REIM
3rd largest listed global REIM
358
229
197 197 183 175
144 141 140 130 125 115 114 110 108
Brookfield Blackstone Hines PGIM MetLife Nuveen AXA IM - Real UBS AM CBRE Global J.P. Morgan Allianz CLIM(2),(3) Principal Invesco AEW
AM Group Real Estate IM Assets Investors AM Real Estate Real Estate Real Estate
Investors
Source: IPE Top 150 Real Estate Investment Managers 2020
Notes:
(1) As at 30 Jun 2020, based on SGD/EUR = 1.545
(2) As at 31 Dec 2020. Represents total value of real estate managed by CapitaLand Group entities stated at 100% property carrying value. Includes RE AUM of lodging assets which are operational or
under development 17
(3) CLIM ranked 12th among REIMs based on RE AUM, as opposed to CapitaLand which was ranked 9th previously, given its transition towards an REIM from a RE manager1 Global Player with Strong Asian Presence
Coverage in over 230 cities across more than 30 countries
>80% of Assets Under
Management are in Asia
RE AUM(3) % Of FUM(3) % Of
Retail New Economy(1) Integrated Office Lodging(2) (S$B) Total (S$B) Total
Singapore 39 34% 33 42%
China 43 37% 27 35%
India 3 3% 3 4%
Other Asia 15 13% 3 4%
International 15 13% 12 15%
RE AUM(3) (S$B) 24 19 19 18 35 FUM(3)
RE AUM(3)
% of Total 20% 16% 18% 15% 31%
S$115B S$78B
FUM(4) (S$B) 20 18 19 12 8
% of Total 26% 24% 24% 15% 10%
Notes:
(1) Includes Industrial, Logistics, Business Parks and Data Centres
(2) Includes Multifamily
(3) As at 31 Dec 2020 18
(4) As at 31 Dec 2020. Excludes residential strata FUM, which comprises ~1% of total FUM2 Proven Track Record of Diversifying and Growing Our FUM…
Evolution of CLIM’s FUM (S$B)
FY 2015 FY 2020
Residential New Economy(2) Retail
3% 26%
Lodging 24%
11%
Retail
53%
Integrated
FUM: 2015-20 CAGR: ~11% Residential FUM:
Development 1%
19% S$46B 2017-20 CAGR: ~15% S$78B
Lodging(1)
10%
Office
Office 15%
14%
Integrated
Development
24%
Notes:
(1) Includes Multifamily 19
(2) Includes Industrial, Logistics, Business Parks and Data Centres2 …Together With Growth of Fee Income and Healthy Margins
Double-digit FUM growth track record and Growing fee income from REITs and
stable fee income/FUM rate Fund Management(1)
(S$B) (S$M)
~40bps(2) Fee income/FUM ~56%(2) EBITDA margin
350 1
300 0.5
250
0
200
-0.5
74 78 150 293 306
54 217 226 -1
51 100
50 -1.5
0 -2
2017 2018 2019 2020 2017 2018 2019 2020
Notes:
(1) Fee income refers to income from REITS and Fund Management only, excludes fees from SR management and property management which will be part of IM revenue mix going forward 20
(2) Average across FY 2017 – FY 20202 Disciplined Capital Recycling and Third-party Capital Raising
Gross divestments since 2018(1) Cumulative third-party equity raises since 2018
(S$M) CapitaLand REITs/BTs (S$M) REITs/BTs Private Funds
Average premium
above fair value of
5,932 26%
~11% achieved (2)
755
3,995 S$3B
764 3,041
recycling
target ~S$5B
5,177 1,431
3,231
1,610 74%
2018 2019(3) 2020 (4)
✓• Disciplined capital recycling consistently ✓• Successfully raised ~S$5B of third-party
above annual target of S$3B equity since 2018
✓• More than S$5B recycled into CapitaLand
REITs/BTs
Notes:
(1) Includes assets divested/transferred by CapitaLand and CapitaLand REITs/Business Trusts/Funds. Based on agreed property value (100% basis) or sales consideration
(2) Average across FY 2018 – FY 2020
(3) Respective values based on effective stakes for the joint divestment of CapitaMall Wuhu by CL (49%) and CRCT (51%)
(4) Respective values based on effective stakes for the joint divestment of Xinsu Portfolio, Ascendas Innovation Towers and Ascendas Innovation Hub by CL (23%) and Ascendas Business Parks Fund 4 (77%) 212
Highly Reputable Investment Manager With Established High
Quality Capital Partners
Long-term and permanent capital forms majority
Strong relationship with blue-chip capital partners of FUM
>5 years
• Diverse LP investor base across geographies
3%
• Top tier global institutions (Pension funds and SWFs)
• Repeat investors across fund vintages 1-5 years
26%
• Close to S$1.0B(1) of third-party capital available for
deployment
Breakdown of Private Funds Client Base(1) FUM:
Others(2)
Bank 4%
Middle East
4%
S$78B
5% Europe
Insurance 19%
8%
Corporation
8% Pension
Long-term/
Fund
39% Asia Permanent
North 53% 71%
SWF America
36% 24%
Notes:
(1) As at 31 Dec 2020 22
(2) Others include HNWIs, Trust Companies, Investment Managers, Hedge Funds, Cooperatives, Securities Companies, Endowments3
Attractive Pipeline With Strong Visibility and Entrenched
Ecosystem to Support Growth
• Visible, near-term monetisation potential
• Liquid markets and attractive portfolio yield characteristics
Asset and geographical breakdown
Integrated
Other DM Development
Lodging
31% 7%
22%
Retail
Singapore 29%
~S$10.1B(3) 34% ~S$10.1B(3)
New Heronfield, U.S. Galaxis, Singapore
Economy(1)
Other EM
China 23%
11% Office
24%
19%
~3 years
Target monetisation period:
Average premium achieved historically : ~11% (2)
Ascendas iHub Suzhou, China 79 Robinson Road, Singapore
Multiple recycling vehicles and strategies to release capital
Notes:
(1) Includes Industrials, Logistics and Business Parks
(2) Average across FY 2018 – FY 2020
23
(3) Based on RE AUM. Exclude strata.3 Multiple Engines to Drive FUM and FRE Growth
Evolution of CLIM’s FUM and future opportunities
(S$B) Fee Income/FUM (1):
~40bps
CapitaLand
Development
Strategic pipeline of
M&A ~S$7.6B(2)
Third-party
1.0 CLIM pipeline acquisitions
of ~S$10.1B(2)
~S$1.0bn of net investments(3)
77.6 77.6
announced 77.6
by CapitaLand’s 77.6 77.6 77.6
sponsored REITs and Funds over
45.9 the past 3 months
2015 2020 YTD net
investments(3)
Notes
(1) Refers to fee Income from REITS and Fund Management/FUM, averaged over FY 2017 – FY 2020
(2) Based on RE AUM. Exclude strata. 24
(3) Based on agreed property value (100% basis) or sales consideration4
Lodging Management as A Distinctive Engine of Fee Income
Growth
Dual mechanism driving
lodging growth
• Recurring fee income
• Recurring fee income
from AM(1) business • Strong brand value
Real Estate Platform
(REITs and Private Funds) and global operational
• Delivers returns through expertise
acquisition, active AM (1)
and recycling • Expansive ownership
Lodging Platform
network for investment
• Supports Lodging deal flow
Platform in establishing
brand presence • Capital efficient, high
Enhanced with technology capabilities to improve ROE; contribution
operational efficiency and increase profit contribution increases with scale
Notes: 25
(1) See Glossary4 Consistent Track Record of Scaling Up the Lodging Platform
Lodging units under management
ROE-accretive model with >80% units
Operational Under development ✓•
(’000 units) under management contracts and
Fees for Operational units under management franchise deals
as a % of RE AUM: ~70bps(2)
S$20-25m of fee income for every 10,000
✓•
30% increase stabilised units
over the
next 3 years
45 53
Anticipate material expansion of
43 160(1) ✓• contributions as units in pipeline turn
29
operational and stabilise – at least 52,900
57 69 70
43 units slated to progressively open over the
next three years
2017 2018 2019 2020 2023 target
Plan to maintain historical CAGR over the
• 4th consecutive year of record growth in management ✓•
and franchise contracts medium-term to scale up contribution of
• 14,200 units secured in FY 2020 amidst COVID-19 fees that flow through to the bottom-line
Notes:
(1) Based on press release “Ascott Targets To Double Its Global Portfolio To 160,000 Units In Five Years”, published on 29 January 2018 by The Ascott Limited
(2) Proxy based on FY 2019 numbers 264
Effectively Leveraging Our Core Lodging Expertise Into
Adjacent Sectors to Augment FUM growth
Deep and growing untapped market potential identified from adjacent markets
Purpose-Built Multi-
Serviced Student family/Private
residence Accommodation Rental Sector
Market potential: US$10.2B(1) in U.S. Market potential: US$2.9T(3) in U.S.
• Leading global and €10.5B(2) in EU and actively traded in Japan and EU
extended and long-
stay platform with full
value chain
capabilities from
operations to
investment and asset
management
Signature West Midtown, U.S. Proposed development of Quest Woolooware Bay in Ascott North Bund Shanghai,
341-unit suburban multi-family Sydney, Australia China
property in Austin, Texas, U.S.
Focused on synergistic expansion and diversification towards longer-stay accommodation
Notes:
(1) Knight Frank Global Student Property 2019
(2) JLL, January 2021. Includes direct real estate transactions and M&A/entity deals
27
(3) NAREIT Research (Jul-19) – Estimating the Size of Commercial Real Estate Market. By contrast, the estimated commercial property value for the Hospitality sector is US$1.6T4 Demonstrated Business Model Resiliency
Diversified, long-stay portfolio cushioned
Sequential improvement in RevPAU(1) in 2020 ✓• COVID-19 impact on occupancies
(S$)
• Optimism towards gradual resumption of
✓ domestic travel and vaccine roll-out
globally to drive recovery
120 121
84 • Capital recycling in FY 2020 realised ~55%
55 60
45 ✓ above fair value
2018 2019 Q1'20 Q2'20 Q3'20 Q4'20
✓• CLIM is well positioned to ride the recovery
Continued recovery in Lodging occupancy rate
Divested at
JPY5,900M in
Dec 2020 at Divested at
63% above its RMB780M in
book value Dec 2020 at
77% 78% via Ascott 52% above its
58% 49% 54% Residence book value
38% Trust (ART) via ART
Somerset Azabu Ascott
East Tokyo Guangzhou
2018 2019 Q1'20 Q2'20 Q3'20 Q4'20
Notes:
(1) See Glossary
285 Highly Experienced Team of Professionals
Global scale and in-market presence drives competitive advantage
in deal sourcing and market insights >400
IAM (2) Professionals Globally
>100
Assets Across More Than 30
Countries
Integrated Retail
Singapore 2%
International Development
15%
>40 years in
54% 19% Office
28%
By Asset Class
By Geography
S$6.7B FY 2018 – FY 2020
Singapore and over two China
29%
S$6.7B
Third-party Investments(1)
decades of operational New
Economy
expertise in key markets Other Asia India
1%
28%
Lodging
1%
such as China and India 23%
Notes
(1) Based on agreed property value (100% basis) or sales consideration 29
(2) See GlossaryConclusion
Ascendas Xinsu Square, Suzhou, ChinaConclusion
• The proposed restructuring marks the next phase of CapitaLand’s strategic transformation
• By restructuring our existing growth businesses into a separate private and public company, we will sharpen our
strategic focus, and match each business’ risk-return profile with the appropriate capital source and capital
structure, thereby enhancing shareholder value
• The proposed consideration implies a substantial premium of 24 – 28%(1) to our historical market price and offers the
potential for future long-term value creation
• CLIM targets to grow its FUM and FRE, and achieve a sustainable ROE over COE over the next 5 years by leveraging
its unique attributes that are highly valued by public markets:
➢ Capital efficiency
➢ Scalable investment platform with high growth trajectory in FUM and FRE
➢ Best-in-class operations
➢ Global leader in long-stay lodging
• Our private development business will continue to play an important role to CLIM as its development and capital
partner, as well as incubator and provider of future growth pipeline
• CapitaLand’s ecosystem, its values and its focus on sustainable growth have been central to its DNA, success and
resilience. We are confident and committed to ensuring that these will be retained
Note: 31
(1) Based on last closing price of S$3.310 as at 19 Mar 2021 and 10-year VWAP of S$3.204Shareholder Resolutions To Be Approved
• All inter-conditional
• CLA will abstain from voting at both the EGM and Scheme Meeting
Shareholder resolutions Approvals thresholds
EGM
Approve capital reduction to:
• Distribute CLIM shares to Eligible Shareholders
• Distribute 6.0% CICT Units to Eligible Shareholders ✓ At least 75% of shares voted
CLA will not participate in the distribution of CICT Units,
and its share will be distributed to Eligible Shareholders
SCHEME MEETING
Approve Scheme ✓ At least 75% of shares voted
• Transfer of CapitaLand shares to CLA ✓ >50% in headcount (present and voting at the EGM)
32Indicative Timetable
22 March In or around 3Q 2021
• Announcement of transaction • EGM and Scheme Meeting
In or around 3Q 2021 In or around 4Q 2021
• Despatch of Scheme document, • Completion – listing of CLIM and
opinion of Independent Financial delisting of CapitaLand
Adviser, CLIM introductory document,
EGM and Scheme Meeting notice
Note: The timeline above is indicative only and subject to change
33Appendix
Capital Tower, SingaporeTop 15 Investment Properties(1) (Based on Effective Stake) CapitaLand Property Portfolio as at 31 Dec 2020 Assets Under CLIM Country Stake Asset Under CapitaLand Development Country Stake ION Orchard SINGAPORE 50% Raffles City Chongqing CHINA 100% 79 Robinson Road (former CPF building) SINGAPORE 65% CapitaSpring SINGAPORE 45% Galaxis SINGAPORE 75% Suzhou Center Mall & Suzhou Center Office CHINA 50% CapitaMall Tiangongyuan CHINA 100% Jewel Changi Airport SINGAPORE 49% Yokohama Blue Avenue JAPAN 100% CapitaMall SKY+ CHINA 100% CapitaMall Westgate CHINA 100% Capital Square CHINA 70% Olinas Mall JAPAN 100% Rochester Commons SINGAPORE 100% Queensbay Mall MALAYSIA 100% Ascent SINGAPORE 100% The Cavendish London U.K. 100% 9 Tai Seng Drive SINGAPORE 100% Arlington Business Park U.K. 100% Ascott Heng Shan Shanghai CHINA 100% Singapore-Hangzhou Science & Technology Park (Phase 1 & 2) CHINA 80% Innov Center Phase II CHINA 100% Tianjin International Trade Centre CHINA 100% 5 Science Park Drive SINGAPORE 100% Parkfield U.S. 100% Ascendas OneHub GKC CHINA 76% The Ashton U.S. 100% China-Singapore Guangzhou Knowledge City CHINA 50% International Tech Park Pune, Hinjawadi INDIA 79% Sengkang Grand Mall SINGAPORE 50% Note: (1) Excludes properties held through CapitaLand’s listed and private funds 35
Glossary
Term           Definition
AM             Asset Management
FRE            Fee Related Earnings
COE            Cost of Equity
FUM            Funds Under Management, or otherwise known as Fund AUM; refers to the proportionate share of total assets under REITs/funds managed by CapitaLand Investment Management
IAM            Investment and Asset Management
IP             Investment Properties
PBSA           Purpose-Built Student Accommodation; refers to housing specifically built for students by private commercial developers
RE AUM         Represents total value of real estate managed by CapitaLand Group entities stated at 100% property carrying value. Includes RE AUM of lodging assets which are operational and under development
REIM           Real Estate Investment Manager
RevPAU         Revenue Per Available Unit
ROE            Return on Equity
SR             Service Residences
Unlisted Funds / Programs / JVs
ACBPF 4        Ascendas China Business Parks Fund 4
ACCF 3         Ascendas China Commercial Fund 3
AIGP           Ascendas India Growth Programme
AILF           Ascendas India Logistics Programme
AKOPREIT 1     Ascendas Korea Office Private REIT 1
AKOPREIT 3     Ascendas Korea Office Private REIT 3
AKOPREIT 4     Ascendas Korea Office Private REIT 4
AKOPREIT 5     Ascendas Korea Office Private REIT 5
ASRGF          Ascott Serviced Residence (Global) Fund
Athena LP      Athena LP
CAP I          CapitaLand Asia Partners I (CAP I) and Co-investments
CMCDF III      CapitaLand Mall China Development Fund III
CMCIF I        CapitaLand Mall China Income Fund
CMCIF II       CapitaLand Mall China Income Fund II
CMCIF III      CapitaLand Mall China Income Fund III
CMIDF          CapitaLand Mall India Development Fund
CTDF I         CapitaLand Township Development Fund I
CTDF II        CapitaLand Township Development Fund II
CVCVF          CapitaLand Vietnam Commercial Value-Added Fund
KDCF I         Korea Data Centre Fund I
RCCIP III      Raffles City China Investment Partners III
RCCIV          Raffles City China Income Ventures Limited
RCCN JV        Raffles City Changning JV
VJVF           Vietnam Joint Venture Fund

                                                                                                                                                                                                                  36
Thank You
For enquiries, please contact Ms Grace Chen, Head, Investor Relations
Direct: (65) 6713 2883 Email: grace.chen@capitaland.com
CapitaLand Limited (https://www.capitaland.com)
168 Robinson Road #30-01 Capital Tower Singapore 068912
Tel: (65) 6713 2888 Fax: (65) 6713 2999 Email: groupir@capitaland.comYou can also read