Georgia Clean Energy Industry 2014 Census - February 2015
←
→
Page content transcription
If your browser does not render page correctly, please read the page content below
Georgia Clean Energy Industry
        2014 Census

                         February 2015

                                    1
Author:                          Shan Arora

Contributor:                     John Sibley

Graphic Design:                  Greg Brough

Southface
Since 1978, Southface has worked with consumers, the construction and development industry, and
policymakers to forge market‐based approaches for creating jobs, clean energy solutions, and
sustainable communities. Southface is also committed to helping people live, work, and play in
comfortable, healthy buildings that save money by conserving energy, water, and other natural
resources. To accomplish these goals, Southface offers a wide variety of programs and services, all of
which are based on sound science, to promote sustainable buildings and communities.

Acknowledgements
Southface would like to thank all of the companies, institutions, and organizations that responded to the
2014 Southeast Clean Energy Industry Census. The willingness of respondents to provide their statistics
and insights allows Southface to share the success story of Georgia’s clean energy industry with decision
makers in the state and beyond.
Southface also deeply appreciates the efforts of partner organizations the North Carolina Sustainable
Energy Association, South Carolina Clean Energy Business Alliance, and Virginia Energy Efficiency Council
on the Southeast Clean Energy Industry Census. Additional thanks to Karen Eller, Donna Hughes, and
everyone at the Center for Urban Affairs and Community Services at the North Carolina State University
for their continued support of this project.
This report and survey infrastructure are made possible through the generous support of the Energy
Foundation.

© 2015 Southface. Any distribution of a modification, recreation, edit, or any other change in content, appearance, or other aspect of a part of
the entirety of this document without the express written consent of Southface is strictly forbidden.

                                                                                                                                                   2
Contents

Introduction .................................................................................................................................................. 1
   Key Findings .............................................................................................................................................. 1
   The Southeast Census .............................................................................................................................. 3
   Survey Process and Data Analysis ........................................................................................................... 3
   Conservative Approach ............................................................................................................................ 3
Firms ............................................................................................................................................................. 4
Employment ................................................................................................................................................. 6
Revenue ........................................................................................................................................................ 8
Location of Customers.................................................................................................................................. 9
Future Growth ............................................................................................................................................ 11
High Points and Policy Drivers ................................................................................................................... 12
Appendix A – Sector Definitions ................................................................................................................ 13
Appendix B – Methodology ....................................................................................................................... 15

                                                                                                                                                                   1
Introduction
Georgia spends billions a year to import energy. About $30 billion leaves Georgia annually to pay for
petroleum, natural gas, and coal.1 The clean energy industry offers Georgia the opportunity to keep a
larger portion of money spent on energy within the state. A majority of Georgia’s clean energy jobs
involve local activity that is difficult to outsource – such as building new, or retrofitting old, buildings to
make them energy efficient, and installing renewable energy systems. In fact, Census results show that
76% of all of clean energy goods and services stay within the state.
To understand the impact of the clean energy industry on Georgia’s economy, Southface partnered with
the North Carolina Sustainable Energy Association (NCSEA), the South Carolina Clean Energy Business
Alliance, and the Virginia Energy Efficiency Council (collectively referred to as the “Partners” in this
report) on the second Southeast Clean Energy Industry Census (Southeast Census). The 2014 Georgia
Clean Energy Industry Census (Georgia Census) is part of the broader four‐state Southeast Census. The
Georgia and Southeast Censuses share a common methodology and are collectively referred to as the
“Census” in this report.
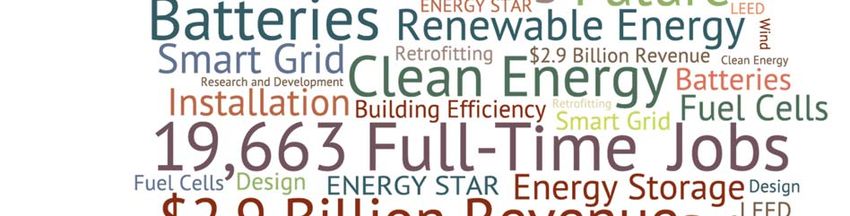
Key Findings
Georgia has at least 678 companies, institutions, Figure 1: Key 2014 Census findings
and organizations (collectively referred to as “firms”
in this report) in the clean energy sectors listed in
Table 1 that perform the associated activities listed
in Table 2. These firms provide 19,663 clean energy
678
full‐time jobs.2 To put that in perspective, Georgia Firms
has about the same number of active physicians.3
Furthermore, Georgia’s clean energy industry
generates at least $2.9 billion of gross revenue,
which equals about ten percent of our annual
energy imports.
19,663
Full‐Time Jobs
$2.9 Billion
Gross Revenue
1
U.S. Energy Information Administration. “State Energy Data System (SEDS): 2012.” Accessed online:
www.eia.gov/state/seds/seds‐data‐fuel‐prev.cfm?sid=GA. Referenced on Jan. 26, 2015.
2
One full‐time job is also referred to as a full‐time equivalent in this report.
3
Georgia had 22,713 active physicians in September 2014. Henry J. Kaiser Family Foundation. “Total Professionally
Active Physicians.” Accessed online: http://kff.org/other/state‐indicator/total‐active‐physicians. Referenced on
Feb. 4, 2015.
1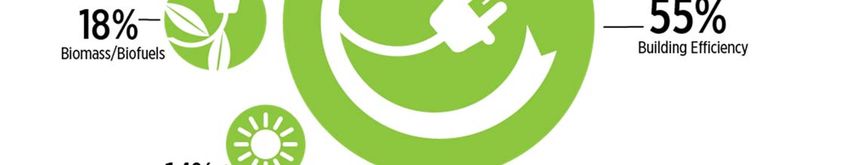
Table 1: Clean energy business sectors analyzed for the Census
Business Sector Examples of Types of Firms
Building Efficiency Builders, architects, HVAC installers, HERS raters, manufacturers
Solar Manufacturers, installers, designers, professional service providers
Geothermal Manufacturers, installers, designers, technical consultants
Biomass/Biofuels Wood pellet or biogas producers, technical consultants
Energy Storage Manufacturers, technical consultants
Wind Turbine component manufactures, professional service providers
Smart Grid Manufacturers, technical consultants
Alternate Fuel Vehicles Manufacturers, designers, auto servicers
Hydropower/Marine Facility operators, technical consultants
Fuel Cells Manufacturers, technical consultants
The top sectors for 2014 are:
Building Efficiency: 10,802 full‐time jobs and $1.3 billion
Biomass/Biofuels: 3,521 full‐time jobs and $297 million
Solar: 2,683 full‐time jobs and $610 million
Table 2: Clean energy business activities analyzed for the Census
Business Activity Examples of Types of Activities
Design or Construction of New Buildings Designing and building to energy/water efficient
standards (e.g., ENERGY STAR, LEED, or EarthCraft)
Sale of Building System Components Selling energy efficient systems, HVAC units,
insulation, lighting
Sale of Renewable Energy Systems Selling solar panels and component parts
Installation, Design, or Development of Designing and installing systems, providing
Renewable Energy Systems technical help
Installation or Maintenance of Building System Installing energy efficient systems, HVAC units,
Components insulation, lighting
Manufacturing Manufacturing LED lights, solar panels, batteries;
producing wood pellets and biogas
Power Generation Operating biomass power plant, solar farm,
hydropower plant
Professional Services, Education, or Consulting Providing consulting, education, support (e.g.,
legal, finance, tax, technical, and training)
Research and Development Engineering new solar panels, insulation, smart
grid technology, batteries, fuel cells
2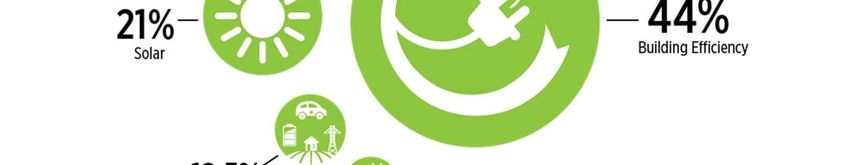
The top activities for 2014 are:
Activities related to Building Efficiency: 6,570 full‐time jobs and $869 million
Manufacturing: 5,875 full‐time jobs and $478 million
Installation, Design, or Development of Renewable Energy Systems: 2,619 full‐time jobs and
$463 million
The Southeast Census
Since 2008, NCSEA has surveyed the clean energy industry in North Carolina in order to quantify its
impact on the state’s economy. 2014 is the second year of an expanded geographic scope that includes
Georgia, North Carolina, South Carolina, and Virginia. For the Southeast Census, the Partners surveyed
firms to understand employment, revenue, and policy drivers of clean energy sectors within each state
and the Southeast region. This report presents the survey results and analysis that pertain to Georgia’s
clean energy industry. Please visit www.cleanenergyindustry.org for information on the Southeast
Census results.
The 2014 Southeast Census will also be incorporated into the U.S. Department of Energy‐funded
Southeast Clean Energy Manufacturing Roadmap (Southeast Roadmap), which will provide an
assessment of the region’s existing clean energy landscape and present a suite of considerations to grow
the Georgia and Southeast clean energy industry and market. The Southeast Roadmap will be issued
towards the end of 2015.
Survey Process and Data Analysis
Each Partner compiled a list of firms in its state. Each state‐level Census relied on a common
questionnaire developed by the Partners, as well as an online survey tool and phone‐banking system
managed by North Carolina State University Center for Urban Affairs and Community Services (NC
State).
Firms were asked to self‐identify as being involved in the clean energy industry by indicating they had at
least one employee dedicating a portion of his/her time to one of the nine activities in one of ten clean
energy sectors. Each activity within a sector is defined as a clean energy business unit (e.g., Research
and Development / Solar). Therefore, the Census has 90 business units. This level of granularity allows
for the analysis of the activities being conducted within each clean energy sector of Georgia’s economy.
However, we present data in this report by sector and activity totals, not by business unit. Readers
interested in additional analysis on Census data and related market intelligence should contact
Southface directly at sarora@southface.org.
Conservative Approach
For the first four‐state Census in 2013, the Partners used a direct‐count approach that resulted in lower‐
bound metrics for the clean energy economy. However, the direct‐count approach undercounted clean
energy firms, jobs, and revenues. For the 2014 analysis, the Partners utilized the approach taken by
NCSEA during the first five iterations of the North Carolina Clean Energy Industry Census from 2008 –
2012. This approach relies on a direct count of respondent data as well as conservative modeling of
3
firms that did not respond to the Census but have been identified as part of Georgia’s clean energy
industry.
This report presents direct findings from self‐reported data provided by 232 firms operating within
Georgia. This represents 34% of the estimated 678 firms currently conducting clean energy business in
Georgia. These 232 responding firms and 446 modeled firms represent a significant portion of the
state’s clean energy industry, but certainly do not cover all activity. We did not quantify impacts of any
activity of Georgia’s clean energy industry beyond the 678 firms that were identified. The conservative
nature of the analysis means that the economic benefits of Georgia’s clean energy industry are greater
than what is presented in the 2014 Census. Appendix B contains details of the 2014 Census
methodology.

Firms
Georgia has at least 678 clean energy firms. For the Census, firms reported on the multiple clean energy
sectors and activities in which they engage. For example, a firm could identify itself in both the Solar and
Energy Storage sectors, as well as list multiple activities within the sectors such as Power Generation
and Manufacturing. As a result, the total number of firms by sector or activity is greater than the 678
firms identified as being in Georgia’s clean energy industry.
Firms active in the Building Efficiency sector represent 44% of Georgia’s clean energy industry. Georgia’s
Solar firms represent 19% of the industry. Firms that are active in Georgia’s Geothermal sector
represent another 10% of all firms.

Figure 2: Firms by sector

                                                                                                             4
Table 3: Clean energy firms by sector
Sector # of Firms % of Georgia Firms
Building Efficiency 549 44%
Solar 240 19%
Geothermal 123 10%
Energy Storage 73 6%
Smart Grid 58 5%
Wind 58 5%
Biomass/Biofuels 50 4%
Alternate Fuel Vehicles 44 3%
Fuel Cells 23 2%
Hydropower/Marine 23 2%
Given that 44% of the respondents are in the Building Efficiency sector, it is not surprising that 42% are
engaged in activities related to the Building Efficiency sector, which are:
Design or Construction of New Buildings,
Installation or Maintenance of Building System Components; and
Sale of Building System Components.
Twenty percent provide Professional Service, Education, or Consulting. Fifteen percent are engaged in
Installation, Design, or Development of Renewable Energy Systems.
Table 4: Clean energy firms by activity
Activity # of Firms % of Georgia Firms
Professional Services, Education, or Consulting 292 20%
Design or Construction of New Buildings 281 19%
Installation, Design, or Development of Renewable Energy 231 15%
Systems
Installation or Maintenance of Building System Components 210 14%
Sale of Renewable Energy Systems 164 11%
Sale of Building System Components 137 9%
Research and Development 94 6%
Manufacturing 58 4%
Power Generation 35 2%
5
Employment
Georgia has at least 19,663 clean energy full‐time jobs. Firms in the Building Efficiency sector employ
10,802 full‐time professionals thereby accounting for 55% of Georgia’s clean energy industry
employment. Biomass/Biofuels firms rank low in the number of firms at 50, but are second in
employment with 3,521 FTE representing 18% of the clean energy industry employment.
2014 was a significant year for Georgia’s solar industry with the state’s Public Service Commission
approving more than 600 megawatts of new solar and making Georgia the fastest growing solar market
in the country according to the Pew Charitable Trusts.4 Given the robust growth of Georgia’s installed
solar capacity, it is not surprising that the state’s Solar firms rank third in employment with 2,683 full‐
time jobs representing 14% of the clean energy industry employment.5
Note that while approximately 10% of Georgia’s clean energy firms are active in the Geothermal sector,
the intensity of that activity is relatively minor because the Geothermal sector only has 206 full‐time
jobs representing one percent of all clean energy jobs in Georgia.

Figure 3: Employment by sector

4
 The Pew Charitable Trusts. “Georgia's Emerging Solar Industry Spurred by Policy.” Accessed online:
http://www.pewtrusts.org/en/about/news‐room/news/2014/11/18/georgias‐emerging‐solar‐industry‐spurred‐by‐
policy. Referenced on February 4, 2015.
5
 Our results are in line with those reached by The Solar Foundation’s 2014 Georgia solar jobs census. The minor
difference is due to methodology.

                                                                                                                  6
Table 5: Clean energy employment by sector

                    Sector                           Full‐Time Jobs               % of Georgia Full‐Time Jobs6
    Building Efficiency                                  10,802                                55%
    Biomass/Biofuels                                      3,521                                18%
    Solar                                                 2,683                                14%
    Energy Storage                                         983                                  5%
    Hydropower/Marine                                      556                                 2.8%
    Smart Grid                                             375                                 1.9%
    Wind                                                   319                                 1.6%
    Geothermal                                             206                                  1%
    Alternate Fuel Vehicles                                157                                 0.8%
    Fuel Cells                                             60                                  0.3%

The three activities related to the Building Efficiency sector collectively account for 6,570 full‐time jobs
representing 33% of the clean energy industry employment.7 The relatively few clean energy firms
engaged in Manufacturing activities provide 5,875 full‐time jobs, which is 30% of the workforce
identified through this Census. Clean energy manufacturers in Georgia make a wide variety of items
including lighting, refrigeration units, solar panels and accessories, batteries, biofuels, and insulation.
Firms engaged in Installation, Design, or Development of Renewable Energy Systems provide 2,619 full‐
time jobs representing 13% of total clean energy jobs.

Table 6: Clean energy employment by activity

                               Activity                                   Full‐Time Jobs        % of Georgia Full‐
                                                                                                   Time Jobs6
    Manufacturing                                                              5,875                   30%
    Design or Construction of New Buildings                                    2,631                  13.4%
    Installation, Design, or Development of Renewable Energy                   2,619                  13.3%
    Systems
    Sale of Building System Components                                         2,196                   11%
    Professional Services, Education, or Consulting                            2,062                  10.5%
    Installation or Maintenance of Building System Components                  1,742                    9%
    Power Generation                                                           1,740                    9%
    Sale of Renewable Energy Systems                                            446                    2.3%
    Research and Development                                                    350                    1.8%

6
  Percentage total greater or less than 100% is due to rounding.
7
  The three activities related to the Building Efficiency sector are Design or Construction of New Buildings;
Installation or Maintenance of Building System Components; and Sale of Building System Components.

                                                                                                                     7
Revenue
Georgia’s clean energy industry generates at least $2.9 billion of gross revenue. Because not all firms
provided their revenue data, clean energy revenue is likely larger than what is presented in the 2014
Georgia Census report. Revenue tracks employment with the Building Efficiency sector accounting for
$1.3 billion, followed by the Solar sector accounting for $610 million, and Biomass/Biofuels accounting
for $297 million. Firms in these three sectors generate 75% of Georgia’s clean energy revenues.
Figure 4: Revenue by sector
Table 7: Clean energy gross revenue by sector
Sector Gross Revenue % of Georgia Gross Revenue8
Building Efficiency $1,284,586,430 44%
Solar $610,010,489 21%
Biomass/Biofuels $296,815,965 10%
Wind $205,285,402 7%
Hydropower/Marine $162,623,042 5.5%
Smart Grid $120,857,726 4.1%
Energy Storage $107,290,756 3.7%
Geothermal $61,341,719 2.1%
Fuel Cells $58,626,462 2%
Alternate Fuel Vehicles $30,320,517 1%
8
Percentage total greater or less than 100% is due to rounding.
8The three activities related to the Building Efficiency sector collectively generate $869 million
representing 30% of the clean energy industry gross revenue.9 The relatively few clean energy firms
engaged in Manufacturing activities generate $478 million representing 16.3% of the industry’s gross
revenue. Firms engaged in Installation, Design, or Development of Renewable Energy Systems generate
$463 million representing 15.8% of the industry’s gross revenue.
Table 8: Clean energy gross revenue by activity
Activity Gross Revenue % of Georgia
Gross Revenue8
Design or Construction of New Buildings $545,028,244 19%
Manufacturing $477,747,126 16.3%
Installation, Design, or Development of Renewable Energy $463,048,124 15.8%
Systems
Power Generation $394,830,568 13%
Professional Services, Education, or Consulting $302,976,335 10%
Sale of Renewable Energy Systems $248,568,506 8.5%
Research and Development $181,991,637 6.2%
Sale of Building System Components $177,075,554 6%
Installation or Maintenance of Building System Components $146,492,414 5%
Location of Customers
Firms were asked to identify what percentage of their clean energy goods and services for each business
unit, i.e., activity/sector cross‐section, was delivered to customers in the following markets:
Within the county of the providing location.
Within the state but outside the county of the providing location.
Within the four‐state region but outside of the state of the providing location.
Within the country but outside of the four‐state region.
International.
Based on responses, Georgia’s clean energy industry is predominately local with 34% of clean energy
goods and services delivered to customers within the county in which the provider is located. Another
42% is delivered to customers within the state, but outside the county in which the provider is located.
Therefore, 76% of all of clean energy goods and services stay within the state.
The industry’s local nature is due in part to sectors such as Building Efficiency where business activities
are conducted close to the providing firm’s location. Indeed, 82% of Building Efficiency goods and
services are delivered to customers in Georgia. The Alternate Fuel Vehicles (AFV) sector is almost
entirely local with 97% of goods and services delivered to customers in Georgia. Other sectors with a
9
The three activities related to the Building Efficiency sector are Design or Construction of New Buildings;
Installation or Maintenance of Building System Components; and Sale of Building System Components.
9large local presence include Geothermal with 76% and Solar with 75% of goods and services delivered to
in‐state customers.
Some clean energy sectors have a sizeable customer base outside the state. Georgia’s Biomass/Biofuels
sector leads in exports with 47% of its goods and services delivered to customers outside Georgia,
including 9% that goes to international destinations. The cutting‐edge technology sectors Storage and
Smart Grid also have a large out‐of‐state customer base. Storage firms export 35% of their goods and
services and Smart Grid firms export 33% of their goods and services. The renewable energy sectors
with the greatest amount of export activity are Wind with 36% and Hydro with 34% of goods and
services delivered to out‐of‐state customers. Furthermore, firms engaged in clean energy Manufacturing
deliver 50% of their goods to out‐of‐state customers.
Figure 5: Goods and services by location of customer / destination market
10Future Growth
Responding firms generally rate the four‐state Southeast region as a good location for them to succeed
and anticipate that it will continue to be a good location for clean energy businesses over the next five
years. Thirty‐eight percent of the Georgia respondents plan on adding jobs during 2015. The two sectors
with the most aggressive hiring projections are AFV with 52% of respondents planning to add jobs, and
Solar with 44% of respondents planning to add jobs. These two sectors have key policies that are helping
drive their growth. For AFV, it is Georgia’s electric vehicle tax credit, which has made Georgia a top state
for electric vehicles. For Solar, it is the Public Service Commission’s approval of various large solar
initiatives including the Georgia Power Advanced Solar Initiative.
Georgia policymakers can replicate the success of the electric vehicle tax credit and solar initiatives by
implementing policies that spur the growth of other clean energy sectors. In fact, respondents indicate
that effective government‐sponsored rebate, grant, or loan programs are very beneficial for their firm.
Furthermore, they indicate that government‐sponsored incentives, which can be monetary and non‐
monetary, are beneficial for their firm.
Figure 6: Percent of firms by sector anticipating job growth during 2015
Respondents indicate that the factors most beneficial to their firm are research and development
collaboration between firms and university researchers, as well as the quality of educational institutions
in the four‐state region. However, the respondents somewhat agree with the statement that local
government and academic institutions eagerly partner with the private sector to promote the
development of new clean energy firms. These findings indicate the need for policies that facilitate
public‐private partnerships that allow for the development and commercialization of novel technologies.
Also vital to the growth of Georgia’s clean energy industry is matching the skills of the available
workforce to the needs of clean energy firms. Across all business sectors and activities, the top skill gaps
are customer service/sales and engineering/design. High performance building experience and energy
auditing expertise, which are related and important for Building Efficiency firms, are also top skill gaps.
Respondents indicated that financial analysis and electrical systems/wiring expertise are also very
important skill gaps in need of filling in order to grow their firm.
11High Points and Policy Drivers
Georgia has a robust and diversified clean energy industry that has at least 678 firms. Located
throughout the state, these firms engage in a wide array of business activities, and represent a diversity
of revenue and full‐time employment levels.
Georgia clean energy firms generate at least $2.9 billion in gross revenue and provide 19,663 full‐time
equivalent jobs. Building Efficiency firms lead the way in terms of employment and revenues, followed
by firms in the Biomass/Biofuels and Solar sectors. Firms engaged in making buildings energy efficient,
either in new energy efficient design and construction or energy efficiency retrofitting of existing
buildings, collectively have the highest employment and revenue figures. Firms that manufacture clean
energy goods come in second in terms of employment and revenue, followed by firms that install,
design, or develop renewable energy systems.
Clean energy projects reach all corners of the state and bring with them jobs and investment in local
communities; 76% of all clean energy goods and services stay within the state. Furthermore, income
enters the state through the sale of clean energy goods and services that originate here and are
exported to regional, national, and international markets. Forty‐seven percent of Georgia’s
Biomass/Biofuels goods and services are delivered to customers outside Georgia and firms engaged in
clean energy Manufacturing export half of their goods out‐of‐state.
Georgia’s clean energy industry will likely add jobs in 2015. There will likely be job postings in the
Alternate Fuel Vehicle, Solar, Energy Storage, and Building Efficiency sectors. Customer service/sales,
engineering/design, energy auditing, high performance building, financial analysis, and electrical
systems/wiring are skills gaps that firms are looking to fill.
Job growth, however, is impacted by policies and market factors. Firms indicate that there is a need for
policies that facilitate the partnering of local governments and academic institutions with the private
sector to promote new clean energy opportunities. Access to government‐sponsored rebate, grant, or
loan programs is also important, as are government‐sponsored incentives. Addressing the policy
considerations identified by the respondents can fuel the continued growth of Georgia’s already
impressive clean energy industry.
12Appendix A – Sector Definitions
For the Census, the clean energy industry contains the following ten business sectors:
1. Alternative Fuel Vehicles – Alternative Fuel Vehicles are those that run exclusively on alternative
fuels, including electricity, or a blend of traditional petroleum fuels and alternative fuels. These
include, but are not limited to:
o Hybrid electric vehicles
o Electric vehicles
o Flexible‐fuel vehicles
o Biofuel vehicles
o Natural gas vehicles
This sector also includes firms involved in the conversion of traditional fuel vehicles to run on
alternative fuels.
2. Biomass/Biofuels – This sector relates to the generation of heat or electricity from either the
combustion of organic and waste materials, or their conversion to biofuels. These organic and waste
materials include, but are not limited to:
o Plant‐based sources (e.g., wood, grasses, or natural oils)
o Municipal wastewater
o Municipal solid waste
3. Building Efficiency – This sector employs technologies, products, and services that reduce the
amount of energy required for processes, tasks, or buildings. Examples of firms in this sector,
include, but are not limited to:
o Developers or installers of more efficient lighting technologies or HVAC systems
o Producers or installers of other energy conservation technologies for buildings
o Energy Star, LEED, or EarthCraft builders
o Developers of more efficient manufacturing processes
4. Energy Storage – This sector covers energy storage devices or physical media that are used to store
energy, in various forms, for use at a later time. Technologies and products currently included in the
sector are:
o Batteries
o Mechanical storage mechanisms such as compressed air or flywheels
o Thermal storage
5. Fuel Cells – This sector includes technologies or devices that convert chemical energy from a fuel
source into electricity through an oxidizing reaction. Fuel sources may include:
o Hydrogen
o Hydrocarbons such as natural gas, methanol, or other alcohols
6. Geothermal – This sector includes both Geothermal Energy and Ground Source Heat Pump (GSHP)
technology. Geothermal Energy utilizes the thermal energy (heat) stored in the Earth to generate
13electricity, while GSHP is a central heating and cooling system that transfers heat to or from the
ground.
7. Hydropower/Marine – Hydropower refers to harnessing the force of falling or flowing water,
including marine waves, for useful purposes such as generating electricity or creating mechanical
force.
8. Smart Grid – This sector incorporates technologies and products related to updating the current
electricity grid infrastructure with increased multidirectional communication, data collection, and
automation. This includes, but is not limited to, digital metering equipment, sensors, controls, and
related software.
9. Solar – This sector includes technologies and products related to the conversion of sunlight either
directly into electricity through photovoltaic cells or indirectly through concentrated solar power.
The sector also includes solar thermal products that harness sunlight to meet thermal requirements
for residential, commercial, or industrial processes.
10. Wind – The wind sector includes products related to the harnessing of wind energy. This includes,
but is not limited to, wind turbines for the creation of electricity, wind pumps for pumping and
drainage power, and windmills for mechanical power.
To qualify as being active in a specific sector, a firm must perform at least one of the following nine
activities with that sector:
o Design or Construction of New Buildings
o Sale of Building System Components
o Sale of Renewable Energy Systems
o Installation, Design, or Development of Renewable Energy Systems
o Installation or Maintenance of Building System Components
o Manufacturing
o Power Generation
o Professional Services, Education, or Consulting
o Research and Development
14Appendix B ‐ Methodology
The 2014 Southeast Clean Energy Industry Census is a collaboration between the North Carolina
Sustainable Energy Association (NCSEA), the South Carolina Clean Energy Business Alliance (SCCEBA),
Southface in Georgia, and the Virginia Energy Efficiency Council (VAEEC). These organizations are
collectively referred to as the Partners.
Each Partner compiled a list of clean energy companies, organizations, and institutions (collectively
referred to as firms) in its state. Each state‐level Census relied on a common questionnaire developed by
the Partners, as well as an online survey tool and phone‐banking system managed by North Carolina
State University Center for Urban Affairs and Community Services (NC State). NCSEA performed the data
analysis of all Census data with input from the Partners.
Results in this report are specific to clean energy business conducted within Georgia. Please see
www.cleanenergyindustry.org for information regarding all states included in the Southeast Census.
A Conservative Approach
The Partners utilized the approach taken by NCSEA during the first five iterations of the North Carolina
Clean Energy Industry Census from 2008 – 2012. The 2014 Georgia Clean Energy Industry Report
presents direct findings from self‐reported data provided by 232 firms operating within Georgia. This
represents approximately 34% of the estimated 678 firms currently conducting clean energy business in
Georgia. These 232 responding firms and 446 modeled firms represent a significant portion of the
state’s clean energy industry, but certainly do not cover all activity. We did not quantify impacts of any
activity of Georgia’s clean energy industry beyond the 678 firms that were identified. The conservative
nature of the analysis means that the economic benefits of Georgia’s clean energy industry is greater
than what is presented in the 2014 Census.
Identifying Clean Energy Firms
1. Southface compiled a preliminary list of Georgia firms potentially in the clean energy industry from
the following sources:
a. Lists of firms maintained by Southface.
b. Publically available industry websites.
c. Lists maintained by other organizations.
d. Online searches.
2. Southface assessed whether each firm is involved in a clean energy business sector included in the
Census.
3. For firms deemed to be within the scope, Southface identified primary and secondary contacts and
obtained their email and telephone information.
4. Southface shared its preliminary list of clean energy firms with other Partners to eliminate duplicate
entries.
5. Southface delivered its list of Georgia clean energy firms to NC State. NC State conducted the online
survey and follow‐up phone interviews.
15Performing the Survey
1. Each Georgia firm received an email from Southface that included a hyperlink to the online survey,
as well as unique login and password credentials.
2. Southface sent multiple reminder emails to those Georgia firms that had not completed the survey.
3. NC State conducted phone interviews with Georgia firms that had not yet completed the online
survey.
4. The Partners closed the survey on October 31, 2014.
Identifying Business Units
Firms were asked to self‐identify as being involved in the clean energy industry by indicating they had at
least one employee dedicating a portion of their time to one of the nine business activities in one of ten
clean energy business sectors. Each activity within a clean energy industry sector is defined as a clean
energy business unit (e.g., Research and Development / Solar). The 2014 Census has 90 activity/sector
cross‐sections resulting from combinations of the following activities and sectors:
Activities Sectors
Design or Construction of New Buildings Alternative Fuel Vehicles
Sale of Building System Components Biomass/Biofuels
Sale of Renewable Energy Systems Building Efficiency
Installation, Design, or Development of Renewable Energy Systems Energy Storage
Installation or Maintenance of Building System Components Fuel Cells
Manufacturing Geothermal
Power Generation Hydropower/Marine
Profession Services, Education, or Consulting Smart Grid
Research and Development Solar
Wind
Through this selection process, each responding firm indicated its clean energy business unit(s). Firms
were asked to provide their total full‐time equivalent (FTE) employment and total gross annual revenue
at all locations. Firms were also asked to complete metrics for each of their clean energy business
unit(s), including:
Percentage of total staff time allocated to each business unit;
Percentage of that work occurring in Georgia, North Carolina, South Carolina, and/or Virginia;
Anticipated change in jobs for each business unit;
Location of any additional offices associated with each business unit; and
The percentage of goods and services delivered to each geographic market for each business
unit.
16Calculating Full‐Time Equivalent Employees of Responding Firms
The Partners used full‐time equivalent employees, or FTEs, as opposed to the number of individual
employees. FTE is representational of a single 30 hour per week block of employment. NCSEA calculated
clean energy FTE employees by multiplying a firm’s total number of FTE employees at the time of the
survey by the percentage of total staff time that the firm dedicated to each of its clean energy business
units in Georgia. FTEs provide a high degree of flexibility for accurately modeling the equivalent man‐
hours spent working on clean energy. For example, two employees who spend 50% of their time on
clean energy would be calculated as a clean energy FTE of 1.0.
Calculating Annual Revenue of Responding Firms
The Partners asked firms to report their total gross annual revenue from the most recent fiscal year
(2013/2014 in this case) by selecting from the following revenue ranges:
1. Less than $100,000 9. $25 million to less than $50 million
2. $100,000 to less than $250,000 10. $50 million to less than $100 million
3. $250,000 to less than $500,000 11. $100 million to less than $250 million
4. $500,000 to less than $1 million 12. $250 million to less than $500 million
5. $1 million to less than $2.5 million 13. $500 million or more
6. $2.5 million to less than $5 million 14. Prefer not to answer
7. $5 million to less than $10 million 15. Do not know
8. $10 million to less than $25 million
Firms were then assigned a revenue number equal to the median value the range they selected. In
other words, a firm falling in the “less than $100,000” bracket was classified as “$50,000.” Firms in the
“$500 million or more” bracket were classified as $500 million. To calculate a firm’s revenue by clean
energy business unit, NCSEA multiplied the firm’s total revenue by the percentage of total staff time that
the firm dedicated to each business unit active in Georgia.
Modeled Firms
NCSEA used survey response data to estimate the total number of clean energy firms active in Georgia.
This included firms that responded to the Census survey as well as additional firms that were modeled
based on the data from responding firms. NCSEA used the following process for estimating the total
number of clean energy firms and assigning them characteristics:
1. Southface compiled a list of firms potentially involved in Georgia’s clean energy industry. All of these
firms were contacted via email and/or telephone and a percentage of them provided complete
survey responses. NC State placed all of the firms, regardless of whether they provided a responses,
into the following categories:
a. Completed Interviews – Firms that completed the survey through a phone interview with NC
State.
b. Completed Online – Firms that completed the survey online via the email link.
c. Respondent Will Do Online – Firms that indicated to NC State over the phone that they
would take the survey online, but did not complete the survey.
17d. Respondent Ineligible – Firms that self‐identified as not being involved in the clean energy
industry.
e. Duplicate ID – Firms that appeared on the initial list twice.
f. Attempts Exhausted – Firms that NC State was unable to contact over the phone and did not
complete the survey online.
g. Wrong Number – The provided phone number was incorrect.
h. Out of Service – The provided phone number was no longer in service.
i. Refused – Firms that indicated they were not willing to participate in the survey but did not
self‐identify as being ineligible.
2. NCSEA identified the firms in the Completed Interviews, Completed Online, Respondent Will Do
Online, and Refused categories as active in the Georgia clean energy industry.
3. NCSEA identified the firms in the Respondent Ineligible, Duplicate ID, Wrong Number, and Out of
Service Categories as not active in the Georgia clean energy industry.
4. NCSEA estimated the percentage of the remaining firms, those in the Attempts Exhausted category,
that are active in the Georgia clean energy industry using the following calculation:
Additional Firms
Completed Interviews, Completed Online, Respondent Will Do Online, and Refused Categories Attempts Active in GA Clean
x =
Total Number of Firms Contacted Exhausted Energy Industry
5. NCSEA added the firms in Step 2 and 4 to determine the estimated number of firms active in
Georgia’s clean energy industry.
6. NCSEA determined the number of modeled firms by subtracting the number of Completed
Interviews and Completed Online responses from the total number of firms in the industry.
7. NCSEA calculated an 80% trimmed mean for the FTE and revenue in each business unit
(activity/sector cross‐section) by removing the upper and lower 10% of the reported FTE and
associated revenue.
8. NCSEA applied the resulting trimmed means of FTE and revenue for the 90 activity/sector cross‐
sections to the modeled firms based on their relative percentages in the direct response data, i.e.,
information provided through the Completed Interviews and Completed Online responses.
A Note about Removed Firms
The Partners assessed all responses and identified firms that provided data that clearly appeared to
overstate employment or revenues. These firms were contacted again in an effort to validate their
responses. The Partners kept in the data set corrected responses from firms who retook the Census and
eliminated from the dataset responses from firms that could not be reached.
18You can also read


