General Educational Development (GED) and Educational Attainment Equivalency for Demographically Adjusted Norms - Emory School of Medicine
←
→
Page content transcription
If your browser does not render page correctly, please read the page content below
Archives of Clinical Neuropsychology 34 (2019) 1340–1345

     General Educational Development (GED) and Educational Attainment
              Equivalency for Demographically Adjusted Norms†
                   Kelsey C. Hewitt1, Meghan W. Cody1, Craig D. Marker1, David W. Loring2,*

                                                                                                                                                              Downloaded from https://academic.oup.com/acn/article/34/8/1340/5305600 by guest on 03 May 2021
                         1
                             Department of Clinical Psychology, Mercer University College of Health Professions, Atlanta, GA, USA
                              2
                               Departments of Neurology and Pediatrics, Emory University School of Medicine, Atlanta, GA, USA
                 *Corresponding author at: Emory Brain Health Center, 12 Executive Park, Atlanta, GA 30329, USA. Tel.: 404-727-4116;
                                                  E-mail address: dloring@emory.edu (D.W. Loring)
                                                Editorial Decision 10 January 2019; Accepted 11 January 2019

Abstract
Objective: To investigate whether the General Educational Development (GED) certificate should be considered equivalent to a standard
12-year high school education when performing demographic corrections on neuropsychological performance levels. If the GED certificate
and high school diploma reflect comparable levels of educational achievement, then performance on the Test of Premorbid Function
(TOPF) and selected WAIS-IV indices should not differ between groups.
Method: Archival neuropsychology data were reviewed to identify patients who either (1) did not complete high school and did not sub-
sequently obtain a GED, (2) did not complete high school but subsequently obtained a GED, or (3) completed high school and did not
obtain any further formal education. Most patients were programmatic referrals for epilepsy surgery evaluation, although referrals from the
general neurology clinic were also included. The primary dependent measures were the TOPF and WAIS-IV Full Scale IQ (FSIQ).
Results: High school graduates obtained higher scores on the TOPF (p < .01, partial η2 = 0.16) and FSIQ (p < .01, partial η2 = 0.14) as
compared to both GED subjects and subjects withdrawing from high school with no GED. The non-GED group and the GED group did not
differ from each other.
Conclusions: These findings demonstrate that the GED is not equivalent to a standard 12-year high school education when characterizing
educational background. Although these data do not address what the appropriate year equivalent should be for the GED when adjusting
performance for educational background, using 12 years will likely identify more areas of neuropsychological weakness simply by suggest-
ing higher levels of premorbid ability.
Keywords: General Educational Development (GED); Education; Equivalence; Demographically adjusted norms

Introduction

   Level of education is an important factor influencing neuropsychological test performance, and normative adjustments that
incorporate education level are often employed when interpreting neuropsychological results and estimating cognitive reserve.
Unfortunately, little research has addressed the equivalence between seemingly comparable metrics of educational back-
ground, namely the General Educational Development (GED) certificate and the standard high school diploma. No consensus
exists for translating a GED into appropriate years of education when performing demographic corrections with test perfor-
mance. Common approaches include (1) treating the GED as standard high school completion reflecting 12 years of educa-
tion, (2) using the number of years of schooling successfully completed prior to obtaining the GED, or (3) assigning the GED
a lower education equivalent than 12 years (e.g., GED is considered as 10 years of education regardless of years completed).
This approach of equating the GED to a high school education is not limited to individual patient assessment. In population

 †
  This study was submitted by the first author as partial fulfillment for the Psy.D. requirements at Mercer University. We thank Dr. Felicia C. Goldstein for
 her careful review of this manuscript and helpful suggestions.

© The Author(s) 2019. Published by Oxford University Press. All rights reserved. For permissions, please e-mail: journals.permissions@oup.com.
doi:10.1093/arclin/acz003 Advance Access publication on 1 February 2019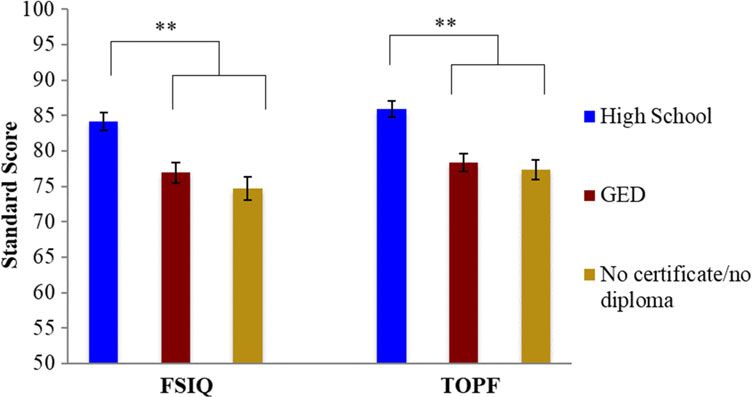
K.C. Hewitt et al. / Archives of Clinical Neuropsychology 34 (2019); 1340–1345         1341

studies, GED recipients are often grouped into a single category with high school graduates (e.g., Heckman, Humphries, &
Kautz, 2014; Zajacova & Montez, 2017).
   The purpose of this study is to investigate whether the GED should be considered equivalent to a 12-year high school educa-
tion when performing demographic education adjustments during neuropsychological assessment. If the GED and high school
diploma reflect comparable levels of educational achievement, formal estimates of premorbid function (i.e., Test of Premorbid
Function, TOPF) should not differ between groups. Similarly, given WAIS-IV Full Scale IQ’s (FSIQ) strong correlation with
education level and premorbid functioning (Pearson Assessment, 2009), GED recipients and high school graduates should not
differ on measures of general cognitive function. However, if a GED certificate does not represent educational achievement com-
parable to a high school diploma, then we would expect the GED group to perform more poorly on TOPF and FSIQ.

Methods

                                                                                                                                 Downloaded from https://academic.oup.com/acn/article/34/8/1340/5305600 by guest on 03 May 2021
   After obtaining Emory University and Mercer University IRB approval, subjects were identified from neuropsychology re-
ports. A total of 2,058 neuropsychological records from patients tested between January 1, 2012 and December 15, 2017
were examined to identify subjects who were administered both the TOPF and the WAIS-IV and who could be classified into
one of three mutually exclusive education categories: (1) did not complete high school and did not subsequently obtain a
GED, (2) did not complete high school but subsequently obtained a GED, or (3) completed high school and did not obtain
any further formal education. Reasons that either the TOPF or WAIS-IV were not administered included different test ver-
sions during transition to current tests across the departmental neuropsychology service, and programmatic evaluation needs
in which the WASI-II rather than the WAIS-IV was administered (i.e., DBS evaluation). Our search yielded a final study eli-
gible subject pool of n = 205.
   We then excluded subjects with evidence suggesting cognitive decline (n = 17). Given the TOPF was co-normed with
WAIS-IV for prediction accuracy, patients who had TOPF versus FSIQ discrepancy scores (i.e., patients with TOPF ≥ 15
points compared to FSIQ) were excluded to avoid including subjects with generalized cognitive decline (Berg, Durant,
Banks, & Miller, 2016; Pearson Assessment, 2009). Epilepsy surgery candidates comprised the largest group of excluded pa-
tients (n = 6), with other excluded diagnoses including multiple sclerosis, stroke, and probable Alzheimer’s disease. Subjects
with reported learning disabilities and those who attended special education classes were also excluded (n = 31). Six addi-
tional subjects were excluded since their ages fell outside the range for WAIS-IV demographic correction. The final sample
consisted of 151 subjects (no certificate/no diploma n = 36; GED certificate n = 31; high school diploma without additional
formal education n = 84). Our primary dependent measures were TOPF and FSIQ. We also studied all WAIS-IV index scores
(Verbal Comprehension Index, VCI; Perceptual Reasoning Index, PRI; Working Memory Index, WMI; and Processing Speed
Index, PSI) to further characterize the relationship of education classification on more discrete cognitive domains.

Results

    Subjects were predominantly female (n = 94, 62.3%), white (n = 89, 58.9%), right-handed (n = 135, 89.4%), with a mean
age of 40.29 years (SD = 14.21). The last grade completed included eighth grade (n = 8, 5.3%), ninth grade (n = 9, 6.0%),
10th grade (n = 28, 18.5%), and 11th grade (n = 22, 14.6%). Most referrals were for epilepsy surgery evaluation (n = 111,
73.5%), with the remaining subjects referred from the general neurology service to provide further diagnostic clarity (n = 40,
26.5%). Subjects in the no certificate/no diploma group were predominantly referred for epilepsy surgery evaluation (n = 25,
69.4%), male (n = 19, 52.8%), African American (n = 19, 52.8%), with a mean age of 40.75 years (SD = 15.28). Subjects in
the GED group were predominantly referred for epilepsy surgery evaluation (n = 23, 74.2%), female (n = 22, 70.9%), white
(n = 20, 64.5%), with a mean age of 38.29 years (SD = 14.72). Subjects in the high school group were predominantly
referred for epilepsy surgery evaluation (n = 61, 72.6%), female (n = 56, 66.7%), white (n = 50, 59.5%), with a mean age of
40.94 years (SD = 14.16).
    We used independent one-way ANOVAs to test for group differences for both our primary and secondary measures and
used Welch’s adjusted F ratio if the homogeneity of variance assumption was violated. When group differences were demon-
strated, post-hoc tests were performed to identify the source of the group differences using Tukey’s HSD.

TOPF and FSIQ

  Because the assumption of homogeneity of variance was not met for the TOPF [Levene’s Test of Homogeneity of
Variances: F(2, 148) = 3.36, p = .037], we used Welch’s adjusted F ratio. Homogeneity of variance assumption was not
1342 K.C. Hewitt et al. / Archives of Clinical Neuropsychology 34 (2019); 1340–1345
violated for FSIQ. Significant group differences were present for both FSIQ [F(2, 148) = 12.04, p < .001, partial η2 = 0.14]
and TOPF [F(2, 148) = 14.59, p < .001, partial η2 = 0.16]. Means and standard deviations are presented in Table 1.
Post-hoc HSD comparisons indicated that TOPF for both the GED (M = 78.32, SD = 6.95) and no certificate/no diploma
groups (M = 77.31, SD = 8.08) were significantly lower (p < .01) than high school graduates (M = 85.88, SD = 10.75). Post-
hoc analysis for FSIQ demonstrated the same pattern, with high school graduates (M = 84.11, SD = 11.62) performing signif-
icantly higher (p < .01) than GED (M = 76.90, SD = 8.25) and no certificate/no diploma groups (M = 74.72, SD = 9.74).
Performance did not differ on either TOPF or FSIQ between the two non-high school education groups (see Fig. 1).
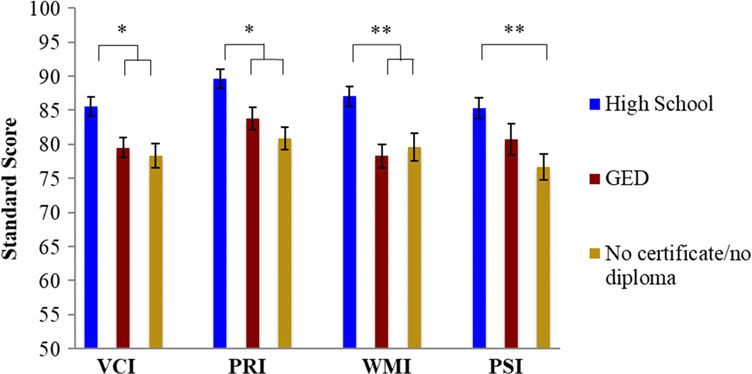
VCI, PRI, WMI, and PSI
Analyses were conducted contrasting group differences on the WAIS-IV secondary measures. Since the assumption of
homogeneity of variance was not met for VCI [Levene’s Test of Homogeneity of Variances: F(2, 148) = 4.34, p = .015], we
Downloaded from https://academic.oup.com/acn/article/34/8/1340/5305600 by guest on 03 May 2021
used Welch’s adjusted F ratio. Homogeneity of variance was met for PRI, WMI, and PSI. Fig. 2 shows group differences on
index scores. Post-hoc comparisons using Tukey’s HSD for WAIS-IV indices showed similar results to the FSIQ scores, with
the high school group performing significantly higher than the other two groups (which were not different from each other)
on VCI (p < .05, partial η2 = 0.08), PRI (p < .05, partial η2 = 0.10), and WMI (p < .01, partial η2 = 0.10). In contrast, high
school graduates performed significantly higher (p < .01, partial η2 = 0.07) than the no certificate/no diploma group for PSI
but did not differ from those obtaining a GED. Means and standard deviations of index scores are included in Table 1.
Discussion
This study demonstrates that despite obtaining a GED certificate, performance levels on both the TOPF and WAIS-IV
FSIQ are lower compared to patients completing a standard high school curriculum. These data also indicate that there is no
performance benefit of obtaining a GED compared to subjects who did not obtain a GED after leaving high school. High
school graduates scored higher than both GED certificate and no certificate/no diploma groups on the TOPF and FSIQ, which
were our primary dependent measures, and also on VCI, PRI, and WMI, but not PSI. Across all measures, GED recipients
performed no better than those who did not complete high school and did not obtain a GED.
Table 1. Means and standard deviations of test scores for each educational group
No certificate/no diploma GED High School
(N = 36) (N = 31) (N = 84)
M SD M SD M SD
TOPF 77.31 8.08 78.32 6.95 85.55 10.75
FSIQ 74.72 9.74 76.90 8.25 84.12 11.62
VCI 78.33 11.00 79.52 8.03 85.61 12. 91
PRI 80.86 10.04 83.77 9.16 89.60 12.88
WMI 79.61 12.17 78.29 9.49 87.04 12.91
PSI 76.64 11.35 80.77 12.75 85.35 14.20
Fig. 1. Standard scores for FSIQ and TOPF for each educational group. Error bars represent standard error of the mean. **p < .01.K.C. Hewitt et al. / Archives of Clinical Neuropsychology 34 (2019); 1340–1345 1343
Fig. 2. Standard scores for WAIS-IV indices for each educational group. Error bars represent standard error of the mean. **p < .01; *p < .05.
Downloaded from https://academic.oup.com/acn/article/34/8/1340/5305600 by guest on 03 May 2021
Although GED is often referred to as the General Equivalency Diploma, GED stands for the General Educational
Development certificate, a misinterpretation that has likely contributed to the GED being considered equivalent to a high
school diploma. The GED was established in 1942 to provide military personnel, who were unable to complete high school
due to their World War II participation, a means to demonstrate high school level proficiency for college placement; although
it was not intended as a high school credentialing instrument, the GED was developed by the American Council on Education
by United States Armed Forces Institute for military use (Tyler, 2005; Quinn, 2003). GED eligibility was first extended to the
civilian population in New York in 1947, and subsequently to all remaining states and the District of Columbia. Interestingly,
New York was the last state to issue GEDs to veterans but the first state to issue GEDs to non-veterans (Quinn, 2003).
There are multiple reasons why a GED certificate may reflect a less robust educational background than a standard high
school education. Level of education is one of the many factors contributing to cognitive reserve, that is, the apparent benefit
of stimulating life experience that mitigates against the magnitude of cognitive impairment associated with brain disease com-
pared to patients from less enriched backgrounds with comparable lesion burdens (Stern et al., 2018). However, the GED pri-
marily is awarded based upon performance on a standardized multiple-choice test in few content areas. Like many
standardized measures, there is a cottage industry of formal preparatory courses and books that teach specifically to GED test
content. Thus, a GED, which can be attempted multiple times if not initially passed, cannot reflect the breadth of educational
experience associated with a high school diploma. Although some might assert that more cognitively able patients tend to go
further in school due to their academic success, thereby introducing a systematic bias in the performance levels of patients
who did not complete high school, the critical contrast in this study is the comparison of patients who did not complete high
school but subsequently obtained a GED to patients who completed high school without further formal education, thus dimin-
ishing the relevance of this concern.
Though beyond what can be suggested based upon the current data, similar issues are confronted with patients with multi-
ple post-baccalaureate degrees. For example, should a person obtaining two master’s degrees be considered to have 18 years
of education or 20 years? Informal surveying suggests that most neuropsychologists would treat this situation by using 18
years, reflecting the highest degree obtained. However, neuropsychologists who would suggest 20 years as the proper choice
rather than highest degree argue that the total number of years is relevant, and in the context of establishing cognitive reserve
in which diversity of stimulating experience is relevant, two master’s degrees may reflect a greater breadth and richer educa-
tional background than other advanced degrees such as Ph.D. or M.D. in which the final school years are often spent outside
the classroom and focused instead on narrow research or clinical issues.
The use of 12 years to estimate premorbid function has potential significance when making inferences regarding education
since this methodology will tend to yield lower demographic corrections. Consider the following hypothetical example
derived from Heaton, Miller, Taylor, and Grant’s (2004) demographic corrections for commonly used neuropsychological
measures. A 76-year-old African American male with a history of hypertension, hyperlipidemia, and Type II diabetes is
referred for evaluation of possible cognitive decline. He obtained a GED after dropping out of high school during the ninth
grade to help support his family, and is now retired for approximately 10 years from working in construction. On neuropsy-
chological testing, he obtained a score of 27/60 on the Boston Naming Test (BNT), a total of 14 words generated on the
Controlled Oral Word Association (COWA), and eight different animal names generated during a single 60-second trial. If
his GED is considered to be equivalent to 12 years of school, then the performance levels may be diagnostically relevant
(BNT = 4th percentile, COWA = 5th percentile, Animal fluency = 8th percentile). In contrast, if performance levels are1344 K.C. Hewitt et al. / Archives of Clinical Neuropsychology 34 (2019); 1340–1345
estimated using 8 years of education, reflecting the last year of school completed, a different performance profile is observed
(BNT = 16th percentile, COWA = 16th percentile, Animal fluency = 16th percentile). Although performance levels should
never be interpreted in isolation, using 12 years to generate normative performance levels suggests decline across multiple rel-
evant neuropsychological tests, whereas using the number of school years successfully completed yields a very different clini-
cal inference.
There are several limitations to this study given its retrospective nature examining archival data and the sample of patients
that included a large number of programmatic evaluations for possible epilepsy surgery, although all subjects in the study
were patients referred by neurologists. Unfortunately, clinical information regarding age of seizure onset, epilepsy syndrome,
and seizure frequency was not characterized in this database. Thus, it is possible that there may have been a systematic group
difference in seizure characteristics across groups, although we consider this to be unlikely since epilepsy surgery candidates
were equally represented across all groups and that these programmatic referrals were for the same clinical indication. In addi-
tion, these factors are secondary to the overall issue to investigate whether a GED certificate can be considered equivalent to a
Downloaded from https://academic.oup.com/acn/article/34/8/1340/5305600 by guest on 03 May 2021
high school diploma when performing demographic test correction equivalent (i.e., rejecting the null hypothesis that there is
no difference between groups), although future research into various clinical and disease effects on estimates of premorbid
function will address issues of generalizability of these findings to other neurological conditions and cognitively normal sub-
jects without neurologic disease.
Because of their chronic condition, some epilepsy patients may have left school due to frequent seizures rather than simply
by choice, thereby making the number of years of schooling more reflective of their educational background compared to sub-
jects who had a more normal developmental history. However, the primary group comparison contrasted those subjects (epi-
lepsy or not) who subsequently obtain a GED compared to subjects completing a standard high school curriculum. Ideally,
future studies can be of sufficient size so that groups can be carefully matched on factors such as diagnosis, medication bur-
den, and disease severity. However, since the primary variable of interest is estimated premorbid function using TOPF, the
specific clinical presentation should be unlikely to meaningfully affect our results unless patients with expected performance
interactions with the TOPF are included (e.g., patients with left perisylvian lesions from stroke).
Additionally, important demographic information was not obtained. For instance, social economic status (SES) was not re-
corded so we were unable to examine whether SES was a moderating variable regarding GED equivalence. Finally, education
level including obtaining a GED certificate was self-reported and not independently verified. Unfortunately, our sample size
was not sufficient to allow us to examine potential performance differences at different years of education for subjects not
completing high school.
Despite these limitations, the study provides insight into factors associated with determining the equivalence of different
types of education. Future research should explore other educational parameters (i.e., online education, home-schooling, etc.)
since web-based curricula are expected to continue to increase both in traditional and non-traditional educational
environments.
Our study supports using the number of completed years of regular academic coursework as the most appropriate metric to
reflect educational achievement (Heaton et al., 2004). Compared to Heaton and colleagues (2004), however, other systems are
not as explicit. The 2004 Joint Committee on Testing Practices guidelines recommend that the nature of content, norms, or
comparison groups, other technical evidence, and benefits and limitations of test results be incorporated into test interpretation
(Code of Fair Testing Practices in Education, 2004). This language appears purposely vague to facilitate clinical judgment
and flexibility in interpretation. Although norming often incorporates number of years of academic coursework completed
(Heaton et al., 2004), as noted by Manly (2005), the use of demographic correction with neuropsychological testing is simply
a proxy to correct for differences in cultural, socioeconomic, and education backgrounds. Because these distinctions are not
always clear, a more scientific approach to future test standardization may be to use formal estimates such as the TOPF to
adjust for differences in educational background differences when interpreting neuropsychological test performance
(O’Bryant et al., 2007). Until that time exists, we suggest clinical judgment be used to determine what normative values
appear to be most clinically relevant for patient characterization and, in particular, neuropsychological performance of patients
with GEDs be demographically corrected by formal years of education completed.
Conflict of interest
None declared.K.C. Hewitt et al. / Archives of Clinical Neuropsychology 34 (2019); 1340–1345 1345
References
Berg, J., Durant, J., Banks, S. J., & Miller, J. B. (2016). Estimates of premorbid ability in a neurodegenerative disease clinic population: Comparing the Test
of Premorbid Functioning and the Wide Range Achievement Test, 4th Edition. The Clinical Neuropsychologist, 4, 547–557. doi:10.1080/13854046.2016.
1186224.
Code of Fair Testing Practices in Education. (2004). Washington, DC: Joint Committee on Testing Practices. Retrieved from https://www.apa.org/science/
programs/testing/fair-testing.pdf
Heaton, R. K., Miller, S. W., Taylor, M. J., & Grant, I. (2004). Revised comprehensive norms for an expanded Halstead-Reitan Battery: Demographically
adjusted neuropsychological norms for African American and Caucasian adults scoring program. Lutz, FL: Psychological Assessment Resources.
Heckman, J., Humphries, J., & Kautz, T. (2014). The myth of achievement tests: The GED and the role of character in American life. Chicago, IL: University
of Chicago Press.
Manly, J. J. (2005). Advantages and disadvantages of separate norms for African Americans. The Clinical Neuropsychologist, 19, 270–275.
O’Bryant, S. E., Lucas, J. A., Willis, F. B., Smith, G. E., Graff-Radford, N. R., & Ivnik, R. J. (2007). Discrepancies between self-reported years of education
and estimated reading level among elderly community-dwelling African-Americans: Analysis of the MOAANS data. Archives of Clinical
Neuropsychology, 22, 327–332.
Downloaded from https://academic.oup.com/acn/article/34/8/1340/5305600 by guest on 03 May 2021
Pearson Assessment. (2009). Advanced clinical solutions for the WAIS-IV and WMS-IV: Clinical and interpretive manual. San Antonio, TX: NCS Pearson.
Quinn, L. M. (2003). An Institutional History of the GED. ETI Publications. Paper 112. Retrieved from http://dc.uwm.edu/eti_pubs/112
Stern, Y., Arenaza-Urquijo, E. M., Bartres-Faz, D., Belleville, S., Cantilon, M., Chetelat, G., et al. (2018). Whitepaper: Defining and investigating cognitive
reserve, brain reserve, and brain maintenance. Alzheimer’s & Dementia. doi:10.1016/j.jalz.2018.07.219Advance online publication.
Tyler, J. H. (2005). The General Educational Development (GED) credential: History, current research, and directions for policy and practice. In Comings J.,
Garner B., Smith C., Comings J., Garner B., & Smith C. (Eds.), Review of adult learning and literacy: Connecting research, policy, and practice, Vol. 5,
pp. 45–84). Mahwah, NJ, US: Lawrence Erlbaum Associates Publishers.
Zajacova, A., & Montez, J. K. (2017). The health penalty of the GED: Testing the role of noncognitive skills, health behaviors, and economic factors. Social
Science Quarterly, 98, 1–15. doi:10.1111/ssqu.12246.You can also read


