Systematic prediction of drug resistance caused by transporter genes in cancer cells - Nature
←
→
Page content transcription
If your browser does not render page correctly, please read the page content below
www.nature.com/scientificreports
OPEN Systematic prediction of drug
resistance caused by transporter
genes in cancer cells
Yao Shen1* & Zhipeng Yan2
To study the drug resistance problem caused by transporters, we leveraged multiple large-scale
public data sets of drug sensitivity, cell line genetic and transcriptional profiles, and gene silencing
experiments. Through systematic integration of these data sets, we built various machine learning
models to predict the difference between cell viability upon drug treatment and the silencing of
its target across the same cell lines. More than 50% of the models built with the same data set or
with independent data sets successfully predicted the testing set with significant correlation to
the ground truth data. Features selected by our models were also significantly enriched in known
drug transporters annotated in DrugBank for more than 60% of the models. Novel drug-transporter
interactions were discovered, such as lapatinib and gefitinib with ABCA1, olaparib and NVPADW742
with ABCC3, and gefitinib and AZ628 with SLC4A4. Furthermore, we identified ABCC3, SLC12A7,
SLCO4A1, SERPINA1, and SLC22A3 as potential transporters for erlotinib, three of which are also
significantly more highly expressed in patients who were resistant to therapy in a clinical trial.
During recent decades, the volume, velocity, and variety of cancer-related data have exploded thanks to new
technologies, such as next-generation genomic sequencing and high-throughput screening. This includes large-
scale screening of drug sensitivities or gene silencing/knock-out across cancer cell lines as well as molecular
characterization of cancer cell lines such as gene expression, somatic mutations, and copy number variations1.
In addition to cell line models, large institutional efforts have enabled comprehensive molecular profiling of
clinical patient samples across different tumor types. For example, the Cancer Genome Atlas (TCGA) project
has generated large-scale transcriptional, genomic and epigenomic data for more than 11,000 patients2. Integra-
tion of these omics data using mathematical models and machine learning techniques will provide insights into
various cancer research problems, such as drug resistance.
Recent advances in cancer research have contributed significantly to more effective treatment and improved
patient survival. However, in many cases, patients initially respond to therapy but later develop resistance, which
leads to disease recurrence and patient relapse. Cancer drug resistance remains a major challenge in medical
oncology3,4. Drug resistance is a complex problem and can occur by different mechanisms, including alteration
of drug targets, drug activation, cell death inhibition, and cancer stem cell populations, as well as alteration of
drug efflux and uptake caused by changes in drug transporters.
Drug transporters are membrane proteins that transport a variety of compounds across membranes, includ-
ing the solute carrier protein (SLC) family and the ATP-binding cassette (ABC) family5. The SLC and ABC
transporter superfamilies contain transmembrane efflux proteins that translocate structurally diverse substrates,
including lipids, metabolites, amino acids, ions and many cancer drugs, across membranes either for uptake or
export. Many transporters are involved in multidrug resistance in tumor cells when they are overactivated in
cancer cells and export cancer drugs outside the cells, which will lead to tumor resistance5. For example, there
are 48 ABC genes reported in humans, and they are known to play an important role in mediating the multidrug
resistance (MDR) in cancer patients, where patients develop resistance not only to the drugs they are taking but
rugs6. There have been extensive studies on several transporters. For example, ABCB1 (also
also to other types of d
called p-glycoprotein) is frequently amplified in multidrug-resistant cells and can export various xenobiotics not
limited to cancer d rugs7. Nonsynonymous as well as synonymous single nucleotide polymorphisms (SNPs) of
multiple transporter genes have also been found to be associated with interindividual differences in responses
to chemotherapy in cancer8. Because of sequence similarities among the transporter genes, they are expected to
have similar transporting functions. However, there have been limited systematic studies of all transporter genes
1
Department of Computer Science, New Jersey Institute of Technology, Newark, NJ, USA. 2Martin Tuchman School
of Management, New Jersey Institute of Technology, Newark, NJ, USA. *email: yshen@njit.edu
Scientific Reports | (2021) 11:7400 | https://doi.org/10.1038/s41598-021-86921-9 1
Vol.:(0123456789)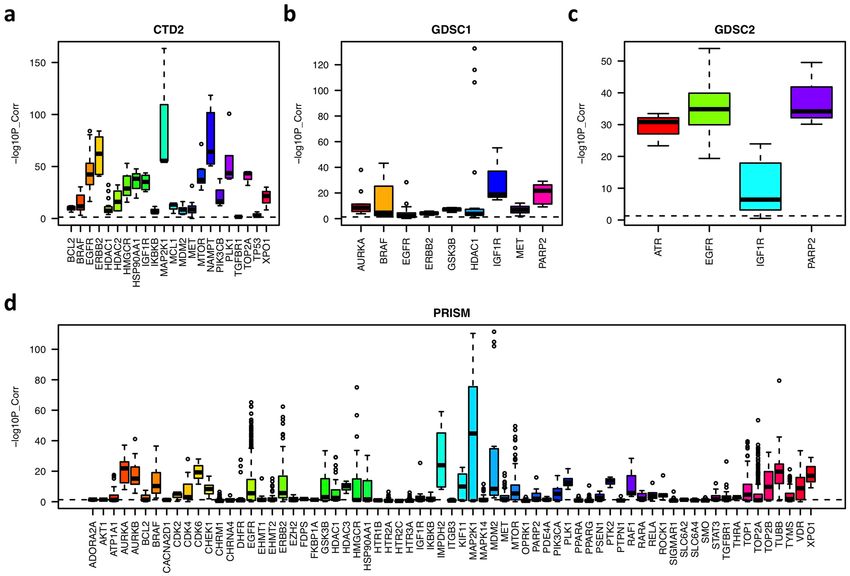
www.nature.com/scientificreports/
in cancer cells. A study of ABC transporter genes using NCI60 cancer cell line data was previously reported but
mainly focused on the relationship between one transporter and one drug9.
In this work, we used a systematic and data-driven approach that applies various machine learning models
to study the potential interactions of transporters with drugs that may cause drug resistance in cancer cells. We
hypothesized that the difference between the effects of the drug treatment and the silencing of the drug’s primary
target in the same cell lines is mainly due to the resistance mechanism in which the drug is transported outside
the cells, which reduces the concentration of drugs in the cells. Based on this hypothesis, we built machine
learning models using the transcriptional and genomic profiles of all potential transporters to predict viability
differences between the drug treatment and the silencing of the drug’s primary target across the same cell lines.
For this, we leveraged multiple public data sets, including drug sensitivities across a panel of cancer cell
lines, the gene expression and genetic profiles in the corresponding cell lines, and the genome-wide shRNA or
CRISPR-cas9 silencing of individual genes in these cell lines. We split each data set into training and testing sets.
We used cross-validation (CV) techniques to select the best parameters when training the models in the training
set and evaluated model performance using the testing set. We also trained models on one data set and tested
the models with other independent data sets. More than 50% of the models successfully predicted the ground
truth data. Features selected by the models were also significantly enriched in known transporters reported in
the DrugBank database10. We also predicted novel potential transporter drug interactions that may confer drug
resistance. The predicted novel transporters for erlotinib were further validated using an in vivo data set of lung
cancer patients. Three out of the five predicted transporters were also significantly more highly expressed in the
resistant versus the sensitive patients, which indicates their potential roles in drug resistance in patients.
Results
Preprocessing of public data sets for analysis. To perform this study, we leveraged multiple publicly
available data sets. Drug sensitivity across cancer cell lines has been profiled and deposited in multiple databases,
including the CTD2 data set from the Cancer Target Discovery and Development Network (https://ctd2-dashb
oard.nci.nih.gov/dashboard/)11 with 481 compounds across 664 cancer cell lines, the PRISM data set from the
Cancer Dependency Map (https://depmap.org/portal/)12 with 4516 compounds across 578 cancer cell lines, and
the GDSC data set from the Genomics of Drug Sensitivity in Cancer (https://www.cancerrxgene.org/)13 with 396
compounds across 986 cell lines. Transcriptional and genomic profiles of cancer cell lines have been sequenced
and deposited in the CCLE (Cancer Cell Line Encyclopedia https://portals.broadinstitute.org/ccle)14 database
(921 cancer cell lines) and the COSMIC (Catalogue of Somatic Mutations in Cancer https://cancer.sanger.ac.
uk/cosmic) database15 (624 cancer cell lines). Genome-wide shRNA or CRISPR-cas9 knockdown experiments
have been performed and are hosted in the DepMap (Cancer Dependency Map, 18333 genes across 625 cancer
cell lines) and CERES (Sanger CRISPR data https://score.depmap.sanger.ac.uk/downloads) databases16 (17,799
genes across 318 cell lines).
To prepare these data sets for analysis, we performed multiple preprocessing steps. First, we limited the
analysis to cell lines that have drug sensitivity screening, transcriptional or genetic profiling, and shRNA or
CRISPR silencing data. All these filtering steps are necessary for building machine learning models to predict
transporter and drug interactions. Second, we focused our analysis on drugs that only have one or two primary
targets. This is to remove drugs with polypharmacological characteristics whose effects in cells could not be
recaptured by knocking down a single target. Third, for drugs with the same target, we expected that they share
similar sensitivity profiles across cancer cell lines. To test this, we computed their pairwise similarity scores
based on their sensitivities across cancer cell lines. As shown in Fig. 1, for different targets, similarities among
their drug sets have different distributions. Drugs with targets such as EGFR, ERBB2, MTOR, PARP2, AURKB,
MAP2K1 and PLK1 share more similar profiles, which indicates that the inhibition of these targets has specific
effects on the in vitro viability and proliferation of cancer cells. However, this is not true for other targets, e.g.,
HTR1B, TGFBR1, and ADORA2A, whose drugs do not share high similarity. Thus, we removed drugs that were
significantly different (correlation p < 0.05) from the other drugs sharing the same target. If a target had fewer
than three associated drugs, we also removed it from our analysis.
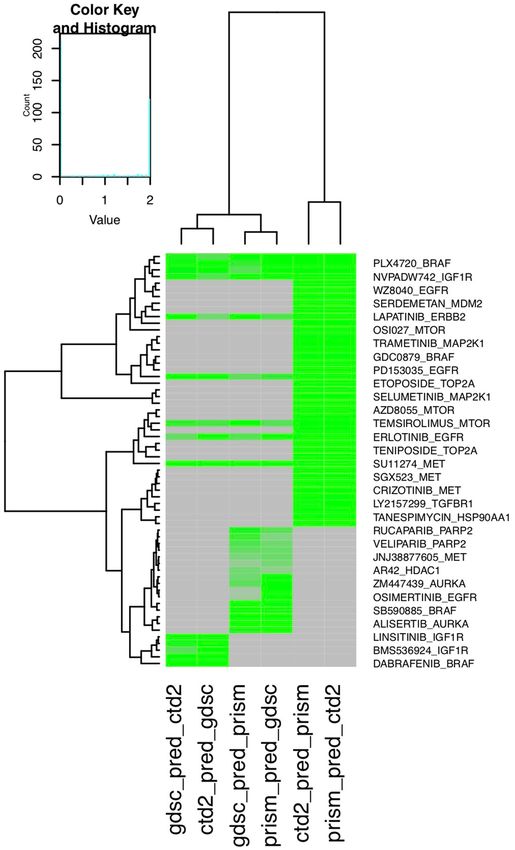
We expect that drug treatment should induce similar effects in cells as the silencing of its primary target. For
this, we calculated the correlation between the cell viabilities upon drug treatment and the silencing of its primary
target across the same cell lines. Some drug treatments and their target silencing showed strong correlations, such
as EGFR, ERBB2, IGF1R, MTOR, PLK1, BRAF, AURKB, CDK4, CDK6, and MDM2 inhibitors, which indicates
that they cause similar effects on cell proliferation and survival. However, the correlation was low for some other
drugs, such as ADORA2A, CHRM1, and IKBKB inhibitors (Fig. 2). The discrepancy may have been caused by
multiple factors, for example, off-target effects from the silencing experiments, the polypharmacological fea-
tures of drugs, no effects of these drugs on in vitro cell survival or proliferation, or noise in the data set. Thus,
we focused on drugs whose sensitivities had a significant correlation (p < 0.05) with the silencing of the target.
As a result, we obtained three cell line data sets with complete profiles of drug sensitivity, transcription or
genetics, as well as gene silencing viability. The CTD2 data set had a total of 79 unique drugs with sensitivities
across 351 cancer cell lines that involve 22 targets, such as EGFR, HDAC1, MTOR, MET, ERBB2, and BRAF.
The Prism data set had a total of 537 unique drugs with 69 targets and their sensitivities across 332 cell lines.
The targets with the highest number of drugs included EGFR, TOP2A, MTOR, MET, PPARG, and MAPK14.
The GDSC data set had a total of 47 unique drugs with ten targets, including EGFR, IGF1R, HDAC1, PARP2,
AURKA, and BRAF, as well as their sensitivities across 224 cancer cell lines. The complete list of potential drug
transporters was downloaded from the DrugBank database. Any genes that are labeled as transporters or carriers
for any drug in DrugBank were included in our models as predictive features.
Scientific Reports | (2021) 11:7400 | https://doi.org/10.1038/s41598-021-86921-9 2
Vol:.(1234567890)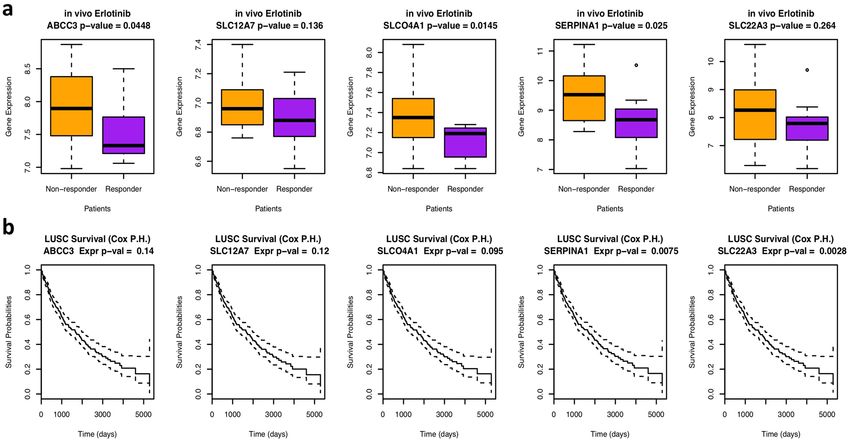
www.nature.com/scientificreports/

                                  Figure 1.  Boxplot of pairwise drug similarity scores targeting the same target in each data set. The similarity
                                  score is represented by the negative log10 p-value of the pairwise correlations computed based on their
                                  sensitivities across cancer cell lines.

                                  Lineage‑specific expression of transporter genes. To explore the lineage-specific expression of trans-
                                  porters, we generated a heatmap of cancer cell lines from the CCLE database based on the transcriptional pro-
                                  files of drug transporters. This includes 246 cell lines from eight lineages each with more than ten cell lines. As
                                  we expected, cell lines formed clusters of different lineages because of the lineage-specific expression patterns
                                  of the drug transporters (Supplementary Figure S1). Among the 262 transporters or carriers, only two of them
                                  (SLCO3A1 and SLC47A1) did not show lineage-specific distribution according to ANOVA (p-value > 0.05).
                                  ABCA5, ABCG2, MT1E, ABCA1, and CACNB1 also did not have strong lineage specificity. CALR, ABCG8,
                                  FTH1, SLC36A2, and SLC22A2 were among the most strongly differentially expressed in different lineages
                                  according to ANOVA (p-value < 2e−16). Among the eight lineages, transporters showed more different expres-
                                  sion patterns in lung and esophageal tissues than in other tissue types (Fig. 3).

                                  Construction of machine learning models to predict the difference between drug treatment
                                  and its target silencing caused by the overactivation of drug transporters. We hypothesized that
                                  the difference between the drug treatment and the silencing of its target was mainly caused by the overactivated
                                  drug transporters that transport drugs outside the cells, which reduces the drug concentrations in the cells and
                                  induces drug resistance. To test this hypothesis, we built biomarker models based on the transcriptional and
                                  genetic profiles of all potential transporters to predict the difference between the drug sensitivities and the sen-
                                  sitivities of the silencing of the primary target across cancer cell lines (i.e., DiffSen).
                                      For each drug within each data set, we randomly split the data into a 70% training set and a 30% testing set.
                                  Then, using the training set, we built models based on the transcriptional and genetic profiles of all potential
                                  transporters to predict DiffSen. For feature selection, we computed the correlation of each feature (i.e., the pre-
                                  dictive variables) with DiffSen (i.e., the target variable) and selected the top features with high correlation values
                                  to be used in the models. We trained multiple regression models, including Lasso, Ridge, and Random Forest,
                                  with a five-fold CV technique to select the best parameters for each model. Model performance was evaluated by
                                  computing the correlation between the predicted values and DiffSen (the ground truth data). The final predictions
                                  for the test set were obtained from the predictions using the model with the best performance in the training set.
                                      Among the 49 models built from the CTD2 data set, the predicted values had a significant correlation with
                                  DiffSen (i.e., the ground truth data, p-value < 0.05) in the testing set for 27 drugs. Eleven out of 33 models for the
                                  GDSC data set and 84 out of 171 models for the Prism data set successfully predicted the ground truth data in
                                  the testing set (correlation p-value < 0.05). The reason why the CTD2 and Prism data set had better performance

Scientific Reports |   (2021) 11:7400 |                https://doi.org/10.1038/s41598-021-86921-9                                                     3

                                                                                                                                                 Vol.:(0123456789)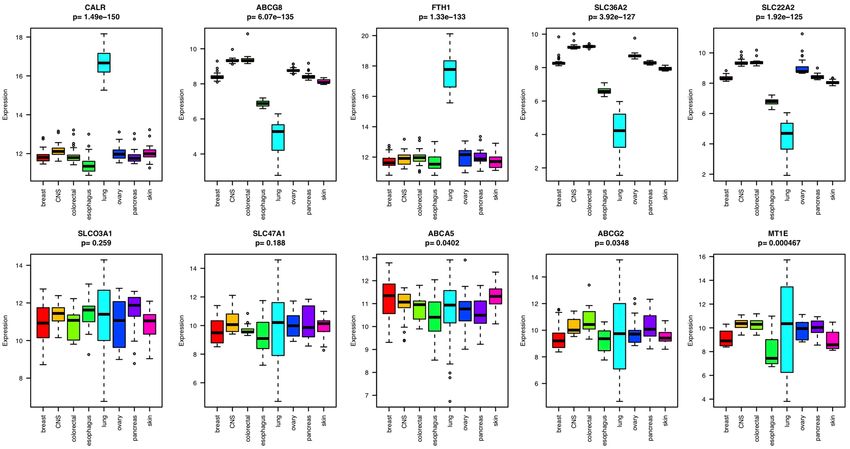
www.nature.com/scientificreports/

                                            Figure 2.  Strip charts of the correlation between cell viabilities upon drug treatment and the silencing of
                                            the primary target across the same cancer cell lines. The y-axis represents the negative log10 p-value of the
                                            correlation.

                                            Figure 3.  Boxplot of the gene expression of the ten transporters that showed the strongest or weakest lineage-
                                            specific distribution in eight different tissue types, each with more than ten cell lines.

          Scientific Reports |   (2021) 11:7400 |                https://doi.org/10.1038/s41598-021-86921-9                                                   4

Vol:.(1234567890)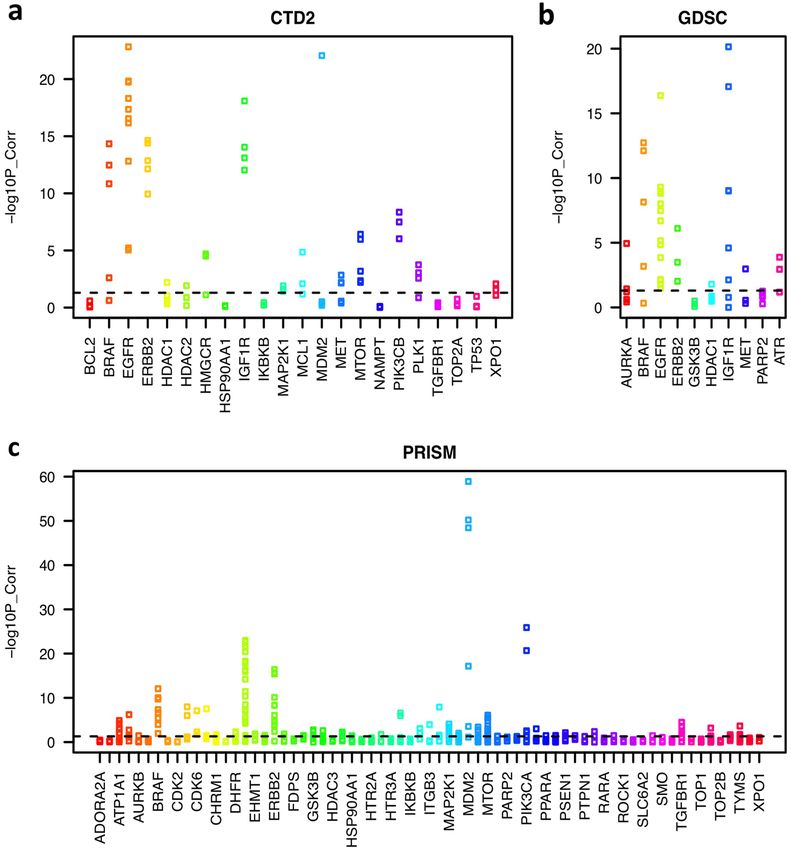
www.nature.com/scientificreports/

                                  Figure 4.  Heatmap showing model performance using one data set as the training set and another data set as
                                  the testing set. Model performance is represented by the negative log10 p-value of the correlation between the
                                  predictions versus the ground truth data. Gray indicates that the model is not available; i.e., the drug does not
                                  exist in either data set. Models with a more intense green colors have better performance.

                                  than the GDSC data set may be that the gene expression profiles of CTD2 and Prism were sequenced using the
                                  RNASeq platform, whereas the GDSC data set was obtained using microarrays to measure gene expression,
                                  which may be less accurate than using RNASeq data.
                                      Next, we tested whether the models built from one data set could also predict the DiffSen for the same drug
                                  in another data set. For example, we used the CTD2 data set as the training data to tune the parameters and
                                  build models. Then, we used the model with the best performance for the training set to make predictions for
                                  the testing set, i.e., the GDSC and the Prism data sets. Similarly, for each model, we selected the top features
                                  that had the highest positive correlation with DiffSen across the same cell lines in the CTD2 set. Overall, 47
                                  out of 78 models successfully predicted the ground truth data (correlation p-value < 0.05) when using one data
                                  set for training and another independent data set for testing (Fig. 4). These models included gefitinib, afatinib,
                                  lapatinib, and erlotinib targeting EGFR; linsitinib, BMS754807, and NVPADW742 targeting IGF1R; PLX4720
                                  and dabrafenib targeting BRAF; and temsirolimus targeting MTOR (Fig. 4).

                                  Enrichment of the predictive features in known transporters.                Among the models that successfully
                                  predicted the ground truth data in another data set, we expect that the predictive features used by the models
                                  are potential transporters that induce drug resistance. For this, we obtained transporters reported for drugs
                                  from the DrugBank database and tested whether the annotated transporters were enriched in the predictive
                                  features we selected. Thus, for each drug with successful models (p-value < 0.05 for the correlation between the

Scientific Reports |   (2021) 11:7400 |                https://doi.org/10.1038/s41598-021-86921-9                                                     5

                                                                                                                                               Vol.:(0123456789)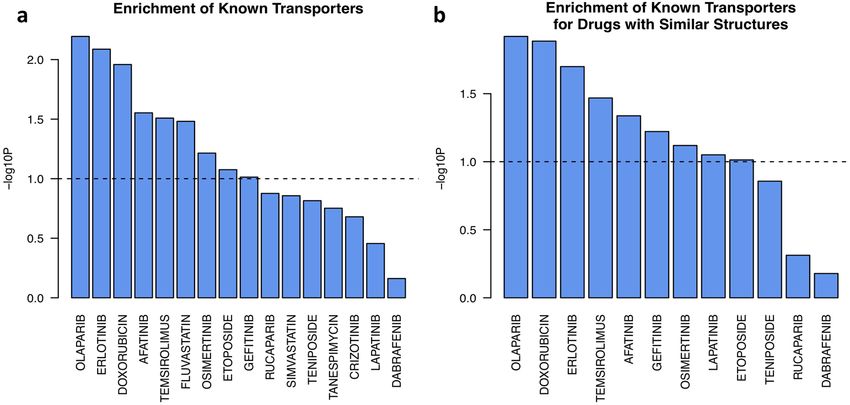
www.nature.com/scientificreports/
Figure 5. Enrichment of known transporters on the integrated list of all potential transporters sorted by their
correlation with DiffSen. The predictive features are integrated across data sets for successful models of (a) the
same drug, or (b) drugs with similar structures.
prediction and the ground truth data) in any of the three data sets, we first rank sorted all the features based on
their correlation with DiffSen and then integrated the rank lists across all models for the same drug by taking
the average. Then, we computed the enrichment of the reported transporters for the specific drug obtained from
DrugBank on the sorted list of all transporters. Among all 16 drugs with transporter information in DrugBank,
the annotated transporters for six of them were significantly enriched (p < 0.05) in the predictive features, and
three additional drugs had borderline significant enrichment (p < 0.1, Fig. 5).
Furthermore, we expected that drugs with similar structures would bind to similar transporters. To test this,
we integrated the predictive features of drugs with similar structures (Tanimoto coefficient based on 2D descrip-
tors > 0.35). There were a total of 12 drugs in the data sets whose structures were similar to those of some other
drugs, for which we integrated their predictive features. The known transporters for nine of them had significant
enrichment in the predictive features with a high positive correlation with DiffSen (p < 0.05, Fig. 5). Thus, for each
feature, we computed its overall importance score for every drug after integration with its structurally similar
drugs. This score implies its potential role as a transporter for the specific drug.
There were multiple features whose overexpression was strongly associated with the resistance of multiple
drugs, such as ABCC3, SLC4A4, ABCA1, SLC7A7, SLC22A3, POU5F1, SCNN1A, AKR1C3 and ABCG2. For
each of these potential transporter genes, we also calculated the enrichment of the top ten cell lines with the
highest or lowest expression on the list of cell lines sorted by the DiffSen of a drug-target pair. Supplementary
Figure S2 summarizes the enrichment analysis results for these features as well as their correlation with DiffSen
in individual data sets. Some of the potential novel interactions include lapatinib and gefitinib with ABCA1,
olaparib and NVPADW742 with ABCC3, and gefitinib and AZ628 with SLC4A4, where these transporters may
induce resistance to the corresponding drugs.
There were multiple EGFR inhibitors in our data set, including erlotinib, gefitinib, and afatinib, with highly
similar structures (Tanimoto coefficient > 0.35). For them, we integrated their predictive features and identified
the most common features, including ABCC3, SLC12A7, SLCO4A1, SERPINA1, and SLC22A3. Supplemen-
tary Figure S3 shows the correlation and the enrichment analysis of these five transporters with erlotinib in the
GDSC data set.
To test whether these five transporters are also potential transporters in cancer patients, we analyzed a pub-
licly available data set (GSE33072) for a clinical trial of erlotinib in lung cancer patients17. The patients were
classified into responders and nonresponders depending on whether their survival time was greater than eight
weeks. We performed Student’s t-test to compare the gene expression values between the responders and the
nonresponders and found that all five transporters had higher expression in the resistant patients than in the
sensitive patients (median expression value). Three of them were significantly overexpressed in the resistant
patients (p < 0.05, Fig. 6), which implies their potential role as erlotinib transporters that induce drug resistance
in patients. We also tested whether these five genes are related to lung cancer patient survival by analyzing the
TCGA lung cancer data set using the Cox proportional hazard model. Two of the genes displayed a significant
association with patient survival (p < 0.05), and one showed borderline significance (p < 0.1).
Discussion
There are a few data-driven studies examining the associations between transporters’ gene expression levels
and drug resistance across cancer cell lines. For example, a pioneering study analyzed the correlation of 48
ABC transporters expression levels with 1429 cancer drug sensitivities in the NCI60 cell line panel. It revealed
and experimentally validated specific transporters that confer drug r esistance9. Similar research has also been
performed on the SLO and SLC22 transporter families where the overexpression of SLC22A4 in cell lines were
Scientific Reports | (2021) 11:7400 | https://doi.org/10.1038/s41598-021-86921-9 6
Vol:.(1234567890)www.nature.com/scientificreports/
Figure 6. The expression values of the five potential transporters are different in the responsive vs. resistant
patients and can predict patient survival. (a) Boxplot showing the difference in the expression values of the
five potential transporters in the responsive vs. resistant patients in an erlotinib clinical trial (GSE33072).
The p-value was computed from Student’s t-test by comparing the gene expression in responders versus
nonresponders. (b) Cox proportional hazard survival analysis showing how expression values of different
genes affect patient survival in the TCGA lung cancer data set, with p-values illustrating the significance of the
analysis.
experimentally verified to rescue the sensitivity of mitoxantrone and d oxorubicin18. Another research group has
applied a LASSO regression model to predict drug resistance based on the transcriptional and genomic profiles
of transporters in cancer cells based on the GDSC drug sensitivity data set19. However, these studies have been
limited by the types of multi-omics data sets analyzed as well as the various machine learning models applied.
In this work, we successfully built multiple machine learning models based on the transcriptional and genetic
profiles of transporters to predict the difference between cell viabilities upon drug treatment and the silencing
of the target. Predictions from the testing set were significantly correlated with the ground truth data for more
than 50% of the models. For example, three out of the five known transporters and carriers of erlotinib, including
ABCB1, SLCO2B1, and ABCG2 are predicted among the top 10% of all potential transporters in our analysis. We
also identified for the first time the transporters that interact with multiple drugs, such as ABCC3, SLC4A4, and
ABCA1. More specifically, we identified ABCC3, SLC12A7, SLCO4A1, SERPINA1, and SLC22A3 as candidate
transporters for erlotinib. Three of these are also significantly overexpressed in cancer patients who are resistant
to therapy compared with sensitive patients. Some of these transporters have been reported to be associated
with the resistance to tyrosine kinase inhibitors (TKIs) or chemotherapy, e.g., SLC12A7 has been discovered to
be up-regulated in the TKI-resistant cell lines20, ABCC3 and SLCO4A1 have been shown as markers for chemo-
therapy outcome in lung cancer patients21–23, the differential expression of SERPINA1 has also been reported to
be associated with chemoresistance in human epithelial ovarian c ancer24.
There are several limitations of this study. First, when performing cross-data set analysis, we had to use
features that were profiled and shared in both data sets. This limited the features to mostly gene expression with
several genetic features. As a result, we might have missed mutations or copy-number variations in the trans-
porters that cause drug resistance. In addition, we expected that the overactivated transporters would transport
drugs outside the cells and thus reduce the drug concentrations in the cells. However, we built models mainly
based on the transcriptional profiles of the transporters. The expression levels of transporters do not always
correlate with the protein activities of the transporters due to the gene-wise differences in the transcriptional or
translational rates, post-translational modifications, protein stability and many other factors. However, large-scale
proteomics experiments that measure protein activities are often not available. Instead, computational methods,
e.g., the VIPER algorithm, which, when integrated with tumor regulatory or signaling networks, can accurately
infer context-specific protein activities in cancer c ells25. This suggests that to incorporate such virtually inferred
transporter protein activities in future analysis could potentially improve our models. Second, drug mechanisms
of resistance may be different among lineages. Thus, it may be helpful to build models that focus on cell lines
from the same tissue type for drugs with lineage-specific mechanisms. Third, we expected that the difference
between cell viabilities upon drug treatment and silencing of the target was due to drug transporters. Thus, our
approach would not work for drugs with polypharmacological effects, such as kinase inhibitors, whose effect
could not be captured by silencing an individual gene.
Scientific Reports | (2021) 11:7400 | https://doi.org/10.1038/s41598-021-86921-9 7
Vol.:(0123456789)www.nature.com/scientificreports/
Overall, this is the first time that various types of large-scale data sets, i.e., drug sensitivities, drug chemical
structures, cell line genetic and transcriptional profiles, and genome-wide gene silencing experiments, have been
systematically integrated to study transporter-induced drug resistance in cancer cells. We expect that these find-
ings will be of great value for understanding the drug resistance problem caused by transporters and help design
combination therapies to overcome drug resistance.
Materials and methods
Cell line data sets. We obtained drug sensitivity data sets from the Cancer Target Discovery and Develop-
ment Network (https://ctd2-dashboard.nci.nih.gov/dashboard/), the Cancer Dependency Map (https://depmap.
org/portal/), and the Genomics of Drug Sensitivity in Cancer (https://www.cancerrxgene.org/). We downloaded
cancer cell line transcriptional and genomic profiles from the Cancer Cell Line Encyclopedia (https://portals.
broadinstitute.org/ccle) and the Catalogue of Somatic Mutations in Cancer (https://cancer.sanger.ac.uk/cosmic).
We obtained genome-wide shRNA or CRISPR-cas9 knockdown data sets from the DepMap (https://depmap.
org/portal/) and the CERES databases (https://score.depmap.sanger.ac.uk/downloads).
Machine learning methods to build predictive models. We built various machine learning models,
including Random F orest26, Lasso Regression, and Ridge Regression m odels27, based on the transcriptional and
genetic profiles of the drug transporters to predict DiffSen. Random Forest is an ensemble learning method that
constructs a multitude of decision trees from randomly sampled subsets of training samples and makes predic-
tions by averaging or performing majority voting on the outputs of all trees. We tuned parameters to optimize
the classifiers based on the training set. There are two important parameters to which random forest models
are sensitive. One is the number of variables available to split in each node. The other is the number of trees to
grow. We performed a grid search to obtain the best parameters that minimized the out-of-bag error rate. We
used the randomForest package in R to perform this analysis. Lasso and Ridge regression are both regression
methods that apply regularization techniques to reduce the size of the coefficients and overcome overfitting.
The difference between Lasso and Ridge is that Lasso applies the L2 penalty while Ridge applies the L1 penalty
to the coefficients. The lambda parameter needs to be tuned for both types of models, and it was selected using
cv.glmnet in the glmnet package in R.
To obtain an unbiased estimate of classifier accuracy while controlling for overfitting, we performed five-fold
CV for model training. Five-fold CV is an iterative process that first randomly splits the training samples into
five equal folds, then builds models on four folds, and finally makes predictions on the one fold left out for test-
ing. This process is repeated five times, and hence, all training samples are tested after five iterations. For feature
selection, we selected the top features whose values had the highest positive correlation with the dependent
variable across cancer cell lines. Model performance was evaluated by computing the correlation between the
predicted values and the ground truth data.
Drug structure similarity calculation. We first downloaded the SMILES representation of the drug
structures from the DrugBank database (https://www.drugbank.ca/) or the PubChem database (https://pubch
em.ncbi.nlm.nih.gov/) for a total of 10,028 compounds and then converted it to the SDF format using the chem-
mineR package in R. Then, drug structure similarity was computed based on the SDF format using the same
package, which computes the Tanimoto coefficient based on the 2D descriptors.
Analyzing the in vivo erlotinib patient data set. We downloaded the Battle clinical trial data set
(GSE33072) from the GEO database, which contains the RNASeq profiles of the lung cancer patients prior to
erlotinib treatment with patient response data for a total of 131 patients. The raw RNASeq data were normalized
using DESeq2 software in R28,29. Student’s t-test was performed to compare gene expression levels in the resistant
patients versus the sensitive patients.
Survival analysis of the TCGA lung dataset. The lung cancer patient dataset was downloaded from the
TCGA database with annotations of whether the patient relapsed and their survival time for a total of 420 lung
cancer patient samples. For the transporter genes that we were interested in, we performed Cox proportional
hazard survival analysis to test whether the expression levels of these genes had any effect on patient survival.
Received: 19 September 2020; Accepted: 22 March 2021
References
1. Jiang, P., Sellers, W. R. & Liu, X. S. Big data approaches for modeling response and resistance to cancer drugs. Ann. Rev. Biomed.
Data Sci. 1, 1–27 (2018).
2. https://www.cancer.gov/tcga.
3. Housman, G. et al. Drug resistance in cancer: An overview. Cancers 6, 1769–1792 (2014).
4. Nikolaou, M., Pavlopoulou, A., Georgakilas, A. G. & Kyrodimos, E. The challenge of drug resistance in cancer treatment: A current
overview. Clin. Exp. Metas. 35, 309–318 (2018).
5. Tan, B., Piwnica-Worms, D. & Ratner, L. Multidrug resistance transporters and modulation. Curr. Opin. Oncol. 12, 450–458 (2000).
6. Choi, C. H. ABC transporters as multidrug resistance mechanisms and the development of chemosensitizers for their reversal.
Cancer Cell Int. 2, 2 (2005).
Scientific Reports | (2021) 11:7400 | https://doi.org/10.1038/s41598-021-86921-9 8
Vol:.(1234567890)www.nature.com/scientificreports/
7. Limtrakul, P., Chearwae, W., Shukla, S., Phisalphong, C. & Ambudkar, S. V. Modulation of function of three ABC drug transporters,
P-glycoprotein (ABCB1), mitoxantrone resistance protein (ABCG2) and multidrug resistance protein 1 (ABCC1) by tetrahydro-
curcumin, a major metabolite of curcumin. Mol. Cell. Biochem. 296, 85–95 (2007).
8. Jeong, H., Herskowitz, I., Kroetz, D. L. & Rine, J. Function-altering SNPs in the human multidrug transporter gene ABCB1 identi-
fied using a Saccharomyces-based assay. PLoS Genet. 3, e39 (2007).
9. Szakacs, G. et al. Predicting drug sensitivity and resistance: Profiling ABC transporter genes in cancer cells. Cancer Cell 6, 129–137
(2004).
10. Wishart, D. S. et al. DrugBank: A comprehensive resource for in silico drug discovery and exploration. Nucleic Acids Res. 34,
D668–D672 (2006).
11. Aksoy, B. A. et al. CTD2 Dashboard: A searchable web interface to connect validated results from the Cancer Target Discovery
and Development Network. Database (Oxford). 20, 17 (2017).
12. Tsherniak, A. et al. Defining a cancer dependency map. Cell 170(564–576), e16 (2017).
13. Yang, W. et al. Genomics of drug sensitivity in cancer (GDSC): A resource for therapeutic biomarker discovery in cancer cells.
Nucleic Acids Res. 41, D955–D961 (2013).
14. Ghandi, M. et al. Next-generation characterization of the cancer cell line encyclopedia. Nature 569, 503–508 (2019).
15. Tate, J. G. et al. COSMIC: The catalogue of somatic mutations in cancer. Nucleic Acids Res. 47, D941–D947 (2019).
16. DepMap at Sanger Institute. Project Score https://s core.d epmap.s anger.a c.u
k/, part of the Sanger Cancer Dependency Map. Sanger
DepMap Portal. Available at: https://depmap.sanger.ac.uk/. . 2019.
17. Byers, L. A. et al. An epithelial-mesenchymal transition gene signature predicts resistance to EGFR and PI3K inhibitors and identi-
fies Axl as a therapeutic target for overcoming EGFR inhibitor resistance. Clin. Cancer Res. 19, 279–290 (2013).
18. Okabe, M. et al. Profiling SLCO and SLC22 genes in the NCI-60 cancer cell lines to identify drug uptake transporters. Mol. Cancer
Ther. 7, 3081–3091 (2008).
19. Cesar-Razquin, A. et al. In silico prioritization of transporter-drug relationships from drug sensitivity screens. Front. Pharmacol.
9, 1011 (2018).
20. Kim, T. M. et al. Gene expression signatures associated with the in vitro resistance to two tyrosine kinase inhibitors, nilotinib and
imatinib. Blood Cancer J. 1, e32 (2011).
21. Muller, P. J. et al. Polymorphisms in ABCG2, ABCC3 and CNT1 genes and their possible impact on chemotherapy outcome of
lung cancer patients. Int. J. Cancer. 124, 1669–1674 (2009).
22. Zhao, Y. B. et al. ABCC3 as a marker for multidrug resistance in non-small cell lung cancer. Sci. Rep. 31, 20 (2013).
23. Wei, Y. et al. SLCO4A1-AS1 promotes cell growth and induces resistance in lung adenocarcinoma by modulating miR-4701-5p/
NFE2L1 axis to activate WNT pathway. Cancer Med. 9, 7205–7217 (2020).
24. Wu, W. et al. Identification of proteomic and metabolic signatures associated with chemoresistance of human epithelial ovarian
cancer. Int. J. Oncol. 49, 1651–1665 (2016).
25. Alvarez, M. J. et al. Functional characterization of somatic mutations in cancer using network-based inference of protein activity.
Nat. Genet. 48, 838–847 (2016).
26. Ho TK. Random Decision Forests. Proceedings of the 3rd International Conference on Document Analysis and Recognition, Montreal,
QC. 1995:278–282.
27. Tibshirani, R. Regression shrinkage and selection via the lasso. J. R. Stat. Soc .Ser. B Methodol. 58(1), 267–288 (1996).
28. Love, M. I., Huber, W. & Anders, S. Moderated estimation of fold change and dispersion for RNA-seq data with DESeq2. Genome
Biol. 15, 550 (2014).
29. R Core Team. R: A language and environment for statistical computing. R Foundation for Statistical Computing, Vienna, Austria.
2017.
Acknowledgements
This study was supported by the NJIT/LRI seed grants.
Author contributions
Z.Y. and Y.S. designed the study, performed the analysis and wrote the manuscript.
Competing interests
The authors declare no competing interests.
Additional information
Supplementary Information The online version contains supplementary material available at https://doi.org/
10.1038/s41598-021-86921-9.
Correspondence and requests for materials should be addressed to Y.S.
Reprints and permissions information is available at www.nature.com/reprints.
Publisher’s note Springer Nature remains neutral with regard to jurisdictional claims in published maps and
institutional affiliations.
Open Access This article is licensed under a Creative Commons Attribution 4.0 International
License, which permits use, sharing, adaptation, distribution and reproduction in any medium or
format, as long as you give appropriate credit to the original author(s) and the source, provide a link to the
Creative Commons licence, and indicate if changes were made. The images or other third party material in this
article are included in the article’s Creative Commons licence, unless indicated otherwise in a credit line to the
material. If material is not included in the article’s Creative Commons licence and your intended use is not
permitted by statutory regulation or exceeds the permitted use, you will need to obtain permission directly from
the copyright holder. To view a copy of this licence, visit http://creativecommons.org/licenses/by/4.0/.
© The Author(s) 2021
Scientific Reports | (2021) 11:7400 | https://doi.org/10.1038/s41598-021-86921-9 9
Vol.:(0123456789)You can also read