Predicting lung cancer survivability: A machine learning regression model - International Academy of ...
←
→
Page content transcription
If your browser does not render page correctly, please read the page content below
Network Biology, 2021, 11(2): 68-81 Article Predicting lung cancer survivability: A machine learning regression model Iffat Jabin, Mohammad Motiur Rahman Department of Computer Science and Engineering (CSE), Mawlana Bhashani Science and Technology University (MBSTU), Santosh, Tangail-1902, Bangladesh Email: iffat.jabin02@gmail.com, mm73rahman@gmail.com Received 23 December 2020; Accepted 30 January 2021; Published 1 June 2021 Abstract Lung cancer is one of the main leading causes of cancer death in all over the world. Accurate prediction of lung cancer survivability can enable physicians to make more reliable decisions about a patient’s treatment. The objective of this research is to design robust machine learning model with supervised regression model to predict survivability of the lung cancer patients. This work includes Multiple Linear Regression, Support Vector Regression with Radial Function, Random Forest, Extreme Gradient Boosting Tree regression algorithms to build an ensemble model using stacking technology with meta-learner Gradient Boosting Machine. This experiment is performed on large SEER 2011-2017 dataset. The novel model achieved a high root mean squared error (RMSE) value of 8.58459 on the test dataset which outperforms the base models. The experimentation results show that the proposed system attains better result compared to the existing models. Keywords lung cancer; regression; stacking technology; ensemble; Extreme Gradient Boosting Tree. Network Biology ISSN 22208879 URL: http://www.iaees.org/publications/journals/nb/onlineversion.asp RSS: http://www.iaees.org/publications/journals/nb/rss.xml Email: networkbiology@iaees.org EditorinChief: WenJun Zhang Publisher: International Academy of Ecology and Environmental Sciences 1 Introduction Lung cancer happens when cells in the lung grow without order and cluster together to form tumor. Lung cancer is the second most common cancer, accounting for about one out of five malignancies in men and one out of nine in women (SEER Training, 2020). It is also the dominant cause of cancer death among men and second primary cause of cancer death among women worldwide (Zhang, 2018). According to the World Health Organization (WHO), it is responsible for approximately 2.09 million new diagnoses each year and about 1.76 million death cases (Cure Today, 2019). It is estimated that the number of incident cases in 2020 for lung cancer will be 2.21 million (Cancer Tomorrow, 2020). Estimating the survivability of lung cancer patients can help to develop better treatments and quality of life for patients. Lung cancer survivability prediction is a challenging research task. Researchers apply machine learning techniques for predicting the IAEES www.iaees.org
Network Biology, 2021, 11(2): 68-81                                    69

survivability so that doctors can work better in diagnosing.
    Machine learning allows the system to learn and make predictions based on some experience which is
data in terms of the system. Machine learning techniques are used in constructing an accurate predictive
model for survival of patients diagnosed with lung cancer. In most cases, cancer patient survival models are
classification models. But regression models can be more useful for this application as the output time
continues.
    Ensemble method is one of the most important approaches for improving the performance of single
methods. An ensemble of regression algorithms is a combination of various regression models, where the
decisions of every single regressor are combined. In stacking ensemble, the outputs of different unrelated
models are collected as input for the meta-level learner.
    This study employs a stacking ensemble model of different regression algorithms for analyzing the lung
cancer data obtained from the Surveillance, Epidemiology, and End Results (SEER) program of the National
Cancer Institute (NCI) (NCI_SEER_Training, 2020; NCI_SEER_Overview, 2020) and predict the survival
time in months.
    Machine learning is not a new thing in the survivability predictions. Several methods were proposed to
predict the survivability of a patient. SVM and logistic regression were used to analyze a lung cancer dataset
from the SEER database for prediction (Fradkin, 2006). SVM as a classification algorithm and fuzzy
clustering as a segmentation technique is used in Sivakumar et al. (2013). Ensemble clustering-based
approach was also used on SEER data (Chen et al., 2009). Pradeep et al. (2018) had used SVM with linear
kernel, C4.5, Naïve Bayes for classification of lung cancer dataset between two class “Less Survivability”
and “more Survivability”. In Fenwa et al. (2015), SVM and ANN were used for classification of lung cancer.
    Lynch et al. (2017) used supervised machine learning classification techniques such as linear regression,
Decision Trees, Random Forest, GBM, SVM using polynomial kernel function and a custom ensemble
method for the lung cancer survival prediction (Lynch et al., 2017).
    Lung cancer patient survivability was predicted using SVM and logistic regression in Hazra et al. (2017).
A Random Forest-Based Decision tree was proposed to give the best prediction result between Random
Forest and Decision Tree for the survivability of lung cancer patients by Zakaria and Rabia (2018). Lynch et
al. (2017) used unsupervised analysis techniques to lung cancer data for prediction of survivability where
Self-Ordering Maps shows the best performance and revealed comparable result to supervised techniques.
    A model was developed in Chen (2014) to predict the survivability of non-small cell lung cancer patients
by using artificial neural network with gene expression. An ensemble of five Decision Trees classification
models was developed in Agrawal et al. (2011, 2012). The analyses of lung cancer dataset from SEER
database using classification techniques (Ramalingam et al., 1998; Owonikoko et al., 2007; Bhaskarla et al.,
2010; Hayat et al., 2007; Thun et al., 2008; Fu et al., 2005; Wu et al., 2004; Wang et al., 2007) and statistical
techniques (Skrypnyk, 2012; Agrawal and Choudhary, 2011; Kapadia et al., 2012) were made in past studies.
    It could be seen that several studies had been conducted to analyze lung cancer survivability through
machine learning. But the majority of studies considered whether the patients were alive or not after 5 years
since the first diagnosis as having survived the cancer using the classification techniques. This proposed
method focused on using various machine learning regression algorithms to predict lung cancer patient
survivability using a two-phase stack ensemble model. The major contribution of the proposed work is
defined below:
    -Perform supervised regression algorithms to predict the survivability on SEER dataset and measure
performance.
    - Develop an ensemble model using stacking technology for the prediction.

 IAEES                                                                                              www.iaees.org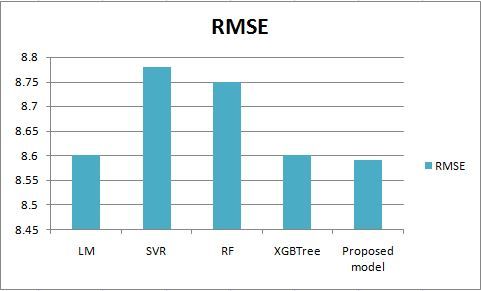
70                                      Network Biology, 2021, 11(2): 68-81

    The paper is organized as follows: Section 2 describes proposed ensemble model with dataset, system
architecture, system algorithm. Section 3 shows the experimental results, achieved outcomes and discusses
results with previous works. The work is finally concluded in Section 4.

2 Material and Methods
The machine learning technique to predict the survivability of lung cancer patients is represented in this
section. Base models were used to train using the training dataset and combine them using stacking
technology. 5- folds cross-validation was used for the training of each model. Each base model was fitted in
4-folds and predictions were made on the 5th fold of the training dataset. The base model was then fitted on
the whole training dataset and then the performance was measured using RMSE value. The initial comparison
was held and topmost base models were selected based on RMSE. The predicted result of the topmost base
learners was used as the input and the test dataset was used as the output for the meta-level learner. The final
output on test dataset was predicted using the stack ensemble technique.
    In this method, there are two phases; in phase (1) six different base models were trained using the training
dataset, and in phase (2) the topmost base models output on training dataset were used as the input for the
high-level model. The workflow of the proposed work is given in Fig. 1 and the pseudo code of the proposed
method is shown as follows.

                                        Fig. 1 Diagram of proposed method.

 IAEES                                                                                             www.iaees.org
Network Biology, 2021, 11(2): 68-81 71
INPUT:
L = Dataset
S = {S1, S2, …………, Sl}, A set of learning algorithms
Smeta = Meta Algorithm
J = number of cross validation
Level 1 Regression (L, Sm)
L1 = the dataset for the Level 2 regression
Output: Of = the final output
Step 1: Split the dataset into training set, x and test set, y.
Step 2: Randomly split the training set x into J almost equal size subsets {x1, x2,…….xJ}
Step 3: Train subsets with the base models
for j= 1 to J do
for k= 1 to l do
Mk(-j) = Sk (x(-j))
End for
End for
Step 4 : Predict on training set x and compare
for j=1 to J do
for each xj
for k = 1 to l do
Zkn= Prediction of the model Mk(-j) on xj
If (Zkn) meets the criteria
L1 = (Zkn, y)
End for
End for
End for
End Level 1 Regression
Step 5: Train the selected base models output with meta-learner and create ensemble model
H(x) = Smeta(L1)
Step 6: Predict the ensemble model on the test set
Of = prediction of the model H(x) on test dataset y
Return Of
The whole experiment was performed on a Personal Computer (PC) of 64-bit Microsoft Windows 10
Professional. The PC configuration is 32 GB DDR4 RAM with 3900X (12 core Processor) of 4.6 GHZ.
RStudio 3.6.0 has been used to conduct the full experiments. RX 580 8 GB GDDR5 GPU has been used for
faster processing.
2.1 Dataset
The lung cancer dataset was collected from the Surveillance, Epidemiology and End Results (SEER). Data
from years 2011 to 2017 was used in this paper. There are about 155497 records with a diagnosis of lung or
bronchus.
We had first used a set of inclusions to select the data from SEER for further analysis. Only patients with
age 30-79 were selected for further processing. Cases were included when the survival time is known.
Attributes that are not directly related to that cancer are not considered. The attributes that vary too much or
IAEES www.iaees.org72 Network Biology, 2021, 11(2): 68-81
too little were filtered.
We had also analyzed the data with ANOVA to select the relevant features for this method. There were
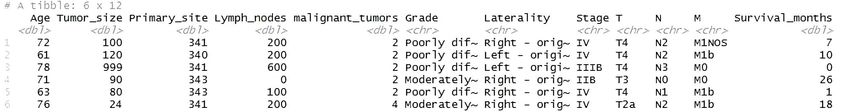
15,440 cases and major 12 attributes including the survival months were selected for further analysis. Fig. 2
depicts the tibble of the dataset. In the selected features, some of the features are categorical and some are
numerical. Table 1 gives the details of categorical features and Table 2 gives the numeric features selected.
Fig. 2 Dataset.
Table 1 Discrete variables.
Variable Name Number of distinct value
Grade 4
Laterality 6
Stage 9
T 9
N 4
M 4
Table 2 Numerical variables.
Variable Name Range
Age 30-79
Tumor_size 0-200
Primary_site 340-349
Lymph_nodes 0-800
No. of malignant tumors 1-8
Survival_months 0-36
2.2 Data analysis and preprocessing
Exploratory data analysis was performed like checking the dataset, data types, row names, column names,
summary of the attributes, correlation between the attributes, checking the target variable(survival months)
etc.
The categorical data were converted into factor for better performance. The noisy, uninformative,
duplicated data were removed from the data. The unknown data are also removed from the dataset. The
outliers were also removed. The range of survival months is 0 to 36 months, which is 3 years. Fig. 3 presents
the frequency of the survival months of the dataset.
IAEES www.iaees.orgNetwork Biology, 2021, 11(2): 68-81 73
Fig. 3 Frequency of survival months.
Random sampling was used to split the dataset of 11841 data into 75% for training set and 25% for test
set. To make the regression model to learn, training set is used and the test set is used to predict the output
using the trained model.
2.3 Models used
In phase (1), Multiple Linear Regression, Support Vector Regression with Radial Function, Random Forest
Regression, Extreme Gradient Boosting Tree, Decision, Neural Network model were used as base learner and
according to the RMSE value finally multiple linear regression, SVR, RF, XGBTree were selected for phase
(2). This section gives the brief descriptions of the machine learning models used for the survivability
prediction of lung cancer patients.
2.3.1 Multiple Linear Regression
Multiple Linear Regression is used to create a best fit line, which will be able to predict the dependent value.
The best fit line will be selected where the residual errors are minimal by using the cost function. In Multiple
Linear Regression, there is many to one relationship. One dependent variable and two or more independent
variables are used to explain the variation or predict the value of the dependent variable. The equation of
Multiple Linear Regression is
y = a0 + x1 a1 + x2a2+……
here, y is the dependent variable,
a0 is the intercept,
x1, x2…. are the independent variable,
a1, a2….. are the coefficients.
2.3.2 Support Vector Regression (SVR)
IAEES www.iaees.org74 Network Biology, 2021, 11(2): 68-81 SVR is a machine learning model which is used to apply in regression problems that is continues output. To tackle non-linear regression support vector machine is effective. The SVR maps, nonlinearly, the original information into a higher dimensional component space (Georey et al., 2015). It tries to fit the best line within predefined error boundary. It classifies all the prediction line in two categories, whether the lines pass the error boundary or not. It uses a mathematical function to expand the dimensions of the sample, which is known as kernel function. 2.3.3 Random Forest Regression Random Forest Regression is a bagging technique, which uses decision tree as the base model with different parts of a dataset. It trains every tree with random samples from the main dataset using row sampling and feature sampling with replacement. All the decision trees give continuous value and then aggregates these results using either the mean of all the outputs or the median of the outputs is used. Basically multiple decision trees are used in random forest and each of them has high variance. But when these decision trees are combined the high variance converts into low variance. 2.3.4 Extreme Gradient Boosting Tree Extreme Gradient Boosting Tree has high predictive power and highly effective for large complicated datasets. It uses variety of regularization techniques to reduce overfitting. It starts out as a single leaf and builds trees using the average of two observations as threshold. Every time it calculates the similarity score using regularization parameter and gain to check which threshold is better in splitting. The tree complexity parameter gamma is used to prune and then calculate the output value using the learning rate parameter for the remaining trees. XGBoost tree optimizes different models through parallel processing and handles missing values. 2.3.5 Decision Tree Decision Tree algorithm is suited very well in regression problems. It builds a tree in which root node and the sub node are attributes of the dataset and the leaf nodes contains the target results. It splits the dataset into subsets such that each contains homogeneous data until the leaf nodes are find. The tree predicts the target value according to the answers of the question it ask to move from one node to another. 2.3.6 Neural Network Neural Network is the supervised machine learning algorithm which assign every input values to an output based on the prediction. The processing in a neural network occurs when an input value passes through a series of batches of activation units which are known as layers (Zhang, 2010; Georey et al., 2015; Hatem et al., 2018). The one layer of activation units use the previous unit as input and it also performs as the output for the next unit until the final prediction is achieved. 2.3.7 Ensemble Model Ensemble Model is the technique of combining the predictions from multiple different machine learning algorithms to improve overall performance. Ensemble with stacking technology used to train the particular dataset with multiple models and the output of these models are used as the input of a meta-learner to predict the dependent variable. Gradient Boosting Machine is used as the meta-learner as it is a powerful model for prediction. 3 Results and Discussion In this section, we discuss the result obtained from the proposed model and analyze the accuracy level and performance of the proposed model. 3.1 Performance evaluation parameters The proposed method is compared with other models with different metrics. Table 3 describes the metrics IAEES www.iaees.org
Network Biology, 2021, 11(2): 68-81 75
which are used to evaluate the performance.
Table 3 Performance metrics.
Evaluation Parameter Description Formula
RMSE It measures the error between the
actual dataset and predicted dataset.
R-squared Represents the proportion of the
variance for a dependent variable
R2=
that's explained by independent
variables
Cross Validation (CV) is used to measure the effectiveness of a model (Zhang, 2010). In this 5-fold
cross validation technique is used, that is the dataset is randomly split into 5-folds. One-fold acts as the test
set and other 4-folds act as the training set.
3.2 Proposed model implementation and evaluation
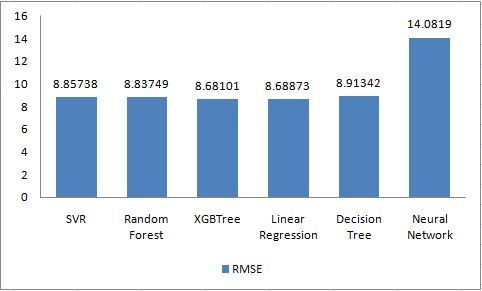
Six models were trained with the training dataset in phase-1 and their RMSE value was calculated. Table 4
depicts the RMSE values of the six models after training. The top models were selected according to their
RMSE values as RMSE helps to indicate the quality of prediction. XGBTree has the lowest RMSE which is
8.68101 and linear regression is the second-best model. The smaller the RMSE, the better the model is. Fig. 4
shows the comparison of various algorithms according to their RMSE. So, the models which have lower
RMSE are selected for the second phase.
Table 4 RMSE values of the algorithms with training dataset.
Models RMSE
SVR 8.85738
Random Forest 8.83749
XGBTree 8.68101
Linear Regression 8.68873
Decision Tree 8.91342
Neural Network 14.0819
From the Table 4, Support Vector Regression, Random Forest Regression, Linear Regression and
Extreme Gradient Boosting Tree have been selected and combined using the stacking technology to generate
ensemble model for better prediction.
IAEES www.iaees.org76 Network Biology, 2021, 11(2): 68-81
Fig. 4 Comparison of various regression algorithms on basis of RMSE.
The output of the base models i.e. linear regression, support vector machine with radial function, random
forest regression and extreme gradient boosting tree were used as the input for the meta-learner to create the
ensemble model. For stacking the models gradient boosting machine was used as the meta-regressor. This
study builds 3 types of ensemble model using the selected base models to get the best predictive ensemble
model and work on the test dataset. Table 5 shows the comparative performance of each of the models for the
5-folds cross validation with the RMSE value.
Table 5 Comparative performance of different ensemble models in 5-folds cross validation.
Folds Models
LR+ SVR+ RF+
LR + SVR LR + SVR+ RF
XGBTREE
Fold 1 8.67257 8.68374 8.66089
Fold 2 8.67040 8.71205 8.70357
Fold 3 8.68717 8.66863 8.65620
Fold 4 8.70307 8.66755 8.66919
Fold 5 8.72441 8.69391 8.68605
The lowest RMSE value is selected as the best result. Table 5 shows that, LR + SVR + RF + XGBRTREE
is the final model for prediction as it achieves the lowest RMSE value with 8.65620 in fold 3. Table 6
presents the overall performance of the proposed model on the test dataset.
Table 6 Performance of proposed models on test set.
Model LR+ SVR LR + SVR + RF LR + SVR + RF +
XGBTREE
RMSE 8.605 8.598 8.58459
IAEES www.iaees.orgNetwork Biology, 2021, 11(2): 68-81 77
The result revealed that the ensemble model of the four models performed better. The final ensemble
model is also better than the base models. Table 7 shows the comparison among the base models and
proposed model. Each of the models was used to make prediction on test dataset.
Table 7 Comparison of the proposed model with base models.
Models R-squared RMSE Mean Survival
LM 0.25052 8.59 11.26
SVM 0.23408 8.78 9.53
RF 0.23493 8.75 11.28
XGBTree 0.249014 8.60 11.29
Proposed Model 0.250515 8.58 11.3
This table proves that the proposed model performs better and its mean survival months are same as the
actual dataset. Fig. 5 depicts the performance comparison among the base models and the proposed model on
evaluation metrics RMSE.
Fig. 5 Comparison of various algorithms on the basis of RMSE.
We tried to predict the survivability of the training dataset with the proposed model as well as the test
dataset. Table 8 shows the statistical comparison of the predicted months with the training dataset and test
dataset.
Table 8 Statistical comparison between the proposed model and actual dataset survivability.
Prediction on Training Prediction on Test
Training Dataset Test Dataset
Dataset Dataset
Mean Survival 11.3 11.36 11.3 11.3
Standard Deviation
9.5641 4.13207 9.54638 4.15734
IAEES www.iaees.org78 Network Biology, 2021, 11(2): 68-81
Table 8 shows that the mean survival time for both the training dataset and test dataset are 11.36 and 11.3
which are same as the actual survival months. The RMSE of the proposed model is a little bit lower than the
sd of the both training set and test set. Fig. 6 presents the scatter plot of the actual survival months and
proposed ensemble models survival month correlations.
From the figure it can visible that, there is a positive partial relationship between these survival months.
In Fig. 6 it can be seen that the actual survival months is around 0 to 36, where the proposed model predicts
in a range of 0 to 25 months approximately. The survival months 0 to 25 in the actual dataset has the highest
frequency, it can be a reason that our model can predict around 25 months.
An ensemble model with regression algorithms is proposed in this study which predicts the survivability
(months) of the lung cancer patients. The collected data are analyzed and relevant features are selected for
further processing. The training set is used as the input for training each model and the performance of each
of the base models are calculated. The best 4 model’s outputs were selected as input to ensemble using
stacking method.
Fig. 6 Scatter plot of actual and proposed predicted ensemble.
The proposed ensemble model performs better than the base models in predicting the test dataset
survivability. The model is compared with some other regression algorithms such as Gradient Boosting
Machine, Extreme Gradient Boosting Linear, Principal Component Regression and K-Nearest Neighbor
which are applied on the same dataset and Table 9 presents the comparison result according to the RMS
value.
Table 9 proves that the proposed model gives much better performance than the regression algorithms.
This works is also compared with some existing work. Table 10 shows the comparison among proposed
method and existing works which had been used regression techniques for prediction.
IAEES www.iaees.orgNetwork Biology, 2021, 11(2): 68-81 79
Table 9 Performance comparisons of single regression algorithms and proposed model.
Model Name RMSE
XGBLinear 8.924
Gradient Boosting Machine 8.59
Principal Component Analysis 8.76
K-Nearest Neighbor 8.954
Proposed Ensemble Model 8.58459
Table 10 Comparison of RMSE with previous studies.
No. of
Studies Algorithm Evaluation Metrics
Attributes
(Lynch et al., 18 Used GBM, LR, RF, DT, SVM and RMSE= 15.32
2017) their weighted ensemble algorithm.
(Bartholomai and 13 Used RF for classify the dataset RMSE= 10.52
Frieboes, 2018) into three classes & LR, GBM, RF
and their ensemble model for
regression.
Proposed 12 Ensemble of MLR, SVR, RF, RMSE= 8.58459
Method XGBTree using stacking
technology with meta-learner
GBM.
Lynch et al. (2017) proposed an ensemble model using linear regression, support vector machine, random
forest, decision tree and gradient boosting machine and these models weighted ensemble model. The most
accurate model was GBM with RMSE value 15.32 and the predicted months are ~30, where actual survival
months are ~72. JA Bartholomai and HB Frieboes divided the dataset into three classes on survival months
(0-6, 7-24 and >24 months) using random forest classification algorithm. Then they predicted survivability
using LR, GBM, RF regression algorithm and their ensemble model for each class (Bartholomai and Frieboes,
2018). This work gained 10.52 RMSE for the class 0-6 months, RMSE 15.65 for 7-24 months class and
RMSE 20.51 for >24 months. Our proposed model used dataset of survival months 0- 35 and it can predict
~25 months with RMSE 8.58459. From the result above, our proposed model can perform better in terms of
lung cancer survivability prediction. The proposed approach was a 2-level ensemble model and the proposed
model had better accuracy compared to not only the base models but also some single regression algorithms
and existing works.
4 Conclusion
In this paper, we used a combination of Multiple Linear Regression, Support Vector Machine, Random Forest
And Extreme Gradient Boosting Tree algorithms with stacking technology for constructing a lung cancer
survivability prediction model. We illustrated the effectiveness of the proposed method using 5-fold cross
validation, R-squared and RMSE. This study aims to build a regression model which can predict lung cancer
patients survivability more accurately with reduced the RMSE value. Although the results showed that this
IAEES www.iaees.org80 Network Biology, 2021, 11(2): 68-81
method improved a little bit compared with the base models and the previous works, it has been shown the
improvement of the models for further developing suitable models.
As for further work, we plan to investigate the survivability of different lung cancer patients for long term
survival months with regression algorithm. Also analyzing the combination of different classifiers with
gradient boosting-based classifiers ensemble would be of interest.
Acknowledgment
The authors are grateful to the participants who contributed to this research.
References
Agrawal A, Misra S, Narayanan R, et al. 2011. A lung cancer outcome calculator using ensemble data mining
on SEER data. In: Proceedings of the Tenth International Workshop on Data Mining in Bioinformatics,
ACM
Agrawal A, Choudhary A. 2011. Association rule mining based hotspot analysis on SEER lung cancer data.
International Journal of Knowledge Discovery in Bioinformatics, 2: 34-54
Agrawal A, Misra S, Narayanan R, et al. 2012. Lung cancer survival prediction using ensemble data mining on
SEER data. Scientific Programming, 20: 29-42
Bartholomai JA, Frieboes HB. 2018. Lung cancer survival prediction via machine learning regression,
classification, and statistical techniques. Proceedings of the IEEE International Symposium on Signal
Processing Inf Tech, 632-637
Bhaskarla A, Tang PC, Mashtare T, et al. 2010. Analysis of second primary lung cancers in the SEER database.
Journal of Surgical Research, 162: 1-6
Cancer Tomorrow. 2020. https://gco.iarc.fr/tomorrow/graphic isotype?type=0&type_sex=0&mode=
population&sex=0&populations=900&cancers=15&age_group=value&apc_male=0&apc_female=0&singl
e_unit=500000&print=0. Accessed on April 24, 2020
Chen D, Xing K, Henson D, et al. 2009. Developing prognostic systems of cancer patients by ensemble
clustering. Journal of Biomedicine and Biotechnology, 632786: 1-7
Chen YC, Ke WC, Chiu HW, 2014. Risk classification of cancer survival using ANN with gene expression
data from multiple laboratories. Computers in Biology and Medicine, 48: 1-7
Cure Today. 2020. https://www.curetoday.com/articles/world-lung-cancer-day-2019-facts--figures. Accessed
on: June 1, 2020
Fenwa ODA. Ajala,F, Adigun A. 2015. Classification of cancer of the lungs using SVM and ANN.
International Journal of Computers and Technology, 15(1): 6418-6426
Fradkin D. 2006. Machine learning methods in the analysis of lung cancer survival data. DIMACS Technical
Report 2005–35
Fu JB, Kau TY, Severson RK, Kalemkerian GP. 2005. Lung cancer in women: Analysis of the National
Surveillance, Epidemiology, and End Results Database. CHEST Journal, 127: 768-777
Georey H, Vinyals O, Dean J. 2015. Distilling the knowledge in a neural network. arXiv, 1504.01942
Hazra A, Bera N, Mandal A. 2017. Predicting lung cancer survivability using SVM and logistic regression
algorithms. International Journal of Computer Applications, 174(2): 19-24
Hayat MJ, Howlader N, Reichman ME, Edwards BK. 2007. Cancer statistics, trends, and multiple primary
cancer analyses from the Surveillance, Epidemiology, and End Results (SEER) Program. The Oncologist,
IAEES www.iaees.orgNetwork Biology, 2021, 11(2): 68-81 81
12: 20-37
Hatem MN, Sarhan SS, Rashwan MAA. 2018. Enhancing recurrent neural network-based language models by
word tokenization. Human-centric Computing and Information Sciences, 8: 12
Introduction to Lung Cancer | SEER training. https://training.seer.cancer.gov/lung/intro/. Access on Aug 24,
2020
Kapadia N, Vigneau F, Quarshie W, Schwartz A, Kong F, 2012. Patterns of practice and outcomes for stage I
Non-small Cell Lung Cancer (NSCLC): Analysis of SEER-17 data, 1999–2008. International Journal of
Radiation Oncology, Biology, Physics, 84(3): S545
Kaur M, Dhalaria M, Sharma PK, Park JH. 2019. Supervised machine-learning predictive analytics for
national quality of life scoring. Applied Sciences, 9(8): 1613
Lynch Chip M, et al. 2017a. Prediction of lung cancer patient survival via supervised machine learning
classification techniques. International Journal of Medical Informatics, 108: 1-8
Lynch Chip M, van Berkel Victor H, Frieboes Hermann B. 2017b. Application of unsupervised analysis
techniques to lung cancer patient data. PLOS ONE, 12(9): e0184370.
NCI_SEER_Training_Lung_Cancer_Stats. 2020. Introduction to Lung Cancer: SEER training modulesÐ
National Cancer Institute. http://training.seer.cancer.gov/lung/. Accessed on: April 24, 2020
NCI_SEER_Overview. 2020. Overview of the SEER program. Surveillance Epidemiology and End Results
[2015]. Available at: http://seer.cancer.gov/about/. Access on: April 24 2020
Owonikoko TK, Ragin CC, Belani CP, et al. 2007. Lung cancer in elderly patients: an analysis of the
Surveillance, Epidemiology, and End Results database. Journal of Clinical Oncology, 25: 5570-5577
Pradeep KR, Naveen NC. 2018. Lung cancer survivability prediction based on performance using
classification techniques of support vector machines, C4. 5 and Naive Bayes algorithms for healthcare
analytics. Procedia Computer Science, 132: 412-420
Ramalingam S, Pawlish K, Gadgeel S, et al. 1998. Lung cancer in young patients: analysis of a Surveillance,
Epidemiology, and End Results database. Journal of Clinical Oncology, 16: 651-657
Sivakumar S, Chandraseka C. 2013. Lung nodule detection using fuzzy clustering and support vector machines.
International Journal of Engineering and Technology, 5(1): 179-185
Skrypnyk I. 2012. Finding Survival Groups in SEER Lung Cancer Data. 11th International Conference on
Machine Learning and Applications.
Thun MJ, Hannan LM, Adams-Campbell LL, et al. 2008. Lung cancer occurrence in never-smokers: an
analysis of 13 cohorts and 22 cancer registry studies. PLOS Medicine, 5: e185
Wang SJ, Fuller CD, Emery RR, Thomas CR Jr. 2007. Conditional survival in rectal cancer: a SEER database
analysis. Gastrointestinal Cancer Research, 1: 84
Wu X, Chen VW, Martin J, et al. 2004. Subsite-specific colorectal cancer incidence rates and stage
distributions among Asians and Pacific Islanders in the United States, 1995 to 1999. Cancer Epidemiology,
Biomarkers & Prevention: A Publication of the American Association for Cancer Research, 13(7):
1215-1222
Zakarie H, Rabia A. 2018. Lung Cancer Survival Prediction Using Random Forest Based Decision Tree
Algorithms. Proceedings of the International Conference on Industrial Engineering and Operations
Management. Washington DC, USA
Zhang WJ. 2010. Computational Ecology: Artificial Neural Networks and Their Applications. In: World
Scientific, Singapore
Zhang WJ. 2018. A long-term trend of cancer-induced deaths in European countries. Network Pharmacology,
3(1-2): 1-9
IAEES www.iaees.orgYou can also read