Modeling Contextual Factors of Click Rates - Microsoft
←
→
Page content transcription
If your browser does not render page correctly, please read the page content below
Modeling Contextual Factors of Click Rates

                Hila Becker                                Christopher Meek                  David Maxwell Chickering
            Columbia University                              Microsoft Research                     Microsoft Live Labs
             500 W. 120th Street                              1 Microsoft Way                         1 Microsoft Way
            New York, NY 10027                              Redmond, WA 98052                       Redmond, WA 98052

                            Abstract                                    selection, it is important to consider the position of a link on
                                                                        a particular results page as a factor that may affect its click
  In this paper, we develop and evaluate several probabilistic
  models of user click-through behavior that are appropriate for
                                                                        probability. It may also be the case that the probability that
  modeling the click-through rate of items that are presented           a link is clicked is affected by the quality of the alternative
  to the user in a list. Potential applications include modeling        links in the result set. If the results above a particular link
  the click-through rates of search results from a search engine,       are relevant to the user’s query, the probability that the link
  items ranked by a recommendation system, and search ad-               will be clicked may be affected by the fact that the previous
  vertisements returned by a search engine. Our models cap-             search results already satisfy the user’s search goals. We are
  ture contextual factors related to the presentation as well as        interested in incorporating these types of external factors
  the underlying relevance or quality of the item. We focus             that bias the user selection when modeling click-through
  on two types of contextual factors for a given item; the posi-        rates using query logs.
  tional context of the item and the quality of the other results.      In this paper we look at click-through rates of search adver-
  We evaluate our models on a search advertising dataset from
  Microsoft’s Live search engine and demonstrate that model-
                                                                        tisements. Search advertisement query log data is especially
  ing contextual factors improves the accuracy of click-through         useful for learning the effect of the link’s position on click-
  models.                                                               through rates since the positions at which the advertisement
                                                                        links are shown exhibit greater variation than those of the
                                                                        main search results. If every link is always shown in a
                        Introduction                                    particular position, it is hard to separate the advertiser and
The modern search engine uses ranking techniques in order               positional effects on its click-through rate, unless we use
to improve the quality and relevance of search results, in the          some global measurement of positional effects. For these
way which would best reflect the user’s intent. Researchers             reasons, we focus on modeling click-through of search
have used various different approaches to quantify this                 advertisement data. We perform our experiments on a
notion of relevance. The most obvious way to capture user               search advertising dataset collected from logs of a major
preferences is by using human experts to explicitly evaluate            search engine.
search results. However, this approach is time consuming,               In the first part of this paper, we consider two approaches
and most users are reluctant to give this type of feedback              for learning the click-through rate as a function of both the
due to the intrusive and prolonged nature of the task. On               position and the advertisement itself. The first is a straight
the other hand, the use of implicit feedback obtained from              forward discriminative approach shown in a graphical
search engine logs is a more feasible technique for inter-              form in figure 1a. The second approach, shown in figure
preting the user’s link preferences. These logs are abundant            1b, assumes that there is a binary hidden variable which
as they are easy to collect, and they do not interfere with the         corresponds to the event that the user looks at a link. The
user’s search experience.                                               idea behind the second approach is that users always look at
The problem with using query logs for making implicit                   a link before clicking, and whether or not they actually click
inference of link relevance is that these logs capture an               on an advertisement link depends both on the link quality
inherently biased view of user preferences. This bias may               and the event that they looked at the link. The ”look” event
be due to several factors that are related to the original              in turn depends on the position at which the link is shown.
quality and presentation of search results from which the               We examine these alternative approaches against a baseline
logs where generated, as well as the way in which the users             click-through rate calculation that does not incorporate any
examine the results. It was shown (Joachims et al. 2005)                positional information.
that the order of presentation of the search results has an                 In the second part of the paper we describe a new
effect on the click-through rates. Since users typically                click-through rate prediction model, which incorporates
do not scan all of the search results before making their               contextual features such as relative placement in the result
                                                                        set and surrounding link quality. We compare our results
Copyright c 2007, Association for the Advancement of Artificial
Intelligence (www.aaai.org). All rights reserved.
                                                                        across the different models that we considered in this paper.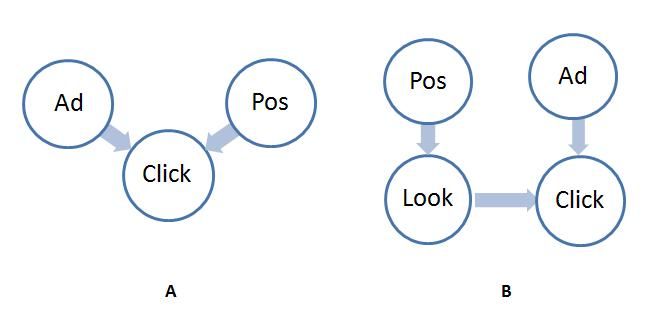
their advertisement (see Edelman et al. 2006 ).
                                                                 Not surprisingly, the mode of presentation of the ranked lists
                                                                 of items affects the way in which users behave. In the con-
                                                                 text of search results, Joachims et al. (2005) , have demon-
                                                                 strated both a positional factor and a contextual quality fac-
                                                                 tor in user behavior through their analysis of eyetracking
                                                                 data and click behavior. Agichtein et al. (2006) have shown
                                                                 similar effects for search results with click behavior and rel-
                                                                 evance data. In this paper, we develop and evaluate proba-
                                                                 bilistic models of user click-through behavior that are appro-
                                                                 priate for modeling the click-through rate of items that are
                                                                 presented to the user in a list. We concentrate on developing
Figure 1: Graphical Representation of Click-though Models        models that incorporate both positional and contextual qual-
                                                                 ity factors.
                                                                 There is a large body of work on using click-through data as
                                                                 implicit feedback. Xue et al.(2004) use click-through data
                                                                 to improve search engine performance by viewing clicks as
                     Related Work                                a way to associate a particular query with a set of links. We
An important and active area of machine learning research        are interested in using click-through data for improving rel-
focuses on leveraging user behavior as a source of implicit      evance of search advertisements.
feedback to build and improve systems. For instance, Oard        Most of the work on using click-through data to improve
and Kim (1998) use implicit feedback to build recommender        search relevance has focused on the problem of extracting
systems and Joachims (2002) uses click-through data to op-       pairwise user preference from click-through logs. For ex-
timize a search engine. In these and other frameworks, users     ample, Radlinski and Joachims (2006) introduce a method
interact with a system through ranked lists of items. Ex-        for generating bias-free training data by collecting pairwise
amples of such ranked lists are search results from search       link preferences. Agichtein et al. (2006) also evaluate their
engines, items from recommendation systems and advertise-        model on pairwise agreement between preferences and re-
ments from search-engine-advertisement systems.                  sults.
A variety of implicit feedback techniques have been exam-        Unlike this related work, our focus is on directly modeling
ined by different researchers. Oard and Kim (2001) present       the click-through of each item given its context. For some
a general framework for modeling the content of informa-         applications, one is interested in a quantitative measure of
tion objects based on observation of user interaction with       click-through rather than a qualitative preference relation-
these objects when seeking information. They illustrate the      ship. In the case of search advertisements, for example, one
potential of these techniques with respect to collaborative      needs models of click-through rate to compute expected rev-
filtering, citation indexing and web search.                     enue for alternative rankings. Furthermore, we suspect that
Fox et al. (2005) examine the correlation of different im-       in some ranking applications, it will be necessary to go be-
plicit measures of user search result preferences such as        yond pairwise preferences to capture contextual quality fac-
dwell time and scrolling events, to user satisfaction. Their     tors and building click-through models to capture contextual
study also showed a relationship between explicit and im-        effects is a first-step.
plicit measures of relevance and gave significant evidence
that implicit measures are important in predicting user satis-                            Notation
faction, especially click-through data. White et al. (2005)      In this section, we describe the notation that we will use
also present results from a study which established that im-     throughout the remainder of the paper. We use upper-case
plicit relevance feedback is preferable to explicit relevance    letters (e.g., X) to denote random variables. We sometimes
feedback, especially since users wish to reduce the burden of    use corresponding lower-case letters (e.g., x) to denote val-
providing such feedback explicitly. Radlinski and Joachims       ues of those variables.
(2005) use query chains, a sequence of reformulated queries,     We concentrate on the following search-application sce-
as input to an algorithm for inferring preference judgments.     nario: a user visits a search site and types in a particular
Agichtein et al. (2006) show improvement in click-through        query. In addition to the “organic” search results, a number
interpretation by modeling user behavior using different im-     of advertisement links are shown to the user. Our goal is to
plicit measures as features. For a survey of other implicit      model the probability that the user will click on a particular
feedback measures see Kelly and Teevan (2003) .                  advertisement link. We use the binary variable C to indicate
Our focus is on modeling click-through behavior of an item       whether or not the user clicks on the link, with C = 1 de-
give its context. Click-through behavior is one of the most      noting a click, and C = 0 denoting a non-click. All of our
readily available and most powerful types of implicit feed-      models use, as input, the position of the link in the result
back; clicks can be viewed as a passive endorsements of the      set. We use the discrete variable P to indicate this position;
items that are clicked. In addition, clicks can have intrinsic   the values of P distinguish among the possible placements
value to the system as is the case with search advertisements    of the link. For example, P = p1 might indicate that the
where advertisers are charged on the basis of user clicks on     link was the top-most advertisement on the page. Finally,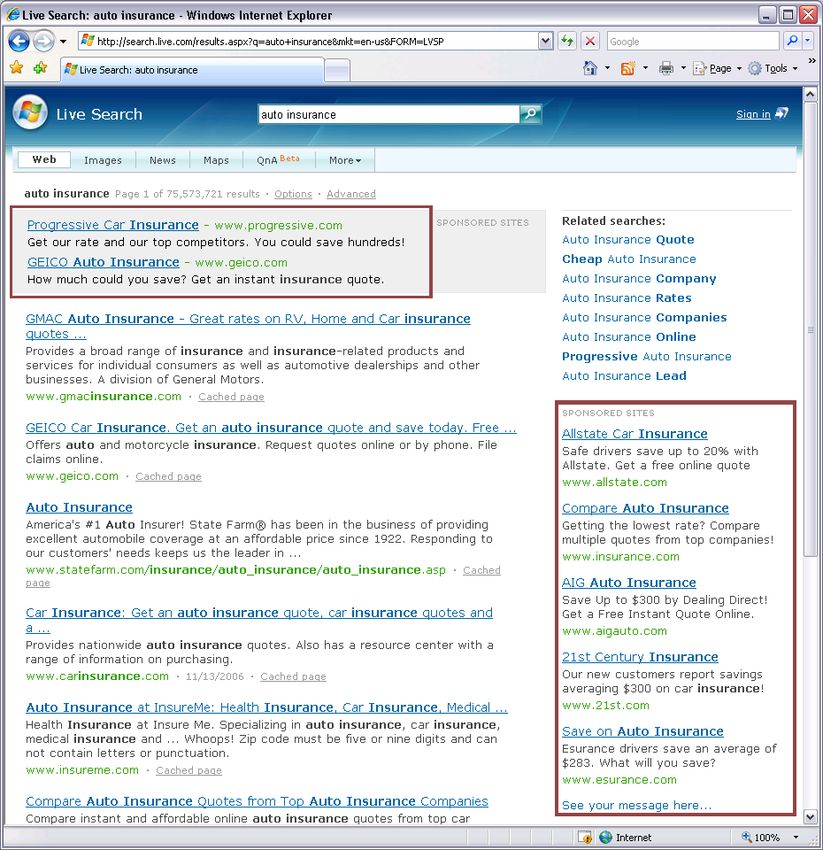
all of the models also use the advertiser identity of the link             the advertiser of the link and we know that the user looked at
as input. We use the discrete variable A to denote the ad-                 the link, (2) whether or not a user looks at a link depends on
vertiser identity. The values of A correspond to the different             the position of the link but not on the advertiser, and (3) the
advertisers whose advertisements can be shown to the user.                 probability that the user clicks on the link without looking at
For simplicity, we assume that any particular advertiser has               the link is zero.
exactly one advertisement that can be shown.                               Using αi = p(C = 1|A = ai , H = 1) and λj = p(H =
The probabilistic models that we describe in this paper de-                1|P = pj ), we see that the second model also has parame-
fine, for a given advertiser A = a and a given position                    ters corresponding to the advertiser effect and the location
P = l, the probability that a user will click on that adver-               effect. We learn these parameters in the second model us-
tisement:                                                                  ing a standard Expectation Maximization algorithm, with a
                    p(C = 1|A = a, P = l)                                  uniform prior on the conditional probabilities (see Bilmes
   In Section 5, we will extend the models to include ad-                  1997).
ditional context about the advertisement link, such as the                 The main difference between our two models is in the way
quality of the surrounding links and relative position on the              that they treat the advertiser
                                                                                                         and location effects. The log-
                                                                                                 p(C=1)
results page.                                                              odds function log p(C=0) used by the logistic regression
                                                                           model for prediction is a linear function of X(a, p). In the
Modeling the Location and Advertiser Effects                               hidden-variable model, on the other hand, the log probabil-
We consider two simple models for representing the adver-                  ity log(p(C = 1)) is linear in X(a, p).
tiser and position effects on link click-through rates. The
first model is a standard discriminative model that we learn                            Experimental Comparison
using logistic regression. In our model, we have a separate                In this section, we compare the two models described above
feature for each advertiser and each position. In particular,              using advertisement click-through log data from Microsoft’s
we compute:                                                                Live search engine (http://www.live.com). We train our
                        |A|                    |P |
                                                                           models using data from the most frequent queries to our
                        X                      X                           search engine and evaluate the performance of the models
      X(a, p) = µ +           αi I(a, ai ) +          λj I(p, pj )   (1)   on our test data using log likelihood scores. We train various
                        i=0                    j=0                         different “local” models using query-specific training data;
where I(x, y) is the indicator function that is one if x = y               each query has its own model with α and λ coefficients for
and zero otherwise. Then, the click-through probability is                 the given query’s advertisers and positions. We also train
modeled as                                                                 one ”global” model using data across all queries, meaning
                                                                           that we use the same λ coefficients to predict the positional
                                             eX(a,p)                       effect for all queries (similarly for α coefficients, although
           p(C = 1|A = a, P = l) =
                                           1 + eX(a,p)                     many advertisers are query-specific by nature). We use
                                                                           query-specific test datasets to test both the “global” model
To learn the parameters of the model (i.e., µ, α1 , ..., α|A| ,            and the “local” model for the particular query. As a baseline
and λ1 , . . . , λ|P | ), we apply a standard gradient descent al-         experiment, we compute click-through rates by dividing the
gorithm; we use a Gaussian prior on the parameters that is                 number clicks on an advertisement link by the number of
centered on zero.                                                          impressions of that link.
We can interpret the α parameters as the advertiser effects;                We first look at the performance of the logistic regression
if αi > αj , then for any particular position, the predicted
click probability will be higher for advertiser ai than for ad-
vertiser aj . These α parameters may be potentially useful in
detecting advertisement quality since they capture the effect
of the advertiser alone on the click-through rate of the link.
Similarly, we can interpret the λ parameters as positional ef-
fects. Experiments and results for this model are described
in the following section.
For our second model, we introduce a hidden binary variable
H and model the click probability as follows:
      p(C = 1|A = a, P = l)
        = p(C = 1|A = a, H = 1)p(H = 1|P = l)                        (2)
The second model is motivated by the intuition that before
a user clicks on a link, he will almost certainly look at the                    Figure 2: Local vs. Global Logistic Regression
advertisement first. If we interpret the event H = 1 as “the
user looks at the advertisement”, then our model can be un-                models with respect to a baseline method, in terms of their
derstood as making the following assumptions: (1) the click                log likelihood scores. Figure 2 shows the difference between
event is independent of the position of the link once we know              the log likelihood of the logistic regression models and the
baseline, weighted over the baseline, for a random subset of
our datasets. Regardless of their performance with respect to
the baseline, the local logistic regression models have bet-
ter log scores than the global model across all of our test
datasets. We will therefore focus our analysis on the local
logistic regression models.
Figure 3 shows the difference between the log likelihood
scores of the logistic regression models and a baseline click-
through prediction method which captures no contextual ef-
fects. These log scores are computed for every one of our
test datasets and are weighted over the baseline. All y-values
greater than 0 imply that the logistic regression model out-
performs the baseline. We can therefore see that our local
logistic regression models are the best predictors of click- Figure 4: Hidden Variable Log Scores over the Baseline
through rates among the approaches that we have considered
so far. Using a sign test we determine that these results are
statistically significant (p < 0.0001). Query Logistic Regression Hidden Variable
We also examine the performance of the hidden variable cars -0.031022 -0.034205
chat -0.058847 -0.060784
cingular -0.101937 -0.103076
real estate -0.052306 -0.060316
superman -0.059982 -0.085866
weather -0.089299 -0.090457
Table 1: Logistic Regression and Hidden Variable Log
Scores
the positional effect on click-through, we look at the logis-
tic regression coefficients for the different positions. Table 2
contains the positional coefficients of the logistic regression
models for several queries. A larger value for the coefficient
Figure 3: Logistic Regression Log Scores over the Baseline implies a greater contribution to the event C = 1. Note that
the general trend shows that higher positions have larger co-
model with respect to the baseline approach. By compar- efficient values, implying that a user is more likely to click
ing the local and global hidden variable models we deter- on links that are displayed at higher positions in the result
mine that once again the local models outperform the global set. Values that do not follow the trend may be attributed to
models and therefore we focus on the local models exclu- particularly relevant links appearing frequently in the same
sively. Figure 4 shows the difference between the log like- position. Another possible factor may be related to the rela-
lihood scores of the hidden variable model and the base- tive position of the advertisement link on the page.
line, weighted over the baseline, for each one of our query-
specific datasets. A positive difference implies better perfor-
mance for the hidden variable model over the baseline for Query pos 1 pos 2 pos 3 pos 4
the given query. Using a sign test, the hidden variable model amazon -1.362 -2.017 -1.231 -3.919
is also significantly better than the baseline with p < 0.0001. debt consolidation -0.921 -1.312 -1.365 -1.850
Next we compare the logistic regression and the hidden vari- games -3.434 -3.805 -3.679 -5.415
able models against each other. Log likelihood scores of the mp3 -0.507 -1.062 -1.580 -2.569
logistic regression and hidden variable local models for a ringtones -1.198 -1.226 -1.481 -2.954
random subset of our datasets are presented in table 1. Us- white pages -1.161 -0.407 -1.194 -4.901
ing the log scores for all of our datasets, we test for statistical
significance using a sign test and determine that the logis- Table 2: Logistic Regression Position Coefficients
tic regression models perform significantly better than the
hidden-variable models with p = 0.004.
Since the local logistic regression models have higher log Given that the logistic regression results proved to be sig-
likelihood scores click-through rate predictors, we would nificantly better than the baseline approach and the hidden-
like to examine them more carefully. The logistic regression variable model, we extend this logistic regression model in
coefficients can be useful in determining the contribution of the next section, to include contextual features such as sur-
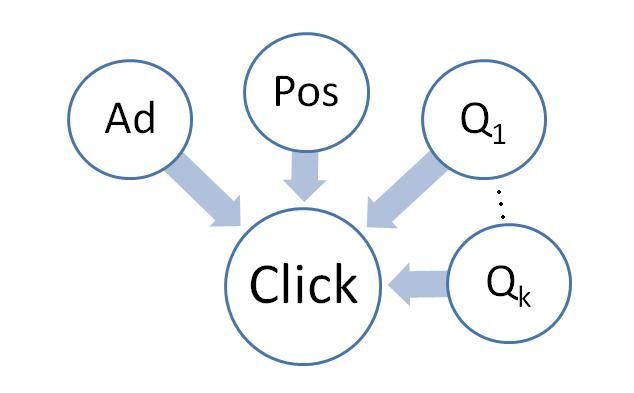
each feature toward the event of a click. In order to analyze rounding link quality and relative placement.Adding Contextual Features tures as follows:
|A| |P | |Q|
So far we only considered the effect of the advertiser and X X X
the position on click-through rate prediction. In this section, X(a, p) = µ+ αi I(a, ai )+ λj I(p, pj )+ θk Qk (a, p)
i=0 j=0 k=0
we expand our feature set to include additional contextual
information regarding the advertisement’s relative position (3)
and quality. The new features are meant to capture the qual- A graphical representation of this model can be seen in
ity of the alternative links; intuitively, if the link of interest figure 6.
is placed below a particularly good advertisement link, we
expect that the click rate will be lower than if it is placed
below a particularly bad advertisement link. Given the re-
sults in the previous section, we consider the added contex-
tual features only in the logistic-regression model; for future
work, we plan to incorporate these features into the hidden-
variable model as well.
In our search engine, advertisement links are displayed ei-
ther on the main line of the results page, preceding the or-
ganic results, or on a side bar located on the right hand side
of the page. The number of advertisements shown on the Figure 6: Contextual Model - Graphical Representation
main line and the side bar varies and sometimes there are
no main line or side bar links at all. In the new model, we Learning the model parameters of the extended logistic-
use this distinction between the two groups of links since regression model is problematic because the quality features
their different locations on the results page may affect click- are functions of the α parameters; we can no longer apply
through. An example of the advertisement links layout on a standard methods to learn the parameters. We apply the
results page can be seen in figure 5. following boosting-style algorithm to learn the parameters
of the extended model. First, we set Qk = 0 for all k,
and run the standard gradient-descent algorithm. Next, we
update the Qk values using the α values that resulted. We
then re-run the gradient-descent algorithm to learn new
values for the parameters, keeping the Qk values constant.
We iterate this process of defining constant Qk values in
terms of the α values from the previous iteration. After
each iteration, we record the log-likelihood of the data.
We stop this process after the first iteration in which the
log-likelihood decreases, and we use as our final model the
one from the previous iteration in which the log-likelihood
was the highest.
We compare the results of the simple local logistic re-
gression model, our best performing model so far, to the
contextual model that was trained using the gradient descent
algorithm. From table 3 we observe that while there is a
difference in performance between the two approaches, it is
not as apparent as it was with the previous improvements to
the baseline approach.
Query Logistic Regression Contextual Model
astrology -0.012498 -0.012285
Figure 5: Search Results with Advertisement Links britney spears -0.049658 -0.050804
debt -0.013555 -0.012102
The new features that we add to our models include con- expedia -0.152005 -0.151790
textual information denoting relative placement of advertise- insurance -0.023235 -0.018511
ment links in the result set, as well as different functions music -0.010922 -0.010875
of the advertiser-effect parameters of alternative links from
the logistic regression model. In particular, we consider in- Table 3: Logistic Regression and Contextual Model Log
cluding features such as the link’s physical position on the Scores
page: main line versus side bar, whether the quality of link
above/below is better and the number of links above/below Figure 7 shows the weighted relative gain of the contex-
which are better. tual model with respect to the simple local logistic regres-
We extend the logistic regression model to include these fea- sion model per query. While the contextual models performsignificantly better than the simple logistic regression using One limitation of the contextual model is that it can only
a sign test (p < 0.04), they do not yield a very large gain learn about differences that appear in data. For future work,
with an average of ≈ 0.01 weighted difference. This im- we plan to study the trends in our data as well as expand our
plies that from a practical standpoint, it may be beneficial datasets in order to identify other useful features to model.
to forgo the extra contextual features in favor of the simpler We would also like extend the hidden-variable model to in-
model in order to improve complexity. clude contextual features, and determine if a different mod-
eling approach could yield a significant performance gain.
Other directions for future work include utilizing click in-
formation about surrounding advertisement links in training
a predictive model of click-through, developing models for
predicting the probability of the set of click-through sessions
for a page, and modeling the probability of click-through us-
ing features of the users previous behavior.
References
Agichtein, E.; Brill, E.; Dumais, S. T.; and Ragno, R. 2006.
Learning user interaction models for predicting web search
result preferences. In SIGIR, 3–10.
Agichtein, E.; Brill, E.; and Dumais, S. T. 2006. Improv-
ing web search ranking by incorporating user behavior in-
formation. In SIGIR, 19–26.
Figure 7: Contextual Model Gain over Logistic Regression Bilmes, J. 1997. A gentle tutorial on the em algorithm and
its application to parameter estimation for gaussian mixture
and hidden markov models.
Conclusion Chickering, D. M. 2002. The winmine toolkit.
In this paper we presented several approaches for model- Edelman, B.; Ostrovsky, M.; and Schwarz, M. 2006. In-
ing the click-through rates of advertisement links on a large- ternet advertising and the generalized second price auction:
scale search engine. In such an application, it is particularly Selling billions of dollars worth of keywords.
important to learn parsimonious models that capture the pre- Fox, S.; Karnawat, K.; Mydland, M.; Dumais, S. T.; and
sentation and advertiser effects on click-through rates; the White, T. 2005. Evaluating implicit measures to improve
choices that we make for which advertisements to show in web search. ACM Trans. Inf. Syst. 23(2):147–168.
what contexts have an immediate impact on the amount of
revenue that we gain from the system. Joachims, T.; Granka, L. A.; Pan, B.; Hembrooke, H.; and
We considered two simple models for learning the adver- Gay, G. 2005. Accurately interpreting clickthrough data as
tiser and positional effects, and compared their performance implicit feedback. In SIGIR, 154–161.
to a standard method for click-through rate prediction. Both Joachims, T. 2002. Optimizing search engines using click-
of our modeling approaches, logistic regression and hidden through data. In KDD, 133–142.
”look” variable, proved to be significantly better than the Kelly, D., and Teevan, J. 2003. Implicit feedback for
baseline with p < 0.001 using a sign test. Since the success inferring user preference: a bibliography. SIGIR Forum
of both approaches shows that modeling the advertiser and 37(2):18–28.
position information improves click-through rate prediction, Oard, D. W., and Kim, J. 1998. Implicit feedback for
we were interested in extending one of these models to in- recommender systems.
clude other contextual information. After evaluating the two
approaches against each other, we determined that the lo- Oard, D. W., and Kim, J. 2001. Modeling information
gistic regression models were the better click-through rate content using observable behavior.
predictors. Radlinski, F., and Joachims, T. 2005. Query chains: Learn-
Using this information, we decided to extend the logistic re- ing to rank from implicit feedback. In KDD, 239–248.
gression models to include contextual features such as rela- Radlinski, F., and Joachims, T. 2006. Minimally in-
tive position on the page and quality of the alternative links vasive randomization fro collecting unbiased preferences
in the result set. Although the results are statistically sig- from clickthrough logs. In AAAI.
nificant, the relative difference between the log likelihood White, R. W.; Ruthven, I.; and Jose, J. M. 2005. A study of
scores is not a large one. We note here that in practical ap- factors affecting the utility of implicit relevance feedback.
plications one should consider the tradeoff between the ac- In SIGIR, 35–42.
curacy and complexity of these approaches. For instance,
given the small gain from the additional contextual features Xue, G.; Zeng, H.; Chen, Z.; Yu, Y.; Ma, W.; Xi, W.; and
and scalability issues for using local models, a global logis- Fan, W. 2004. Optimizing web search using web click-
tic regression model trained using a sample of the data may through data. In CIKM, 118–126.
be the best approach.You can also read


