SEISMIC DAMAGE ASSESSMENT OF DEFICIENT REINFORCED CONCRETE FRAME STRUCTURES
←
→
Page content transcription
If your browser does not render page correctly, please read the page content below
Civil and Environmental Engineering
                                                           Vol. 17, Issue 1, 31-44, DOI: 10.2478/cee-2021-0004

SEISMIC DAMAGE ASSESSMENT OF DEFICIENT
REINFORCED CONCRETE FRAME STRUCTURES
Muhammad RIZWAN1,*, Syed Azmat Ali SHAH2
1
    Department of Civil Engineering, University of Engineering & Technology Peshawar, Pakistan.
2
    Centre for Disaster Preparedness and Management, University of Peshawar, Pakistan.
*
    corresponding author: mrizwan@uetpeshawar.edu.pk

    Abstract                                                                     Keywords:
    In order to assess the seismic damage response of reinforced                 Special moment resisting frame;
    concrete deficient, weak beam-column connection frame structures,            Building frame;
    this study presents experimental shake table testing on representative       Beam-column joints;
    1/3rd reduced size and double story frame models. Two test models            Shake table test;
    were considered for experimental testing, including a reference code         Progressive collapse.
    design specimen and another frame with a similar characteristic, but
    was not provided with any shear reinforcement in the critical joint
    connection region and, was constructed with concrete having a
    compressive strength of 33 % less than the code specified value. The
    input scaled excitations were applied from 5 % to 130 % of the
    maximum input peak ground acceleration record, to deformed the test
    models from elastic to inelastic stage and then to fully plastic incipient
    collapse stage. The weak beam-column frame sustained plastic
    hinging at column bases and beam ends, with longitudinal
    reinforcement bar-slip and severe damageability of the joint panels
    upon subjected to multiple dynamic excitations. The deficient frame
    model was only able to resist 40 % of the maximum acceleration
    record as compared to the code design frame which was able to resist
    about 130 %.

1 Introduction
        Due to the use of old building codes and also, the improper use and execution of the current
special moment resisting frame SMRF seismic code detailing, have caused the majority of these RC
building having different seismic defects or deficiencies. Different field surveys were conducted
recently in order to find the most typical construction and seismic deficiencies in the general RC
building stock [1, 2]. These field surveys have revealed that mostly the design or construction defects
consist of the low quality of building materials (i.e. low strength concrete constituents and
reinforcement material) along with different non-seismic provisions. The most common construction
defect is the weak beam-column connection deficiency i.e. not having any confining shear
reinforcement in the joint panel area and build with low strength concrete as required per the code
specifications, is very common [2,3]. As also seen from past earthquakes damage observation of RC
building typology with such defects can cause severe joint failures, thus reducing the load carrying
capacity of the connecting members (beams and columns) and can cause partial or even complete
collapse of the RC building systems [3]. Furthermore, the majority of such RC buildings typology
currently exists in areas which has very seismicity and which can be excited with the coming future
earthquake demands [4]. It is also evident from the past earthquake observations that if reinforced
concrete buildings having older non-seismic provisions or not design and constructed as per the
proper design provisions will cause significant failure upon subjected by design level earthquake
demands and which can cause huge human and economic losses [5-9]. All these show the importance
of the seismic evolution of RC frame system with design or construction defects within the context of
seismic feasibility assessment of such building typology.
        From the last few decades, researchers have conducted experimental studies through quasi-
static tests on weak beam-column connections and shake table tests on deficient frame structures, to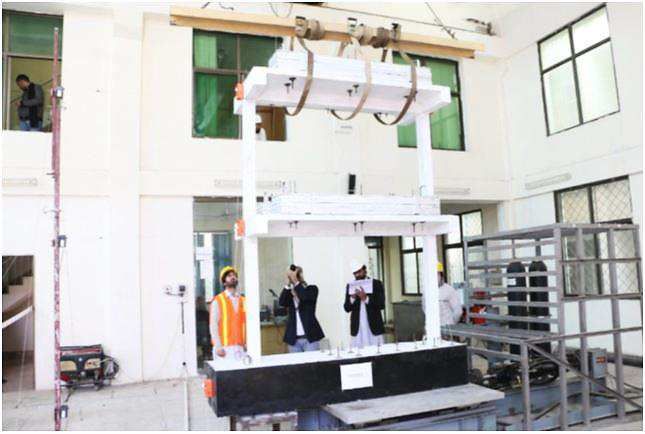
Civil and Environmental Engineering                                              Vol. 17, Issue 1, 31-44

access their seismic performance. In most of these experimental studies, either full scaled and/or
reduced scaled beam-column connections and frame structures have been employed. In these
experimental investigations, different types of substandard and non-seismic parameters and diverse
structural configuration have been considered, in order to access the seismic performance and
damage mechanism of deficient of RC structures. Quintana et al. [10] tested 1:2.5 reduced scaled
three-story deficient frame structure on a shaking simulator, in order to access the damage mechanism
and to provide bench mark test data for the retrofitting of the old type, non-ductile and non-seismic
designed buildings. The test model was built with plain rebars, without joint transverse reinforcement
                          o
provisions and with 90 non-seismic hooks. The test models were subjected to increasing PGA
excitation of several earthquake records in order to observe the damage behavior of the test frame.
During the initial excitations it was observed that the model experience lap splice failure at the top
story joints because of the use of plain rebars. At high PGA intensity most of the damages were
concentrated at lower story column bases and extensive damages were observed at beam-column
connections, shows the high vulnerability of these deficient RC structures. Stavridis et al. [11]
conducted shake table tests on 2:3 scaled three story and two bay RC frame structures, with older
code design parameters and non-seismic detailing. The effects of infill panels were also investigated
during the experimental program. Increasing inputs excitations were applied to test specimens in order
to investigate the damages mechanism with low, moderate and high-level shaking intensities. It was
observed during the testing program that at low level intensity, minor cracks appeared in the infill
panels, with the development of plastic hinge formation at column bases i.e. cracking and joint shear
failures at high level excitations. Yavari et al. [12] tested fours 1:2.25 scaled two story and two bay RC
frame with non-seismic detailing in the beam and column members and no transverse reinforcement in
the beam-column joints. The objectives of the experimental program were to investigate the collapse
mechanism and gravity load redistribution with increasing dynamic excitations. Different factors that
effects the behavior of these deficient RC frame structures during an earthquake loading such as; axial
load demand on the column members and shear failure pattern of weak beam-column connections,
have been evaluated. It was observed from the experimental study that the collapse of deficient RC
frame structures would be likely be the result of the plastic hinging mechanism produced at the base of
non-ductile columns ends and critical shear failures of beam-column connections. Sharma et al. [13]
conducted a shake table test on a 3D, 3 story RC frame model with design deficiency of having no
transverse reinforcement in beam-column connection and poor anchorage provision. The objectives of
the testing program were to investigate the effectiveness of a tuned mass damper (TLD) retrofitting
scheme and to observed the inelastic behavior of a non-seismic design RC frame structure under
increasing dynamic excitations. It was observed from the from test results that under increasing
dynamic shaking, the model damage behavior is mostly concentrated at the base of the lower story
columns base and beam-column panels. Most of the experimental studies available in the literature
were reported on the seismic assessment of non-ductile gravity type RC building typologies [14-16].
However, seismic assessment studies on the current special moment resisting frames SMRF
structures (beam and column members are as per the seismic code requirement), but having weak
beam-column joints (no transverse ties reinforcement and built with low strength concrete) and their
seismic behavior at the ultimate damage state, are lacking.
        In order to assess the ultimate capacity and damage mechanism of frames with weak beam-
column joints, shake table tests have been conducted on representative frames structures. The
experimental study has been performed on two, two story RC frame specimens with 1/3rd reduced
size scaling. Model 1 (reference model) was a code design specimen, whereas, Model 2 was similar to
Model 1, but was provided with no ties in the beam-column panel zone along with concrete strength
less than the design specified strength 33 % less, to consider the effects of the most commonly
available defects in the existing building stock [1,3]. The reduced size frame specimens were excited
with multiple excitations in the un-directional shaking, using 1994 Northridge Earthquake multiple
scaled input records. The test specimen observed damage mechanism, response parameter (such as
acceleration and displacement histories) and force-deformation relationship have been developed and
compared. The objectives of the current experimental program are to understand the dynamic
response, damage mechanism at ultimate capacity and to develop drift-based damage scales for RC
frame structures with weak beam-column joint connections.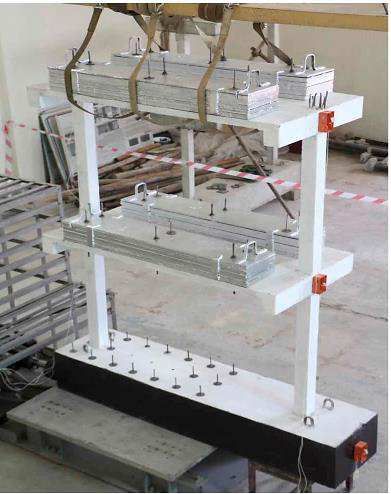
Civil and Environmental Engineering                                               Vol. 17, Issue 1, 31-44

2 Experimental program

2.1 Test specimens description
       In order to investigate the seismic performance of non-ductile and code non-compliant weak
beam-column connection RC frames through shake table testing, the current study considers a low
rise, regular two-story prototype building [17], as shown in Fig. 1. The considered prototype building
consists of two bays by one bay configuration, with all bays length of 5487 mm (18 feet) and typical
story height of 3658 mm (12 feet). The analysis and design of the prototype RC building were
performed as per the UBC97/BCP-SP07 [18,19] building codes and the seismic detailing of the
framing system was based on the provisions of the ACI-318-14 [20] for special moment resisting frame
SMRF systems. For seismic analysis, equivalent static forced based procedure, with the stiff ground
condition (soil type B) and design peak ground acceleration PGA of 0.40 g (high seismicity level) was
used. Typical code-based load (dead and live load) and load combinations were considered during the
design process. The modeling, analysis and design of the prototype building were performed using
CSI ETABS analysis and design software. For concrete material, the compressive strength of 21 MPa
(3000 psi), whereas, for the steel rebar yield strength of 414 MPa (60000 psi) was considered. Fig. 1
and Table 1 shows the geometry and design details of the structural members of the considered
building.

2.2 Preparation of one-third reduced models
       Due to the shake table simulator’s size limitations and motion restrictions in terms of
acceleration and displacement response, it was decided to select only the critical interior frame from
the prototype building. The selected interior frame was then reduced by a factor of 3 in order to test
                                                                                                         rd
the frame models within the range of shaking limitations. For the simulation and conversion of 1/3
reduced model, a simple linear scaling model was adopted [10,17]. All the linear geometrical
dimensions of the prototype building interior frame and structural members were divided by a factor of
3, as reported in Table 1. Similarly, for reinforcing rebars, 1/3rd reduced diameter rebars were used in
the test model construction. The simple model idealization is generally adopted based on its simplicity
in simulating the prototype characteristics and associated low construction cost of the test specimens.
                                                    rd
Similarly, for concrete material preparation, 1/3 reduced coarse aggregate size 9.53 mm (0.375 in)
was used in the test model preparation. Fig. 2 shows the test model construction phases. Initially, a
strong reinforced concrete pad (strong beam) with a size of 558.8 mm (22 in) depth, 406.4 mm (16 in)
width and 2438.4 mm (8 feet) long was constructed, which will act as strong fixed foundation support
for the frame model. The strong concrete pad was provided with a 25.4 mm (1 in) size hole as regular
interval, which are going to use to anchor the test model on the shake table top, using steel screws.
During the construction of the pad, the longitudinal reinforcement of the columns was placed at their
required position. After the construction of concrete pad and water curing for 7 days, the first story was
constructed using special fabricated steel formwork for the column, beam and slab members. The
concrete laying for the first story column, beam and slab was performed on the same day. Similarly,
after the construction of the first story and curing for 14 days, the second/roof story was constructed in
the same manner. The test models were then water cured for 14 days and were provided with moist
bags for a period of 28 days. After 28 days, the test models were shifted from the casting yard to the
testing laboratory, after which the test specimen was mounted on the shaking simulator for testing.
Civil and Environmental Engineering                                            Vol. 17, Issue 1, 31-44

                 Fig. 1: Geometric and design layout of prototype RC frame, Model 1.

       Table 1: Prototype and reduced models’ dimensions and similitude conversion factors.
    Member geometry / material
                                           Prototype geometry           1/3rd scaled model geometry
           properties
           Bay length                       5487 mm (18 feet)                1828.8 mm (6 feet)
           Story height                     3658 mm (12 feet)                1219.2 mm (4 feet)
              Beams                   304 mm x 459 mm (12 in x 18 in)   102 mm x 153 mm (4 in x 6 in)
             Columns                  304 mm x 304 mm (12 in x 12 in)   102 mm x 102 mm (4 in x 4 in)
               Slab                           153 mm (6 in)                      51 mm (2 in)
        Reinforcement rebar                414 MPa (60000 psi)              414 MPa (60000 psi)
                                            19 mm (#6 Rebar)                 6.33 mm (#2 Rebar)
                                            10 mm (#3 Rebar)                 3.33 mm (#1 Rebar)
             Concrete                       21 MPa (3000 psi)                 21 MPa (3000 psi)
                                                                         1:1.80:1.60 with w/c of 0.48
                                            14 MPa (2000 psi)                 14 MPa (2000 psi)
                                                                          1:2.5:2.87 with w/c of 0.80
         Coarse Aggregate                   28.58 mm (1.125 in)              9.53 mm (0.375 in)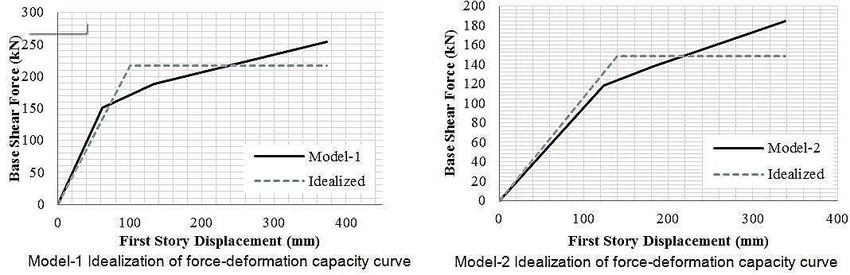
Civil and Environmental Engineering Vol. 17, Issue 1, 31-44
Fig. 2: 1/3rd scaled specimen construction.
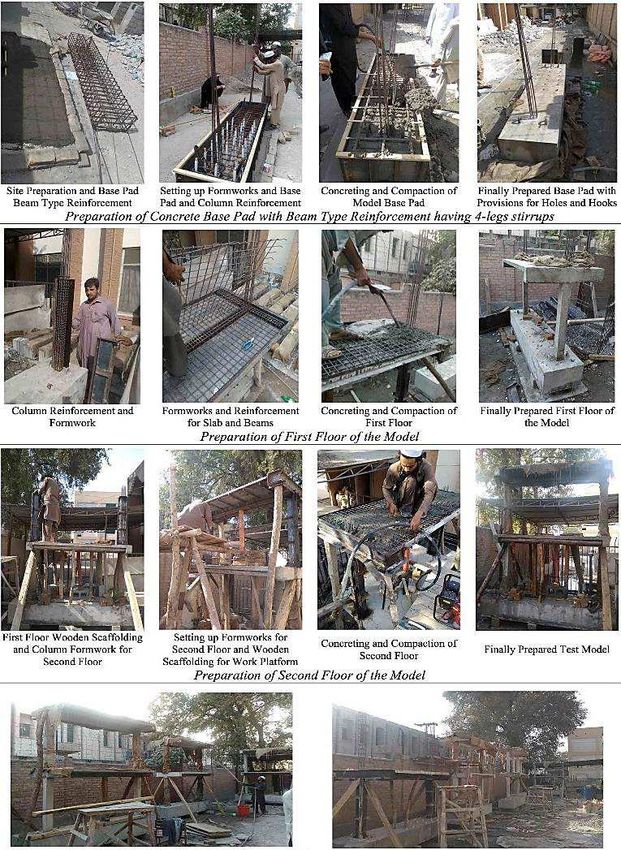
It is also worth mentioning that, due to reduced scaling, the test model will be subjected by
reduced force due to mass simulation. In order to simulate the seismic mass during the dynamic
testing, extra seismic mass 1200 kg in the form of steel weights were provided on each story, as
shown in Fig. 3. Table 1 also reports the concrete mix proportion based on the ACI mix proportion
procedure, for the code specified compressive strength of 21 MPa (3000 psi) and reduced concrete
strength of 14 MPa (2000 psi) using reduced size 9.53 mm (0.375 in) coarse aggregate.
Fig. 3: Extra weights in the form steel plates for seismic mass modeling.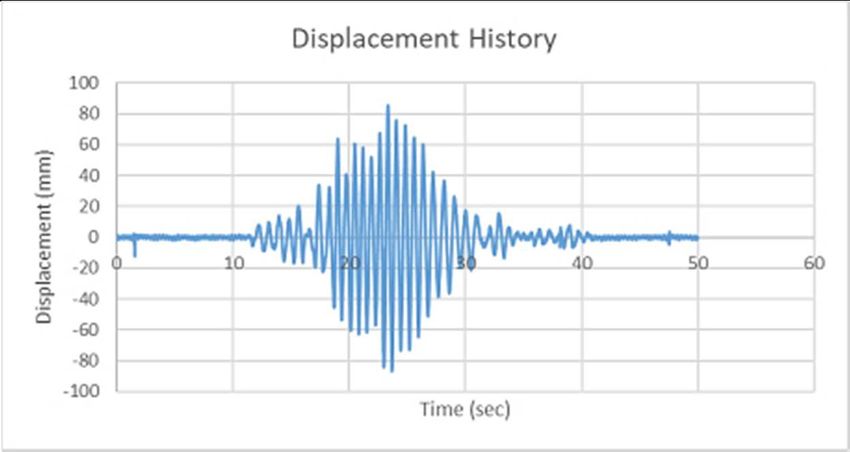
Civil and Environmental Engineering                                               Vol. 17, Issue 1, 31-44

2.3 Test model setup and instrumentation
        Fig. 4 shows the experimental specimen testing setup, whereas, Table 2 and Fig. 5 shows the
external instrumentation layout detail. In order to obtained acceleration responses, the test model was
installed with one accelerometer on the base level and two pairs of accelerometers on the first and
roof story level, one on the front and second on the back side. Similarly, to measure the displacement
responses, three linear variable displacement transducer LVDT were installed on a steel reference
frame, and were in line with the base, first and roof story level.

2.4 Shake table testing and input loading protocols
       For shaking excitations, the 1994 Northridge Earthquake record shown in Fig. 6, was selected
after care full analysis of a number of natural acceleration records that can excite the test specimen
with in shaking simulator limitations. The selected record has a peak acceleration of 0.57 g, peak
velocity of 518 mm/sec and peak displacement of 90 mm. The code compliant and deficient RC frame
test models were excited with an increasing scale value of peak ground acceleration i.e. from 5 % to
130 %, in order the force the specimen from elastic stage to yield and then, to full plastic collapse
stage. Both test specimens were initially excited by the seismic simulator self-check run. After this run,
the test frames were shaken with multiple incremental excitations. The test frames were inspected
after each run for damage and cracks formations, which were recorded through snapshots, video
recording, and along with cracks description for the structural members. The testing sequence was
following until the maximum capacity of the test models reached, after which the test was stopped. For
each test run, the floor acceleration and displacement response were obtained using the installed
accelerometers and displacement transducers.

2.5 Recorded data processing
        For both test models, the acceleration and displacement raw data obtained from the installed
instruments were further process for instrument coefficients corrections, base line correction and data
filtering in order to remove any noise. For the data analysis and correction purpose, the Seismosignal
data correction package has been utilized with a linear type baseline process and Butterworth filter.
The limits for the filter frequency was between 0.10 to 25 Hz. Once all the data has been processed,
the acceleration and displacement response at the base, first and roof story level were obtained in the
prototype domain using the simple model idealization scaling factors [10,17]. Tables 3 and 4 reports
the first and roof story level displacement and acceleration time histories, for both the code compliant
and deficient prototype structure, only for the selected significant runs. In order to obtain the first and
roof story relative displacement with reference to the base/pad level, the later displacement values
were subtracted from respective story displacement values. Similarly, in order to calculate the relative
first and roof story drifts, the maximum displacement value of each run is normalized i.e. divide by the
height of the story. The story level inertial forces were calculated by multiply the maximum
acceleration value of each run by the corresponding applied weights (which include self-weight and
extra seismic mass). The total base shear at the base/pad level was then obtained by summing the
first and roof story inertial forces.

                              Fig. 4: 1/3rd reduced RC frame model setup.
Civil and Environmental Engineering                                                             Vol. 17, Issue 1, 31-44

                                        Fig. 5: Test specimen instrumentation detail.

                                 Fig. 6: 1994 Northridge earthquake acceleration record.

                                  Table 2: Instrumentation position and characteristics.
                                                                                                      Correction
        Channel           Placement              Face       Peak limit        Response
                                                                                                      parameter
            A1            Base level             Front                    Acceleration [mv/g]           492.20
            A2            First Floor            Front                    Acceleration [mv/g]           501.10
            A3           Second Floor            Front                    Acceleration [mv/g]           510.10
                                                              ±10 g
            A4             Pad level             Back                     Acceleration [mv/g]           508.90
            A5            First Floor            Back                     Acceleration [mv/g]           490.10
            A6           Second Floor            Back                     Acceleration [mv/g]           502.00
            D7             Pad level             Front                   Displacement [mv/inch]         1000.00
                                                            24 inches
            D8            First Floor            Front                   Displacement [mv/inch]         1000.30
                                                            (610 mm)
            D9           Second Floor            Front                   Displacement [mv/inch]         1000.20

             Table 3: Model 1 experimental observed displacement and acceleration histories.
  Run            Story level                Displacement history [mm]                   Acceleration history [g]

             First story level

 1st Run/
   Self-
  check
    run

             Roof story level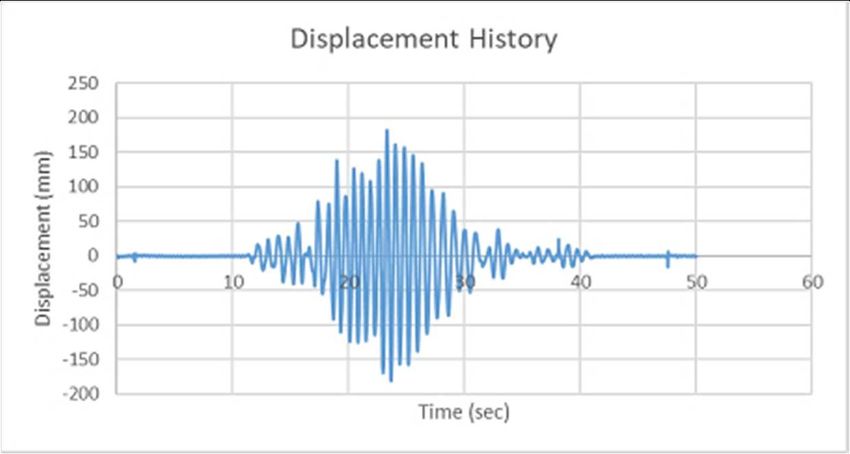
Civil and Environmental Engineering                                         Vol. 17, Issue 1, 31-44

         First story level

 100 %
  Run

         Roof story level

         First story level

 130 %
  Run

         Roof story level

         Table 4: Model 2 experimental observed displacement and acceleration histories.
  Run      Story level         Displacement history [mm]               Acceleration history [g]

         First story level

  5%

         Roof story level

  30 %   First story level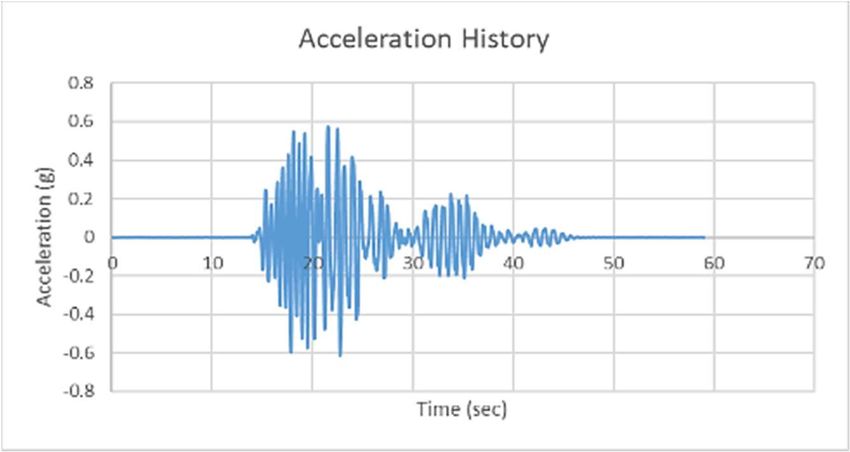
Civil and Environmental Engineering                                                   Vol. 17, Issue 1, 31-44

            Roof story level

            First story level

  40 %

            Roof story level

3 Results and discussions

3.1 Observed damage response of test models
       Tables 5 and 6 reports the code compliant and deficient test models peak values of roof story
displacement, drift, base shear force and corresponding cracking patterns for significant excitations.
Whereas, Figs. 7 and 8 shows the test frames global damage evaluation, for the same shaking
excitations. In the start, both test frames were excited with shake table self-check run. During this run
the code compliant specimen was displaced in the lateral uni-direction, with an excitation's intensity of
0.6 g (about 90 %) and the corresponding roof story drift was about 0.87 %. Sever flexural cracking
was observed at the first story beam members during this run, which was due to the beam longitudinal
reinforcement yield.

                                    Table 5: Observe damage in Model 1.
                     Roof story
                                    Roof story   Maximum base
                      maximum
      Run                           maximum      shear force kN               Observe damage
                    displacement
                                     drift [%]       (kips)
                      mm (Inch)

   Self-Check–                                                    Flexure horizontal & vertical cracks in beam
                     61.45 (2.42)      0.87      151.08 (33.96)
      0.60 g

                                                                      Flexure cracks at base of columns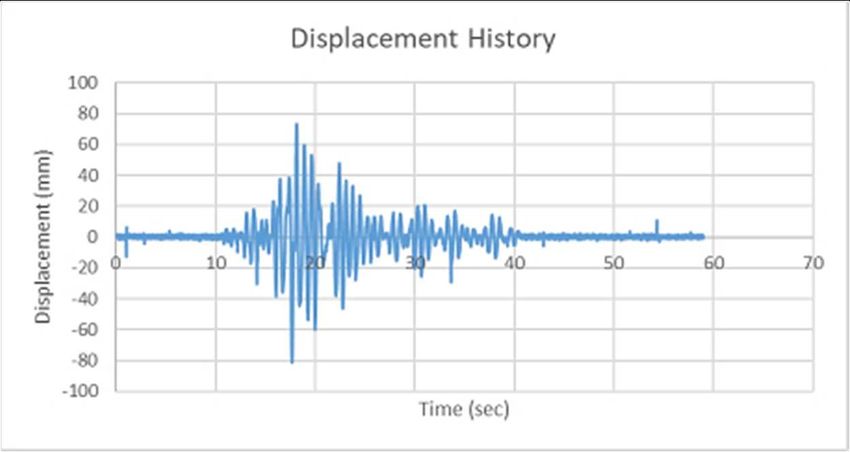
Civil and Environmental Engineering                                                             Vol. 17, Issue 1, 31-44

 100 % – 0.62 g    133.56 (5.26)        1.88       188.90 (42.47)        Concrete crushing at ground storey column top

                                                                          Cover spalling at ground storey column base

 130 % – 1.06 g    373.03 (14.69)       5.26       254.73 (57.27)         Diagonal cracks in joint panel, ground storey

                                                                            Diagonal cracks in joint panel, first storey

                                      Table 6: Observe damage in Model 2.
                   Top storey
                                    Top storey Maximum base
                    maximum
     Run                            maximum shear force kN                          Observe damage
                  displacement
                                     drift [%]     (kips)
                    mm (Inch)

                                                                 Visible cracks in beam and column elements, roof story
  5 % – 0.52 g    123.69 (4.87)       1.75     117.92 (26.51)                             level

                                                                Small horizontal cracks on joint panel area first story level
Civil and Environmental Engineering Vol. 17, Issue 1, 31-44
Joint panel area significant cracking, roof story level
30 % – 0.35 g 182.37 (7.18) 2.57 137.48 (30.91)
Joint panel area significant cracking, first story level
Concrete spalling crack concentration in joint panel, roof
40 % – 0.73 g 338.19 (13.31) 4.77 184.50 (41.48) story level
Crack concentration in joint panel, first story
The first story level beam was also observed with small vertical interface cracks. Few flexural
cracks were also observed at the base of first story columns. After the self-check run, the code
complaint model was further excited with increasing scaled excitations of 5 %, 10 %, 20 %, 30 %,
40 %, 50 %, 60 %, 70 %, 80 %, 90 % and 100 %. During all these runs, no significant damages were
observed but only the existing cracking was widened. After the 100 % run, the test specimen was then
excited with a 130 % which has displacement the test specimen to lateral drift of about 5.26 %, with an
excitation intensity of about 1.06g. During this 130 % run, significant damages were observed in the
test specimen. Already existing cracks were significantly spread and widened over the surface of
members. Sever concrete cracking and crushing at the first story and with minor cracking roof story
column bases were observed. Some major cracks on the joint panel region at the first story level and
minor cracks at the roof story level were also observed during this run. After a 130 % run the testing
sequence was stopped as the test model was in near incipient collapse state.
The code deficient test model was also tested with the same sequence but due to weak beam-
column joint (no shear reinforcement in the joint panel regions) and reduced concrete strength
deficiency, the test model was only able to resist about 40 % of the input excitation. The damages
sustained by the beam, column and joint panel regions of the deficient model was quite earlier and
significant as compared to the code design reference frame model. The damages in joint panel
regions were mostly concentered in case of deficient models, whereas, the minor joint cracking was
mostly spread over a large area around the joint panel regions.Civil and Environmental Engineering Vol. 17, Issue 1, 31-44
Fig. 7: Global damage response for Model 1.
Fig. 8: Global damage response for Model 2.
3.2 Force - deformation relationships
The force-deformation relationships or capacity curves for the considered code design Model 1
and deficient Model 2 were obtained by correlating the peak values of displacement (drift) and base
shear forces. At each floor level and for each run the corresponding peak value of accelerations was
obtained and was multiplied with the respective floor masses (including floor, beam and column self-
weight and extra steel weights) in order obtain the story shear or inertial forces. The first and roof story
level inertial forces were sum up in order to get the base shear force of the prototype frame. Fig. 9
shows the developed force-deformation capacity curves or envelope curves for code design frame
Model 1 and deficient weak beam-column joint Model 2. The force-deformation relations obtained
shown in Fig. 9 were further normalized by energy balance criteria in order to obtained bilinear
idealized relationships, which can be employed for a comparable performance and computation of
different seismic parameters. For this purpose, the actual capacity curves from the experimentally
observed data were bi-linearized by equating the total area of real force-deformation relationships and
the bilinear idealized capacity plots using iterative procedures. The peak values of displacement
obtained during the final runs i.e. before the incipient collapse state, have been considered as the
ultimate value of the displacement. By equating the energy, the corresponding value of the idealized
yield deformation and strength has been evaluated from the developed bilinear curves as shown in
Fig. 10. As it is depicted, the yield stiffness, strength and also the peak displacement capacity or
ductility generally decreases for the case of deficient weak beam-column Model 2. It also observed
that the yield stiffness of Model 2 decreases by about 50 % as compared to the code design reference
Model 1. Similarly, in the case of Model 2 the yield strength has also been reduced by 31 % as
compared to Model 1.Civil and Environmental Engineering Vol. 17, Issue 1, 31-44
Fig. 9: Test models force-deformation capacity curves.
Fig. 10: Test models force-deformation capacity curves idealization.
4 Conclusions
Recent reinforced concrete special moment resisting frame SMRF structures with weak beam-
column joints defects have been evaluated through dynamic shake table testing, in order to access the
seismic performance and ultimate damage mechanism of such class of deficient RC structures.
Unidirectional dynamic shake table tests have been used to the test model under various scaled
excitations in order observe seismic damage mechanisms and develop drift-based performance limit
states.
The following are the main conclusions from this experimental research work:
1) The code design SMRF model sustained, structural members flexural hinge formation at the
ends, under extreme ground shaking and have response per the code very well i.e. about 1.3 times
1.06 g more than the input design level shaking.
2) The deficient weak beam-column frame model with no shear reinforcement provision in the
joint panel region and built in low strength concrete, typically found in general construction, has only
sustained up to 40 % of the input shaking. The weak beam-column joint SMRF model was able to only
resist 40 % of the PGA value 0.73 g as compared to the reference code design SMRF model, which
was able to resist 130 %, 1.06 g.
3) Due to the non-provision of joint panel region shear reinforcement and low strength concrete
the damages response consists of flexural yielding of the beam and column members, followed by
significant damages concentrations in the joint panel regions, thereby decreasing the load carrying
capacity. Such damage can cause a story mechanism with a partial or full collapse of the building
system.
4) It has been observed from the current experimental study that, the yield stiffness, strength
and also the peak displacement capacity or ductility generally decreases for the case of deficient weak
beam-column Model 2. It also observed that the yield stiffness of the Model 2 decreases by about 50
% as compared the code design reference Model 1. Similarly, in the case of Model 2 the yield strength
has also been reduce by 31 % as compared to Model 1.
5 Acknowledgements
The authors are thankful to the Earthquake Engineering Center (EEC), Department of Civil
Engineering, UET Peshawar for supporting the research presented herein.Civil and Environmental Engineering Vol. 17, Issue 1, 31-44
6 References
[1] BADRASHI, Y.I. – ALI, Q. – ASHRAF, M.: Reinforced Concrete Buildings in Pakistan. Earthquake
Engineering Research Institute, Housing Report, Oakland, CA, 159, 2010, pp. 1-16.
[2] BADRASHI, Y.I. – ALI, Q. – ASHRAF, M. – RASHID, M.: Seismic design characterization of RC
special moment resisting frames in Pakistan—field survey to laboratory experiments. Journal of
Engineering and Applied Sciences, 35(2), 2016, 25–32.
[3] ATES, S. – KAHYA, V. – YURDAKUL, M. – ADANUR, S.: Damages on Reinforced Concrete
Buildings due to Consecutive Earthquakes in Van. Soil Dynamics and Earthquake Engineering,
Vol. 53, 2013, pp. 109-118. doi: 10.1016/j.soildyn.2013.06.006.
[4] BILHAM, R.: Earthquakes in India and in the Himalaya: tectonic. Geodesy, and history, Ann
Geophysics, 47(2/3), 2004, 839–858.
[5] NASEER, A. – KHAN, A.N. – HUSSAIN, Z. – ALI, Q.: Observed Seismic Behavior of Buildings in
Northern Pakistan during the 2005 Kashmir Earthquake. Earthquake Spectra, Vol. 26, No. 2, 2010,
pp. 425-449. doi: 10.1193/1.3383119.
[6] ARSLAN, M.H. – KORKMAZ, H.H.: What is to be Learned from Damage and Failure of Reinforced
Concrete Structures during Recent Earthquakes in Turkey. Engineering Failure Analysis, Vol. 14:
No. 1, 2007, pp. 1-22. doi: 10.1016/j.engfailanal.2006.01.003.
[7] ERDIL, B.: Why RC Buildings Failed in the 2011 Van. Turkey, Earthquakes: Construction versus
Design Practices, Journal of Performance of Constructed Facilities, Vol. 31, 2016, No. 3, doi:
10.1061/(ASCE) CF.1943-5509.0000980.
[8] RUIZ-PINILLA, J.G. – ADAM, J.M. – PEREZ-CARCEL, R. – YUSTE, J. – MORAGUES, J.J.:
Learning from RC Building Structures Damaged by the Earthquake in Lorca. Spain, in 2011.
Engineering Failure Analysis, Vol. 68, 2016, pp. 76-86. doi: 10.1016/j.engfailanal.2016.05.013.
[9] ATES, S. – KAHYA, V. – YURDAKUL, M. – ADANUR, S.: Damages on Reinforced Concrete
Buildings due to Consecutive Earthquakes in Van. Soil Dynamics and Earthquake Engineering,
Vol. 53, 2013, pp. 109-118. doi: 10.1016/j.soildyn.2013.06.006.
[10] QUINTANA-GALLO, P. – PAMPANIN, S. – CARR, A.J. – BONELLI, P.: Shake Table Tests of
Under Designed RC Frames for the Seismic Retrofit of Buildings – Design and Similitude
Requirements of the Benchmark Specimen. Proceedings of the New Zealand Society of
Earthquake Engineering, Paper No. 39, 2010, 12 pp.
[11] STAVRIDIS, A. – KOUTROMANOS, I. – SHING, P.S.: Shake-Table Tests of a Three-Storey
Reinforced Concrete Frame with Masonry Infill Walls. Earthquake Engineering & Structural
Dynamics, Vol. 41, No. 6, 2012, pp. 1089-1108. doi: 10.1002/eqe.1174.
[12] YAVARI, S. – ELWOOD, K.J. – WU, C.L. – LIN, S.H. – HWANG, S.J. – MOEHLE, J.P.: Shaking
Table Tests on Reinforced Concrete Frames without Seismic Detailing. ACI Structural Journal,
Vol. 110, No. 6, 2013, pp. 1000-1012.
[13] SHARMA, A. – REDDY, G.R., – AND VAZE, K.K.: Shake Table Tests on a Non-Seismically
Detailed RC Frame Structure. Structural Engineering and Mechanics, Vol. 41, No. 1, 2012, pp. 1-
24. doi: 10.12989/sem.2012.41.1.001.
[14] ELWOOD, K.J. – MOEHLE, J.P.: Dynamic collapse analysis for a reinforced concrete frame
sustaining shear and axial failures. Earthquake Engineering and Structural Dynamics, 37(7),
2008, 991–1012.
[15] [15] LU, X. – LU, X.Z. – GUAN, H. – YE, L.P.: Collapse simulation of reinforced concrete high-rise
building induced by extreme earthquakes. Earthquake Engineering and Structural Dynamics,
42(5), 2012, 705–23.
[16] WANG, R.Z. – WU, C.L. – TSAI, K.C. – YANG, Y.S – LIN, B.Z.: Structural collapse analysis of
framed structures under seismic excitation. In: Proceedings of 14th world conference on
earthquake engineering, Paper No. 14-256, 2008.
[17] RIZWAN, M. – AHMAD, N. – NAEEM, KHAN. A. – QAZI, S. – AKBAR, J. – FAHAD, M.: Shake
table investigations on code noncompliant reinforced concrete frames. Alexandria Engineering
Journal, 59, 2020, 349–67, https://doi.org/10.1016/j.aej.2019.12.047.
[18] BCP: Building Code of Pakistan: Seismic Provisions. Ministry of Housing and Works, Islamabad,
Pakistan, 2007, 302 pp.
[19] UBC: Uniform Building Code. International Conference of Building Officials, 1997 Whittier, CA.
[20] ACI: American Concrete Institute. Building code requirements for structural concrete, ACI 318,
Farmington Hills, 2014, MI: ACI.You can also read