NETBRAIN CONSULTANT EDITION V5.0 - FEATURE HANDBOOK
←
→
Page content transcription
If your browser does not render page correctly, please read the page content below
NetBrain Consultant Edition v5.0
Feature Handbook

NetBrain Technologies Inc.
                  st
65 Network Drive, 1 Floor
Burlington, MA 01803

+1 800 605 7964
info@netbraintech.com
www.netbraintech.com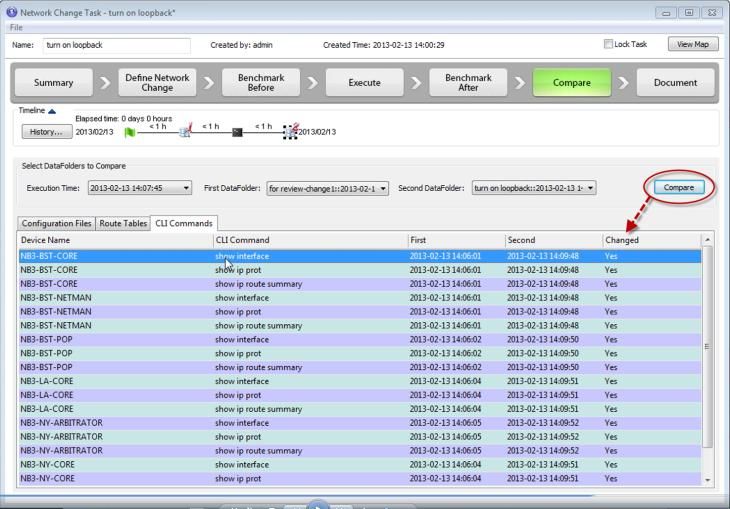
Table of Contents

Main Features                            Content                                            Page

Overview                                 Brief solution review                                3
 1.   Deep Network Discovery             Intelligence mining from the live network            5
 2.   Work on Customer Network without   Model networks with configuration files and          6
      Live Access                        CLI-Command output
 3.   Dynamic Network Mapping            Create data-driven maps on-demand                    7
 4.   Automation Procedures              Automate a wide range of tasks normally             11
                                         completed through the CLI.
 5.   Traffic Path Analysis              Visualize and analyze dynamic traffic paths         14
                                         across complex networks
 6.   Automate Network Documentation     Automate Visio, Excel and Word                      16
                                         documentation with ‘Data-Driven DCU’
 7.   Visual Monitoring & Automated      Monitor performance hotspots and                    19
      Network Troubleshooting            automate troubleshooting logic

 8.   Map-Driven Change Management       Safely execute and analyze network                  21
      (Add-on Module)                    changes with ‘Map-Driven CAD’
 9.   Network Design Analysis            Analyze network design such as routing,             24
                                         MPLS, etc.
 10. Map-Driven Task Automation          Automate data collection and analysis jobs          27
                                         without scripting

                                                 NETBRAIN Consultant Edition 5.0: FEATURE HANDBOOK   2
Overview
0.1 A Visual Workbench for On-the-Go
Consultants
Network consultants hold the most demanding
network job in the world. They often work under
tight schedules to analyze new networks with
limited documentation while relying on
customized scripts to gather data.
NetBrain Consultant Edition (CE) is designed to
make a Consultant’s job easier by providing
instant network discovery, document
automation, and visual troubleshooting.
NetBrain enables consultants to
Execute deep discovery of customer network
Automate documentation for network
assessment A visual workbench for Consultants
Analyze network design visually
Automatically troubleshoot and collect data
without scripts
0.2 Discover and Document Networks
Automatically
NetBrain leverages a state-of-the-art discovery
engine which can discover network devices and
underlying design simultaneously. The discovery
engine is extremely fast and 99% accurate,
providing a complex data model of the network.
Once a customer network is discovered,
consultants can carry out many forms of network
analysis from a map-driven environment. The
results can be documented automatically in three
main formats:
Diagrams in Visio format
Design documents in Word format
Inventory reports in Excel format Automate network documentation for assessments
If consultants have no live access to the customer
network, NetBrain model the network with
config files or output from network devices.
NETBRAIN Consultant Edition 5.0: FEATURE HANDBOOK 3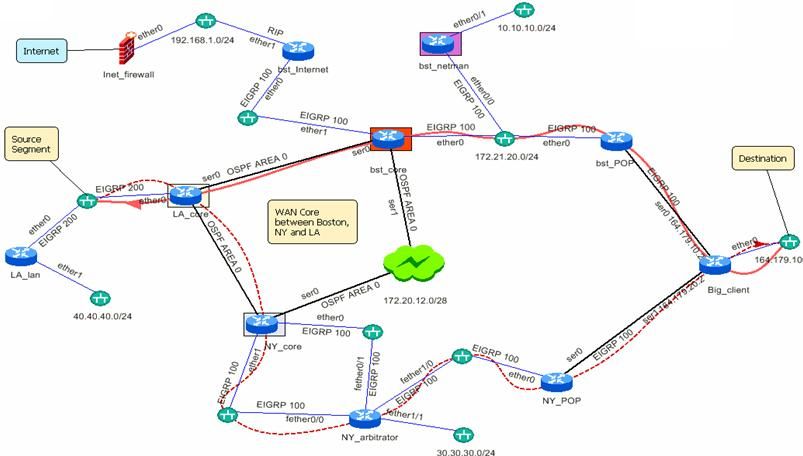
0.3 Map-Driven Network
Troubleshooting
Instead of typing commands into the CLI to
figure out what’s happening, you can
troubleshoot complex network problems in a
map-driven environment from beginning to end.
With this unique map-driven troubleshooting
tool, you can:
Map a problem area instantly through
on-demand mapping technology
Visualize performance hotspots and
up/down status directly through a color-
coded dynamic map
Analyze what’s changed in topology,
routing, configuration and traffic flow Visual Troubleshooting in action
Run Automation Procedures to
immediately find errors and problems
0.4 Map-Driven Change Management
(Add-on Module)
It is estimated that 3 out of 4 network outages
are caused by changes. Analyzing the exact
impact of any network change in a dynamic
network can be challenging. With NetBrain’s Map-driven change management workflow
Change Management Workflow, you can:
Define network changes with a
template-driven approach
Automatically push configuration
changes to multiple devices
simultaneously
Analyze the impact of changes by
comparing configuration and routing
before and after the update
Automatically Document the results
including impacted devices,
configuration changes, time stamps, and
much more.
0.5 Easy to Use
While NetBrain has over 1,000 features, all are
intuitive and easy to use because they are map-
driven. There is no need for formal training
before users can take advantage of the mapping,
troubleshooting and change assurance features.
NetBrain is easy to setup as well. Typically, setup
can be completed by end users within an hour or
two.
NETBRAIN Consultant Edition 5.0: FEATURE HANDBOOK 4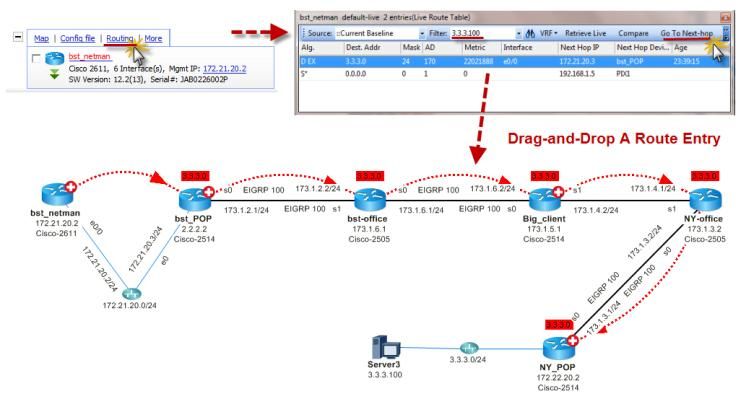
Section 1: Deep Network Discovery
1.0 Deep Network Discovery
Network consultants can benefit from the deep
discovery capability of NetBrain CE. Traditional
discovery tools use SNMP to scan and discover Discovery Capabilities At-A-Glance
customer networks. Such tools suffer accuracy Simultaneous Discovery of Network Topology and Design
and slowness issues because they require Extremely Fast Leveraging Neighbor-Walking Algorithm
Recurring Benchmark To Catch Network Changes
customer networks to be configured in an ideal
Model Network Without Live Access by Importing
way with full reachability from the discovery Configuration Files
point.
NetBrain leverages the patented neighbor-
walking discovery mechanism combined with
advanced network modeling, to discover what a
network is made of (network devices) and how it
was put together (network design). During the
discovery process, NetBrain simultaneously
analyzes the data collected from Ping, SNMP and
CLI, and decodes network design every step along
the way.
NetBrain discovery is very easy to use -often
starting with a single input of a seed router. Key
features include:
Deep network discovery – output includes
devices, topology and network design
Fastest in the industry – up to 2,000
routers, switches or firewalls per hour Neighbor-walking network discovery in action
Accurate – the logarithm algorithm ensures
nearly 99% accuracy for discovering
networked devices
Robust – capable of handling highly
fragmented networks
NETBRAIN Consultant Edition 5.0: FEATURE HANDBOOK 5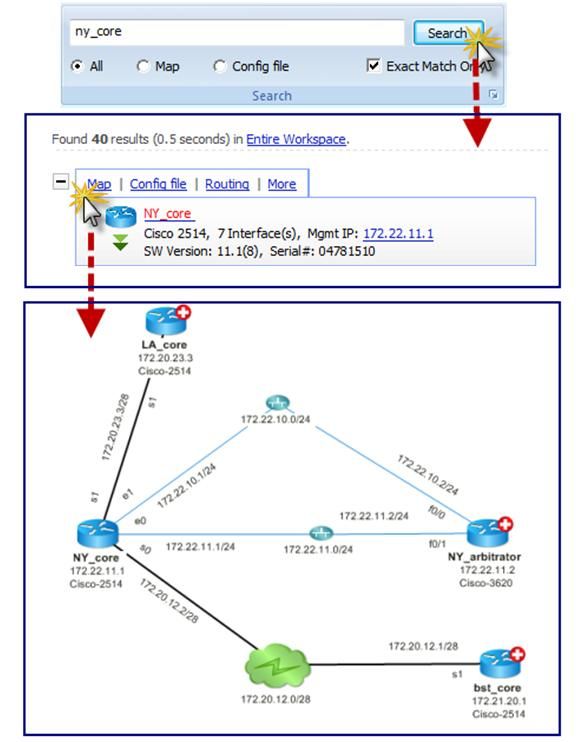
Section 2: Work on Customer Network without Live Access
2.0 Model Customer Network
From time to time, consultants may have to
work on a customer network without live
access. NetBrain CE can model a customer
network virtually, enabling consultants to finish
their network assessment work in a map-driven
interactive environment without live access.
This is made possible by:
Importing a set of configuration files
for routers, switches and firewalls from
most mainstream hardware vendors, or
Importing specific CLI-Command
output to enhance the network model
by adding L2 and Traffic Flow details
For better isolation, consultants can create a
separate local workspace for each customer Model a network from configuration files & CLI output
network.
NETBRAIN Consultant Edition 5.0: FEATURE HANDBOOK 6
Section 3: Dynamic Network Mapping
3.0 Overview: Dynamic Network
Dynamic Mapping At-A-Glance
Mapping Map around a network device
Map a group of devices or links
Instead of creating diagrams manually, dynamic Map traffic flow
maps enable Consultants to create fully- Map data centers or a LAN
annotated network diagrams instantly. Map routing tables
Dynamic maps are driven entirely by data and
represent a technological breakthrough in
network mapping:
Data included in maps is automatically
collected by the system (including
network topology and design data)
Map creation is automated with simple
user interaction
When network changes occur, maps can
be updated automatically
Data-driven map of a device and its neighbors
3.1 Map from a Device or IP Address
With dynamic mapping technology, you can
simply enter the name of the problem device in
the search dialog, and then click the “map”
button to create a fully-annotated diagram of
the problem area.
You may index the network with a variety of
different search strings:
IP addresses
Interface names
Text strings in a config file (e.g. “eigrp
100”)
Network object model (e.g. “Cisco 5505”)
Map a problem area when troubleshooting
NETBRAIN Consultant Edition 5.0: FEATURE HANDBOOK 7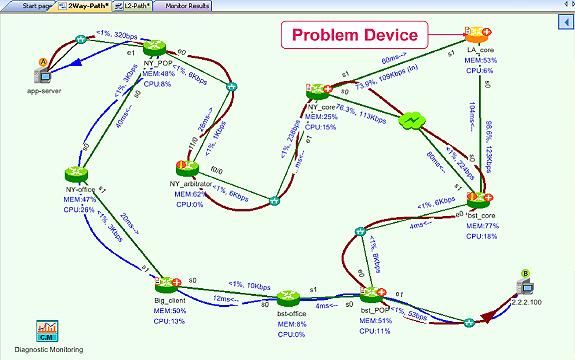
3.2 Map a Traffic Path between A & B
Most network problems are related to
connectivity between point A and B. But
mapping out the A/B path is a labor-intensive
manual task and users have to do again and
again.
With dynamic maps, mapping a traffic path is as
simple as entering two endpoints (via IP or
hostname) and an L3 and L2 map of the traffic
flow is automatically created.
Refer to section 5.1 for more details about Map L3 and L2 traffic paths
NetBrain’s path analysis capability.
3.3 Map a Subnet or VLAN
For troubleshooting or network inventory, users
may need a map of a subnet or VLAN. With
NetBrain, a dynamic map for this purpose can
be created instantly by entering the subnet IP
address (e.g. 192.168.1.0/24) or selecting a
VLAN name from a switch’s neighbor dialog.
Dynamic map of VLAN 192.168.1.0/24
3.4 Map a Data Center or a Site
A complex data center may include thousands
of network devices. Building a comprehensive
inventory report and network map can be a
daunting task.
You can use NetBrain to automate this task:
Execute a discovery of the entire network
or just the data center of interest
Map all devices that belong to one site or
data center automatically (multiple maps
may be created)
All network devices (routers, switches, firewalls Dynamic map of a data center (showing partial picture)
and end systems) are included.
NETBRAIN Consultant Edition 5.0: FEATURE HANDBOOK 8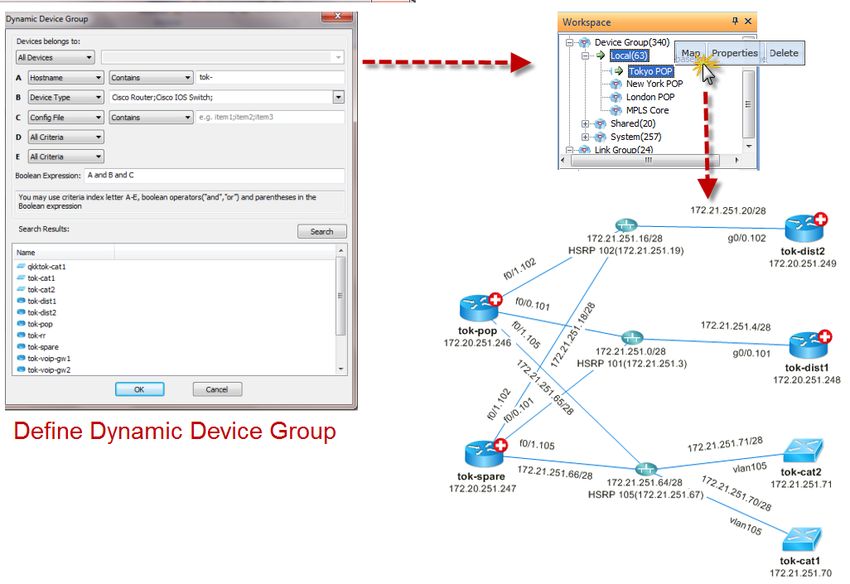
3.5 Map Entire Network with Logical
Sites
For networks with thousands of routers,
switches and firewalls, you can use a data-
driven “site” to organize and map the network.
For example, you can:
Map an entire network showcasing the
hierarchical relationships between all sites
Map WAN connectivity with sites and A dynamic map of the entire network enables quick drill-down
border routers
Map traffic paths using sites to better
understand the flow
You can define sites by a set of search criteria,
or by defining the border links. When your
network changes, all sites established will
dynamically adapt.
Use sites to abstract WAN connectivity
Use sites to abstract traffic path
3.6 Map Routing Tables
To visualize how traffic is routed towards a
destination, users can simply type the
destination IP into NetBrain’s routing table
toolkit, and drag and drop the matched routing
table entry into a map.
The routing table information is retrieved from
either the live network, or from using historical
data captured by the benchmark engine. As a
result, users can visually discover the difference
between live and historical routing tables.
Map routing a table entry to a destination dynamically
NETBRAIN Consultant Edition 5.0: FEATURE HANDBOOK 9
3.7 Map a Logical Group of Devices or
Links
Devices with common attributes can be
grouped together to form a device group.
Common attributes include:
Characters in the hostname (e.g. all
Tokyo POP routers have a hostname
starting with tok-)
Configuration file patterns
Vendor/Models
O.S. Versions
SNMP parameters, etc.
Similarly, users can group links together based
on common attributes of the LAN/WAN links
and create dynamic maps. Map dynamic device group –Tokyo POP
3.8 Dynamic Maps with Variables
Dynamic maps of device groups/link groups
may include user-defined variables. This is a
powerful way for large organizations to reduce
the amount of pre-defined maps. For example,
create a set of OSPF maps – one for each area;
you can create a single dynamic map with a
variable “area_number”. Users will define the
value of this variable right before they need an
actual map. At that time, NetBrain will calculate
map elements and create the final map.
Users can use many fields to define the search Create maps based on user-input variables (OSPF area 0 map)
criteria of a link group/device group, to define a
map (e.g. vendor model number, O.S version,
routing protocol, VRF, etc
NETBRAIN Consultant Edition 5.0: FEATURE HANDBOOK 10Section 4: Automation Procedures
4.0 Overview: Automation Procedures
Leverage Automation Procedures to:
Many tasks associated with network Troubleshoot problems more than 3x faster
troubleshooting and maintenance are labor- Verify the impacts of network changes
intensive and error-prone. Manually accessing Run compliance checks
information from the CLI is a slow and Map a traffic path through firewalls or load balancers
antiquated process that consumes a lot of an Collect customized device inventory data
engineer’s time.
Automation Procedures can alleviate this
burden by automating any series of actions
normally completed manually through the CLI.
They can maximize efficiency on a wide range
of tasks including:
Troubleshooting
Change Verification
Compliance
Mapping
Traffic Path Analysis
Inventory
NetBrain includes hundreds of procedures ‘out
of the box’ and users can easily customize their
own for any network task.
Sample Automation Procedure (Is Speed/Duplex Mismatched)
4.1 Troubleshooting Procedure:
‘Are Interface Errors Increasing’
Sometimes the logic required to troubleshoot
network issues is simple, but trying to identify
the problematic device one at a time can be
difficult. This procedure will check every device
in the map and report if there are any
increasing interface errors.
Logic: Retrieve ‘show interfaces’ command
twice and calculate the delta of each
Procedure example: Automatically detect interface errors
parameter. If delta is greater than 0, report
error and highlight it on the map.
NETBRAIN Consultant Edition 5.0: FEATURE HANDBOOK 114.2 Compliance Procedure:
‘Is Password Encryption Enabled’
Compliance audits generally take a lot of
time, especially on large networks with
tens of thousands of lines of configuration.
This compliance procedure will check
whether the device password encryption
service is enabled for every specified
device
Logic: Search no service password-
encryption command in the configuration Procedure example: Is password encryption enabled
file of every specified device.
4.3 Historical Analysis Procedure:
‘Have EIGRP Neighbors Changed’
Often times, an important troubleshooting
step is to determine what changes have
occurred in the network. This procedure
will automatically detect if EIGRP
neighbors have changed since a specified
baseline date.
Logic:
Determine if EIGRP is configured on
each device
Parse EIGRP parameters and
compare with historical data
Highlight changes in the map Procedure example: Have EIGRP neighbors changed
4.4 Mapping Procedure:
‘Map Multicasting Distribution Tree’
Multicasting is notoriously difficult to
visualize because it is dynamic in nature.
Due to its complexity, many organizations
have only one or two individuals who are
capable of troubleshooting multicast
problems. A multicasting specialist can
build a procedure once for anyone to use.
Logic: Leverage the following commands
to map the downstream source tree:
show ip mroute Procedure example: Map Multicasting Distribution Tree
show ip pim neighbor
show ip igmp group
NETBRAIN Consultant Edition 5.0: FEATURE HANDBOOK 124.5 Build Your Own Procedures
In Minutes
NetBrain comes with hundreds of built-in
procedures but there are virtually
unlimited uses for network automation.
You can create your own procedures with
a simple ‘sample-driven’ platform. There
are three components: Three components to building your own Automation Procedures
Probes – Define how to retrieve live
data from the network
Parsers – Define how to parse CLI
output
Triggers – Define how to analyze the
results and provide user feedback
4.6 Built Once, Used Anywhere
Most user-written scripts work on a certain
set of devices and cannot be applied to any
other part of the network. Automation
Procedures are executable files that can be
run on any part of the network, and can be
customized to work for any device with a
CLI. Domain experts can write their own
procedures and share them with the entire
team for use anywhere.
NETBRAIN Consultant Edition 5.0: FEATURE HANDBOOK 13Section 5: Traffic Path Analysis
5.0 Overview: Traffic Path Analysis
Traffic Path Analysis At-A-Glance
Networks are designed to move traffic from Map live traffic flow
point A to point B. NetBrain allows users to Map historical traffic flow
visualize and analyze these dynamic traffic Use NetFlow to drill down top-talkers
paths across complex networks, taking into Use IP Accounting to analyze traffic flow
account:
Dynamic and static routing
Network address translation (NAT)
Both L3 and L2 traffic flow
NetBrain provides a historic view of traffic
paths, so that users can visually compare the
traffic flow between the past and the present.
Traffic path analysis can save a tremendous
amount of time throughout network
troubleshooting process and network
assessment.
Traffic path analysis between A and B
5.1 Map Live Traffic Paths
In real-time troubleshooting, users need to
know how traffic moves across the live
network. Live traffic path analysis retrieves live
routing tables, configuration files, and
CAM/ARP tables to map both L3 and L2 traffic
flow.
The network design behind traffic paths is also
decoded, including:
ACL, QoS, NAT
Dynamic Routing, Static Routing and
PBR
VRF, Multicasting
Switch port speed and duplex settings
along the path
Live traffic paths (L3/L2) use live network data
NETBRAIN Consultant Edition 5.0: FEATURE HANDBOOK 145.2 Map Historical Traffic Paths
A key question to answer when analyzing a
traffic path is “what was the path like before?”
Leveraging benchmark data, users can map L3
and L2 traffic paths using cached data.
By overlaying two paths in single map (one for
the live and one for the historical path) users
can visualize the changes in traffic flow.
Compare the historic path with the live path
5.3 Enhance Traffic Path Logic with
Automation Procedures
With Automation Procedures, NetBrain’s traffic
path mapping capabilities become much more
versatile. Traditionally, mapping across devices
like firewalls and load balancers has been a
difficult task making network visualization
difficult. Procedures allow for the customization
of mapping through such devices. See Section 3
to learn more about Automation Procedures.
Map MPLS network with procedures
5.4 Use Netflow to Drill down Top-
Talkers
Besides analyzing point-to-point traffic flow (A
to B), NetBrain can leverage NetFlow
configured in Cisco devices to provide a view of
multiple point-to-point conversations off a
LAN/WAN link.
The conversation can be sorted by IP address,
port and bandwidth utilization. The
conversation pair can be mapped out in real-
time as well.
Use Netflow data to assist traffic path analysis
If NetFlow is not supported, NetBrain can
leverage IP Accounting technology to provide
similar analysis.
NETBRAIN Consultant Edition 5.0: FEATURE HANDBOOK 15Section 6: Automate Network Documentation
6.0 Overview: Automate Network
Automate Network Documentation At-a-Glance
Documentation Discover network topology and design
Create diagrams and reports dynamically
Section 2 addressed many ways to create Keep documentation updated with recurring benchmarks
dynamic maps. By leveraging the data model
created from the discovery, several other types
of network documentation can be created and
automatically updated. This is possible with
NetBrain’s ‘Data-Driven DCU’ approach:
Discover the live network
Create documentation dynamically
Update documents automatically
NetBrain’s Data-Driven DCU approach to documentation
6.1 Types of Automated
Documentation
Users can automatically create various types of
network documentation, including:
Network diagrams in Visio
Design documents in Word
Inventory reports in Excel
When the live network changes, NetBrain’s
benchmark engine will capture those changes
and automatically update the backend data
model. Users can then automatically update
Automatically export network documentation
the exported documents.
6.2 Build Visio Diagrams
Automatically
Dynamic Qmaps are created inside NetBrain
through automation. From time to time, users
may need static Visio diagrams for
collaboration purposes. NetBrain provides a
one-click export feature to export any Qmap to
a fully-editable Visio diagram.
Conversely, NetBrain can convert a static Visio
diagram into a dynamic Qmap, so that users
can benefit from map-driven troubleshooting
and design features. Visio diagram exported from a Qmap
NETBRAIN Consultant Edition 5.0: FEATURE HANDBOOK 166.3 Create Design or Assessment
Documents in Word
You can automate the creation of network
design or network assessment documents using
a template-driven approach. First, users will
create a dynamic map to define the area of the
network to be documented; then select from a
set of content templates outlining what to
include in the final document. NetBrain’s
document engine will create the final Word
document and format it based on the selected
style.
The content is highly customizable, leveraging
Automated network design/assessment documentation
the richness of the NetBrain model and a user-
extendable design reader technology. For
example, users can create documentation for:
Assessment of specific network
configuration, such as QoS configuration,
VoIP configuration, Routing, etc.
Network design review
Troubleshooting escalation
6.4 Create Inventory Reports in Excel
Leveraging NetBrain’s discovery engine, the
asset reports produced hold the industry’s most
comprehensive network inventory data. Asset
reports are exportable to Excel, where data can
be further analyzed.
Users can extend built-in data fields and import
values to new fields using the hostname as the
key.
Asset reports are a one-stop shop for network inventory data
NETBRAIN Consultant Edition 5.0: FEATURE HANDBOOK 176.5 Schedule Automated Updates of
Visio or Qmap
Network change is constant. NetBrain’s
benchmark engine will automatically update
the backend data model to reflect those
changes. The same can be done for Qmaps and
Visio diagrams saved on local disks. Users can
schedule the update of selected maps daily,
weekly or monthly.
As a result, users do not need to manually
update network diagrams after network
changes occur.
Schedule automatic map updates and Visio exports
NETBRAIN Consultant Edition 5.0: FEATURE HANDBOOK 18Section 7: Visual Monitoring & Automated Network Troubleshooting
7.0 Overview: Visual Network
Visual Network Troubleshooting At-A-Glance
Monitoring & Troubleshooting Use dynamic maps to visualize problem areas
Run performance monitoring from the map
NetBrain can accelerate the troubleshooting Run Automation Procedures to drill-down and uncover hard-to-
process for virtually any type of network find issues
problem.
By integrating network visualization, data
analysis, and CLI automation in a map-driven
environment, NetBrain troubleshooting greatly
simplifies the troubleshooting process for all
consultants
Visual troubleshooting heatmap
7.1 Execute Network Monitoring from
a Map
Visual network monitoring is different from
traditional network monitoring:
It uses a dynamic map as the launching
pad to start and stop monitoring
Real-time data collected from the live
network is displayed in the map, along
with alarms
Visual network monitoring can poll many types
of data such as up/down status, link error, link
delay, packet drop, etc. The interval and alarm
thresholds are configurable.
The benefit of visual network monitoring is Monitor connectivity and performance from a Qmap
that users can quickly spot connectivity or
performance issues – right from the map.
NETBRAIN Consultant Edition 5.0: FEATURE HANDBOOK 197.2 Automation Procedures to Drill-
Down Root Cause
NetBrain’s revolutionary procedures can
automate any series of actions normally
completed manually using the CLI. With
procedures, any troubleshooting logic can be
translated into an executable file format for a
repeatable and shareable process.
Hundreds of procedures exist ‘out of the box’
and countless others can be easily customized
for virtually any network task. See Section 3 for
more details about Automation Procedures.
Example NetBrain Procedure: Detect Speed/Duplex Mismatches
NETBRAIN Consultant Edition 5.0: FEATURE HANDBOOK 20Section 8: Map-Driven Change Management (Add-On Module)
8.0 Overview: Map-Driven Change
Management
Change Management Workflow At-a-Glance:
Typically, 3 out of 4 network outages are caused Automatically push config changes
by network change. Engineers can prevent Analyze changes in routing, configuration, traffic flow, etc.
human-error induced outages by leveraging Automatically document the results
NetBrain’s unique Change Management
Workflow to automate network changes and
instantly analyze their impact. This is achieved
by:
Using dynamic maps to document
network changes visually
Benchmarking the network before and
after changes
Automatically pushing config changes
to multiple devices simultaneously
Analyzing the total impact of network
changes through before/after
comparison
Without NetBrain, engineers rely on manual Change management workflow with ‘Map-Driven CAD’
methods to selectively analyze the impact of
network changes. Any oversight could result in
network outages after the change window.
8.1 Use Dynamic Maps to Define
Network Changes
The typical change management process
includes a design review step. But without
proper documentation of a proposed design,
the design review process becomes a rubber
stamp.
With NetBrain, engineers can use dynamic
maps to document complex network design,
making it:
Easy to create - mostly by automation
Visual – map-driven
Portable – everything surrounding the
map is self-contained
Define network changes by dragging-and-dropping config files into
NetBrain
Users can start by dragging-and-dropping a set
of configuration files into NetBrain to model the
proposed network changes.
NETBRAIN Consultant Edition 5.0: FEATURE HANDBOOK 218.2 Benchmark the Network Before
and After Changes
To understand the impact of network changes,
users must record the network status before
and after changes are made. Traditionally, this
is achieved by manually collecting and
analyzing the output from CLI commands for
each relevant device.
NetBrain can completely automate this
process. Not only is the collection of data
automated, but analysis of the data is
automated as well. This can save a tremendous
amount of time and reduce human errors.
Benchmark network status before and after changes
8.3 Automatically Push Configuration
Changes
The process of executing network changes can
be very labor-intensive and error-prone,
especially when performed across a large set of
devices. It is not uncommon to forget an
interface, or ‘fat-finger’ a command.
NetBrain can significantly reduce this burden
with automated push-config. Users can easily
identify devices to be impacted, and then
define changes using the built-in config
template. To mitigate the risk of configuration
errors, users can also specify a rollback
template. After issuing the command to Automatically push configuration changes
execute changes, users can watch the
configuration happen live and stop or pause the
progress if necessary.
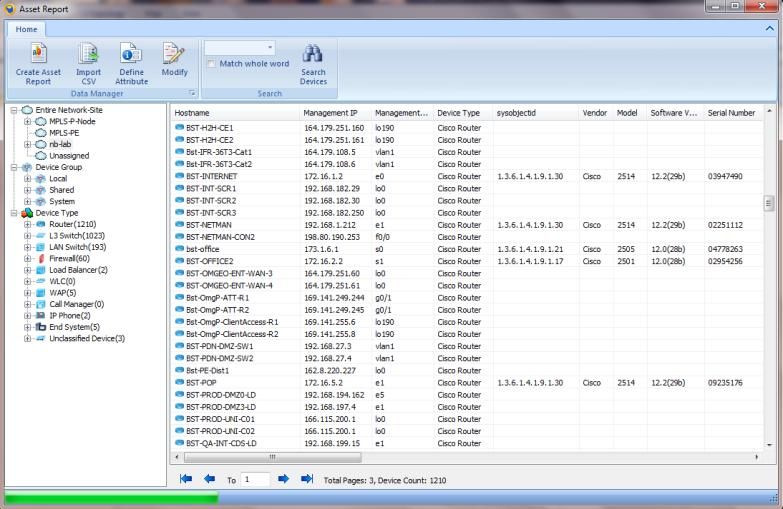
NETBRAIN Consultant Edition 5.0: FEATURE HANDBOOK 228.4 Analyze the Total Impact of
Changes
Armed with benchmark data both before and
after the configuration update, an in depth
analysis of the changes can be performed
automatically. This includes:
Configuration changes at each and every
device
Routing table changes at each and every
device
Traffic path changes
Topology changes in L2 and L3
Changes in any CLI command output
By automating the change verification process,
Compare configuration, routing tables, etc. to discover changes
users can spend time correcting problems
before outages hit end users.
8.5 Document the Results
NetBrain’s automated documentation platform
can be leveraged to build customized
documentation for the network change. This
includes:
Impacted devices
List of configuration changes
Review history
A map of the changes
Automatically document results of the change
NETBRAIN Consultant Edition 5.0: FEATURE HANDBOOK 23Section 9: Network Design Analysis
9.0 Overview: Map-Driven Design
Design Analysis At-A-Glance
Analysis Analyze routing protocol design
Analyze multicasting design
Network design is often embedded into Analyze MPLS VRF design
millions of lines of configuration files. NetBrain Analyze VLAN design
enables engineers to visualize and analyze Use Design Reader to analyze various network designs
complex network design through dynamic
maps, greatly reducing complexity while
troubleshooting and upgrading. The type of
design NetBrain can visually analyze includes:
Dynamic routing protocols such as
BGP, OSPF, EIGRP, ISIS and RIP
Multicasting design
MPLS VRF design
VLAN design and Spanning-Tree
status
Over 100 typical designs based on
customizable design templates,
including QoS, VoIP, security, etc.
Map-driven design analysis
9.1 Analyze Routing Design
NetBrain can automatically decode routing
design such as BGP, OSPF, ISIS, EIGRP and RIP.
From any dynamic map, NetBrain annotates
the routing design by color coding links (for IGP
protocol) or devices (for BGP protocol). Design
Reader templates for each routing protocol
allows users to drill-down to the details of each
protocol from within a map. If needed,
customers can customize templates to yield
more relevant analysis.
Analyze routing design
NETBRAIN Consultant Edition 5.0: FEATURE HANDBOOK 249.2 Analyze Multicasting Design
NetBrain automatically decodes multicasting
design such as PIM-DM, PIM-SM and PIM-SDM.
The results are annotated in a related dynamic
map.
For multicasting RPF analysis, NetBrain provides
a toolkit called route propagation analysis,
which will evaluate unicast routes towards the
multicasting source and map the multicasting
forwarding tree.
Analyze multicasting design
9.3 Analyze MPLS VRF Design
For any devices configured with MPLS VRF,
NetBrain can annotate the VRF alignment in a
relevant dynamic map. When retrieving route
tables, NetBrain is VRF-aware as well.
For complex path calculation, NetBrain will take
into account VRF design.
Analyze VRF design
VRF route table
NETBRAIN Consultant Edition 5.0: FEATURE HANDBOOK 259.4 Analyze VLAN Design
NetBrain understands VLAN design across LAN
infrastructure and is capable of annotating
VLAN design from any L2 dynamic map. To
make it easier to understand, a L2 VLAN is
denoted with a corresponding L3 network
segment.
NetBrain can look into the live spanning-tree
status and annotate any port that is blocked for
each VLAN.
If a port is configured with voice VLAN, it can be
highlighted so users can identify proper VoIP Analyze VLAN and spanning-tree
phone connections.
Highlight a SPT blocked port
9.5 Design Reader to Drill-Down
Network Design
Design Reader is a template-based
configuration file analyzer. There are over 100
built-in templates to analyze network design
such as QoS, VoIP, Multicasting, Routing, ACL
for routers, switches and firewalls. Design
Reader includes built-in sample maps, which
enables users to share best practices about
certain technologies.
Users can author their own Design Reader
templates through a simple scripting language.
Use Design Reader to analyze network design
NETBRAIN Consultant Edition 5.0: FEATURE HANDBOOK 26Section 10: Map-Driven Task Automation
10.0 Automate Data Collection without
Scripting Map-Driven Task Automation At-A-Glance
Collect network data automatically without scripting
To collect network data from the live network Benchmark network before/after changes
automatically, consultants often have to rely on Analyze the change of routing, configuration, traffic flow, etc.
scripting – a complex and error-prone process. Discover topology changes
NetBrain CE has a powerful map-driven
automation capability to relieve consultants
from writing scripts. You can:
Launch automated data collection from
within a dynamic map with one-click
Have many ways to construct live
commands to issue across multiple
network devices. E.g. by defining “show
interface $visible_interface”, NetBrain
will expand the command according to
the interfaces included in the map
No longer worry about multiple login
credentials. The system will automate
the selection process behind the scenes. Automate network data collection from a map (without scripting)
Access collected data stored inside the
dynamic maps, making it is easy to
review and annotate
Further, using NetBrain to automate
data collection will simplify follow-up
data analysis, because NetBrain parses
many network data types after
collection and provides an add-on
toolkit for comparative analysis. For
example, Consultants can use NetBrain
to compare two versions of routing
tables to discover and map route
changes.
Live data collected is stored inside maps and is easy to annotate
NETBRAIN Consultant Edition 5.0: FEATURE HANDBOOK 27You can also read