COVID-19 European Hospital Surveillance: Fourth Bulletin
←
→
Page content transcription
If your browser does not render page correctly, please read the page content below
This project has received funding
from the European Union’s Horizon 2020
research and innovation programme
under grant agreement No 101003673

I-MOVE-COVID-19 Network
Multidisciplinary European network for research, prevention and control of the COVID-19
pandemic

COVID-19 European Hospital Surveillance:
Fourth Bulletin
JUNE 2021

I-MOVE-COVID-19 Network
WP3 coordinated by Public Health Scotland

Authors:
Damilola Mokogwu (1), Mark Hamilton (1), Heather Mutch (1), Ciaran Harvey (1), Angela Rose (2),
Georgia Ladbury (1).

Affiliations: (1) Public Health Scotland; (2) Epiconcept
DOI: 10.5281/zenodo.5084787

1|Page
Contents
Summary................................................................................................................................................. 4
Background ............................................................................................................................................. 6
   Participating sites ................................................................................................................................ 6
   Data submission and selection ........................................................................................................... 6
Section One – Basic Epidemiology .......................................................................................................... 9
   Methodology....................................................................................................................................... 9
   Cases over time ................................................................................................................................. 11
   Demographics ................................................................................................................................... 17
Section Two – Clinical Characteristics.................................................................................................. 23
   Methodology..................................................................................................................................... 23
   Chronic conditions ............................................................................................................................ 25
   Symptoms ......................................................................................................................................... 27
Section Three - Patient Outcomes ....................................................................................................... 28
   Methodology..................................................................................................................................... 28
   Length of stay, ICU admission and deaths ........................................................................................ 31
   Comparison of patient outcome in first vs second epidemic waves ................................................ 34
Strengths and limitations of I-MOVE-COVID19 hospital surveillance ................................................ 35
Annexes ................................................................................................................................................ 36
1.1.       Annex A. The I-MOVE-COVID-19 project ................................................................................. 36
1.2.       Annex B. Methods .................................................................................................................... 37
1.3.       Annex C. Case definitions ......................................................................................................... 38

2|Page
Abbreviations

AL              Albania
BE              Belgium
COVID-19        Coronavirus disease 2019
EEA             European Economic Area
ECDC            European Centre for Disease Prevention and Control
EMCO            Extracorporeal membrane oxygenation
EN              England
ES              Spain (Region of Granada and Aragon)
EU              European Union
FR-V            France ViVI
FR-R            France I-REIVAC
GP              General Practitioner
HCW             Healthcare Worker
HDU             High Dependency Unit
ICD             International Classification of Diseases
ICU             Intensive Care Unit
ILI             Influenza-Like Illness
I-MOVE          Influenza – Monitoring Vaccine Effectiveness in Europe
LT              Lithuania
NA              Navarra region, Spain
PT              Portugal
RO              Romania
RT- PCR         Real-Time Polymerase Chain Reaction
SARI            Severe Acute Respiratory Infection
SARS-CoV-2      Severe Acute Respiratory Syndrome – Coronavirus 2
SC              Scotland
WP-3            Work Package 3

3|Page
Summary
This fourth surveillance report summarises information from the Influenza – Monitoring Vaccine
Effectiveness in Europe - Coronavirus Disease 2019 (I-MOVE-COVID-19) hospital surveillance network.
The I-MOVE-COVID-19 hospital surveillance aims to reinforce and complement the COVID-19
epidemiological data in the EU/EEA and the UK that are compiled and reported by the European Centre
for Disease Prevention and Control (ECDC).

Surveillance data are provided by 11 participating hospital surveillance sites in the nine European
countries that are part of the I-MOVE-COVID-19 network. Hospitalised patients with confirmed,
probable or suspected SARS-CoV-2 virus infection are included as COVID-19 cases. Data are collected
following a generic protocol. Differences between countries occur in the range and completeness of
data collected because of the differences in health care systems, hospital admission policy, or coding
of data.

A total of 92,120 COVID-19 cases were reported to the surveillance system between 01 February 2020
and 31 March 2021 (90,161 (98%) laboratory confirmed, 258 (0.3%) probable and 1,701 (1.8%)
suspected). Of these, 56,050 (61%) were reported from England and 23,264 (25%) from Scotland (both
of which are the only sites to submit national data). For the purposes of this bulletin, hospitals were
sampled randomly from the England and Scotland national submissions, to ensure that these countries
are not over-represented in the dataset; this is in contrast to previous bulletins which analysed the
entire pooled dataset.

This bulletin focuses on the second wave of the pandemic, starting in late summer 20201. Note that the
start of the second wave varied by country, and week of start for each participating site has been
defined by inspecting the graph for that site.

    •    Approximately 8,051 (54%) patients were male and 6,815 (46%) were female.

    •    The median age was 68 years, range 0–104 years (n=14,900).

    •    Patients with one underlying chronic condition represented a higher proportion of hospital
         admissions (N=2,745; 32%), ICU/HDU admissions (N=281; 27%), and deaths (N=353; 22%) vs
         patients with no conditions (N=899 (10%) hospital admissions; N=88 (8%) ICU/HDU admissions;
         N=30 (2%) deaths). These figures were higher still for patients with two or more underlying
         health conditions (N=5,072 (58%) hospital admissions; N=684 (65%) ICU/HDU admissions;
         N=1,230 (76%) deaths).

1 Although the bulletin focuses on the second wave of the pandemic, patient outcomes in the first and second wave are
compared in the last section.

4|Page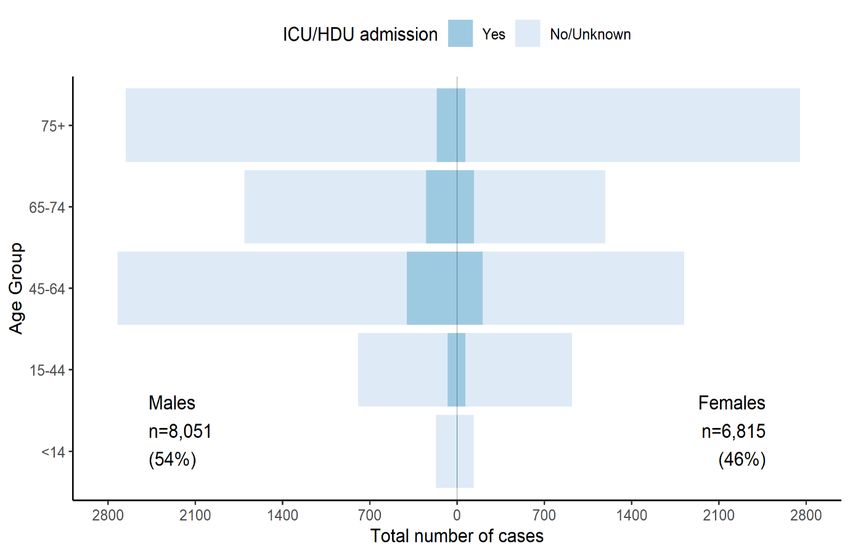
•   The most commonly reported underlying chronic conditions were hypertension (N=4,025;
      42%), obesity (N= 2,241; 29%) and heart disease (N=2,742; 27%).

  •   Almost all confirmed COVID-19 cases from the 10 sites reporting symptoms presented with
      respiratory symptoms (at or pre-admission); (N=4,658; 97%). Febrile illness was also very
      common (N=2,496; 87%); while over two-thirds had neurological symptoms (N=1,874; 67%)
      and almost half experienced gastrointestinal symptoms (N=1,624; 49%).

  •   The most frequently reported symptom was shortness of breath (N=3,593; 71%)), followed by
      cough (N=3,298; 69%) and general deterioration (N=2,252; 65%).
  •   Almost three-quarters of patients were admitted within 8 days of onset (76%). The median
      length of hospital stay was 9 days.

  •   1,239 (12%) of COVID-19 cases required ICU/HDU admission and 1,818 (18%) were reported to
      have died in hospital.

  •   ICU admissions and deaths reduced significantly from the first wave to the second in both sexes
      and all age groups, apart from the under 14s and over 75s.

5|Page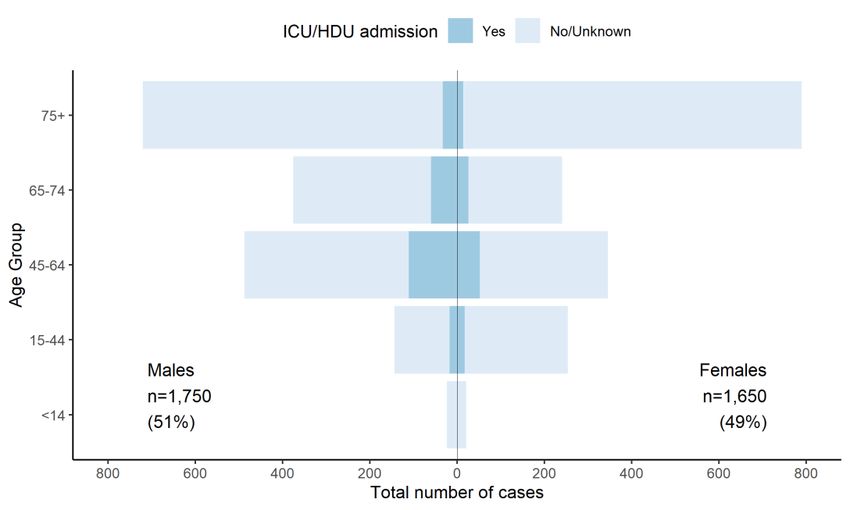
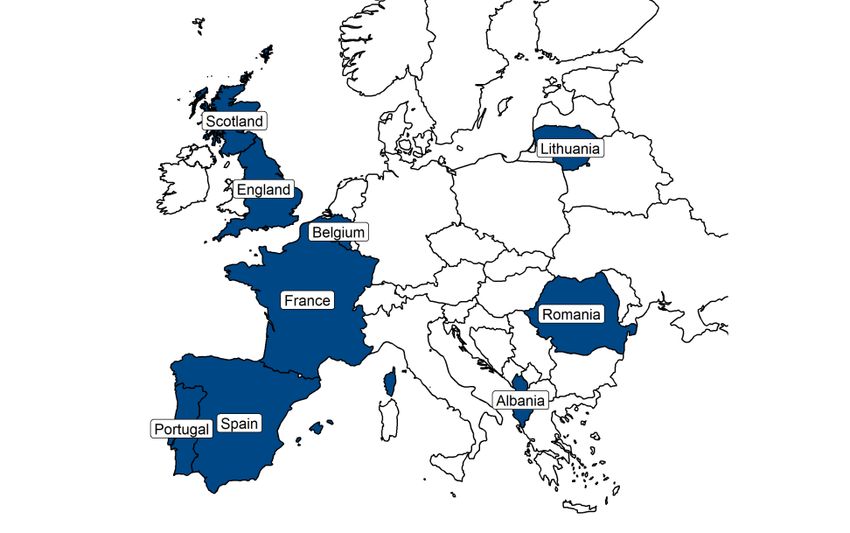
Background

Participating sites
The I-MOVE-COVID-19 Work Package 3 (WP3) hospital surveillance is coordinated by Public Health
Scotland (PHS), in collaboration with Epiconcept. The network comprises 11 surveillance sites in nine
European countries: Albania, England, Scotland, and six EU Member States (Belgium, France, Lithuania,
Portugal, Romania, and Spain) (Figure 1). Both Spain and France have two separate participating sites
in different areas/regions of the country.

Figure 1: Map of countries participating in I-MOVE-COVID-19 WP3 hospital surveillance
(Countries which submitted data for this report are coloured in blue in the map)

Data submission and selection
Sites submit surveillance data securely to Epiconcept every quarter for cleaning and pooling; the
anonymised pooled dataset is then analysed by PHS. Table 1 describes the participating sites and the
data they have contributed to the surveillance to date2. Most sites generate the surveillance data using
surveillance forms implemented at a small number of designated hospitals; however, surveillance data
for both England and Scotland is generated through the linkage of routinely collected national datasets.
For this reason, data contributed by England and Scotland consistently dominates the pooled dataset.
In addition, in England, COVID-19 reporting is mandatory for patients admitted to ICU, but not
mandatory for all hospitalised cases. For this reason, data from England tends to be skewed towards
more severe outcomes (i.e. a higher percentage of ICU patients).
In past bulletins, these challenges have been addressed by presenting data analyses both including
English data and excluding English data; however, this did not allow addressing the over-representation
of Scottish data, and precluded having a balanced representation from both of these UK countries. For
this bulletin, a different approach was taken, whereby random samples of both English and Scottish

2
The period for which data were submitted do not necessarily reflect the total duration of the epidemic in that country.

6|Page
data were selected for analysis. These samples may differ in each section of the report according to the
surveillance theme being addressed.

7|Page
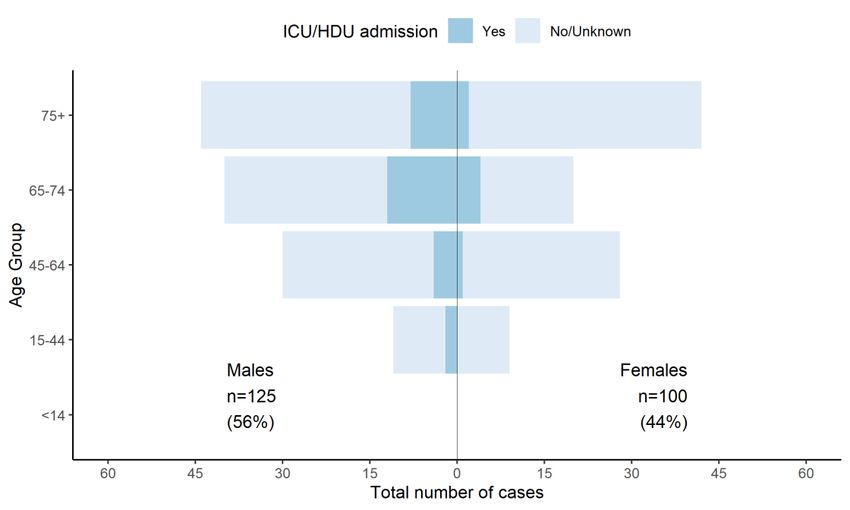
Table 1 Countries participating in I-MOVE-COVID-19 (WP3) hospital surveillance and their respective contribution
to this report between 01 Feb 2020 and 31 March 2021

 Country          Region          Participating     Number of    Admission of first     Admission of last
                                  hospitals          cases (%)   reported case           reported case

                                                                 Date          Week   Date
                                                                                      Week
 Albania (AL)              -      Two hospitals        1,308     20 Feb 2020     8    28 Feb 2021     08
                                                      (1.4%)

 Belgium (BE)              -      One hospital         1,012     21 Feb 2020     8    29 Mar 2021     13
                                                      (1.1%)
 England (EN)     Nationwide      All hospitals,       56,050    15 Mar 2020     11   31 Mar 2021     13
                                  including           (60.8%)
                                  mandatory
                                  reporting from
                                  ICUs/HDUs

 France (FR)      Two sites:

                  FR-R            Five hospitals       1,286     01 Feb 2020     5    31 Mar 2021     13
                  (REIVAC)                            (1.4%)

                                  Two hospitals,
                  FR-V                                  20       07 May 2020     19   22 Oct 2020     43
                  (ViVI)                              (0.0%)

 Lithuania (LT)            -      Two hospitals        627       07 Mar 2020     10   30 Mar 2021     13
                                                      (0.7%)
 Portugal (PT)             -      Three hospitals      714       13 Feb 2020     07   26 Mar 2021     12
                                                      (0.8%)
 Romania (RO)              -      Two hospitals,       395       10 Mar 2020     11   31 Mar 2021     13
                                                      (0.4%)
 Scotland (SC)    Nationwide      All hospitals        23,264    03 Mar 2020     10   31 Mar 2021     13
                                                      (25.3%)
 Spain (ES)       Two sites:

                  ES              Two hospitals        2,586     20 Feb 2020     08   31 Mar 2021     13
                                                      (2.8%)

                  NA              Navarra region:      4,858     06 Feb 2020     6    31 Mar 2021     13
                                  six hospitals       (5.3%)

 Total                                                92,120     01 Feb 2020     5    31 Mar 2021     13

8|Page
Section One – Basic Epidemiology

Methodology

    •   Cases included

For this part of the analysis, confirmed, probable and suspected cases were included, and records
missing key variables such as age, sex, or dates of onset/discharge were not dropped.

    •   Selection of EN cases

In order to address the problems of over-representation and of bias towards ICU admissions in the
English dataset, the proportion of hospital admissions which were admitted to ICU was calculated for
each contributing hospital. Hospitals reporting less than 6% and more than 29% ICU admissions
(N=29,568) were discarded, due to the high likelihood that these hospitals were only contributing
mandatorily reportable data or not contributing enough to represent the true ICU admissions overall
(i.e. not representative of the average ICU admissions). This left 22 hospitals reporting an ICU admission
rate of between 6% and 29%. Five of these hospitals were then randomly selected, and all cases
reported by these hospitals included in the sample for analysis.

    •   Selection of SC cases

Twenty percent of the cases reported in the overall dataset supplied by Scotland were randomly
selected for inclusion in the analysis.

    •   Selection of second wave cases

Case numbers were plotted over time for each site (January 2020–March 2021). Each graph was visually
inspected to detect a resurgence of COVID-19 cases in the “second wave”, and the week this occurred
noted for each site. For the subsequent analyses, only cases reported from these specific weeks
onwards are included.

    •   Final selection included for analysis

The final selection comprised 14,905 cases, of which 13,263 (89%) were laboratory confirmed, 113 (1%)
were probable and 1,529 (10 %) suspected. Table 2 describes details of the contribution of the data by
site.

9|Page
Table 2 Countries participating in I-MOVE-COVID-19 (WP3) hospital surveillance and their respective contribution
to this report - Post Selection (Second Wave)
Country Region Participating Number of Admission of first Admission of last
hospitals cases (%) reported case reported case
Date Week Date Week
Albania (AL) - Two hospitals 1,214 (8) 06 Jun 2020 23 28 Feb 2021 8
Belgium (BE) - One hospital 581 (4) 04 Aug 2020 32 29 Mar 2021 13
England (EN) Nationwide3 Five hospitals, 3,400 (23) 03 Sep 2020 36 31 Mar 2021 13
randomly
selected
France (FR) Two site:
FR-R Five hospitals 234 (2) 01 Jan 2021 1 31 Mar 2021 13
(REIVAC)
FR-V4 Two hospitals 20 (0.1) 07 May 2020 19 22 Oct 2020 43
(ViVI)
Lithuania (LT) - Two hospitals 299 (2) 13 Jul 2020 29 30 Mar 2021 13
Portugal (PT) - Three hospitals 225 (2) 13 Oct 2020 42 26 Mar 2021 12
Romania (RO) - Two hospitals 232 (2) 15 Jul 2020 29 31 Mar 2021 13
Scotland (SC) Nationwide5 All hospitals 3,507 (24) 28 Jul 2020 31 31 Mar 2021 13
.
Spain Two sites:
ES Two hospital 2,240 (15) 01 Jun 2020 23 31 Mar 2021 13
Navarra region:
NA six hospitals 2,953 (20) 21 Jul 2020 30 31 Mar 2021 13
Total 14,905 07 May 19 31 Mar 2021 13
2020
3 Randomly selected 3,400 cases from five hospitals having between 6% and 29% ICU cases.
4 All FR-V cases were included in second wave analysis due to the small number of cases submitted.
5 Randomly selected 20% of Scotland’s sample.
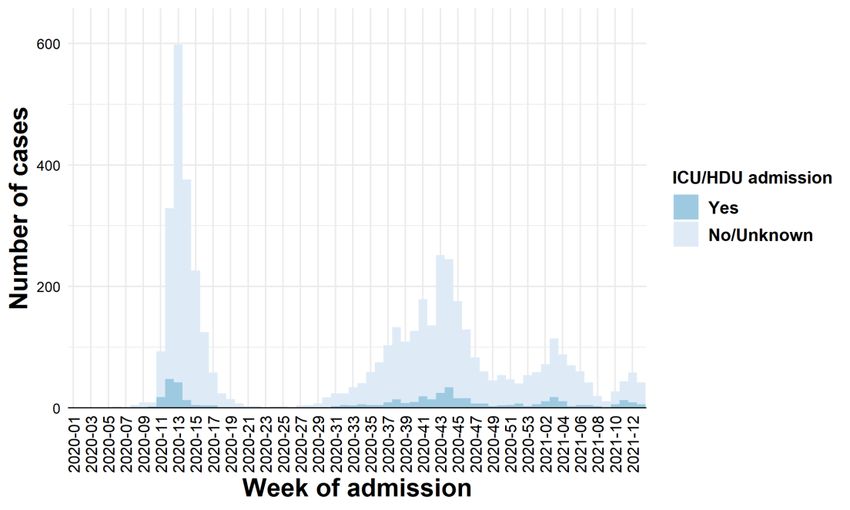
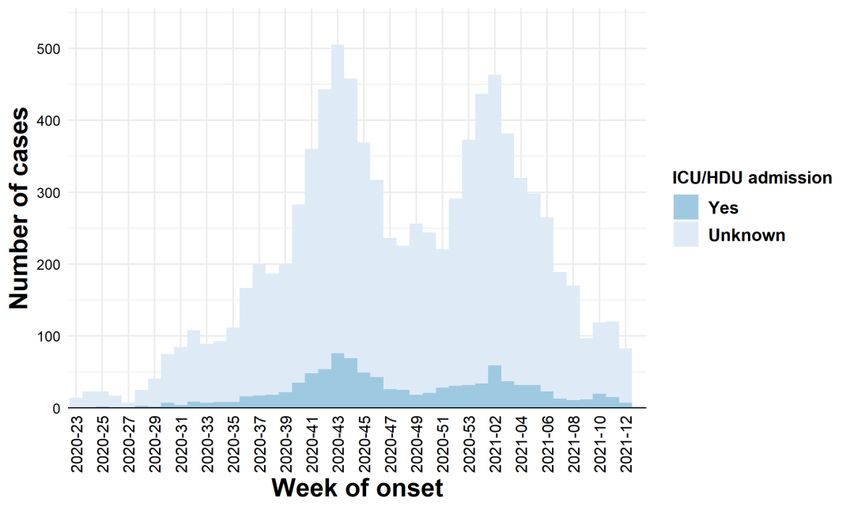
10 | P a g eCases over time The number of confirmed, probable and suspected cases reported overall by date of onset of symptoms and date of hospital admission are presented in Figures 2 and 3, respectively, categorised by ICU/HDU admission. Figure 2 Number of confirmed, probable and suspected cases reported overall by week of symptom onset (Includes data for all sites (N=9,010; 5,895 missing onset date) Figure 3 Number of confirmed, probable and suspected cases reported overall by week of hospital admission All sites (N=14,905) 11 | P a g e
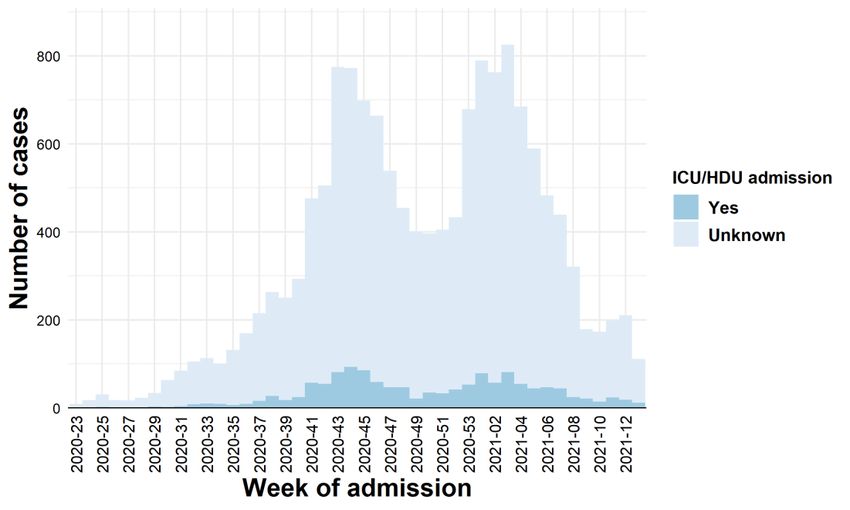
Figures 4–13 present the numbers of confirmed, probable and suspected cases reported overall by
week of hospital admission, for each participating site. Note that the data submitted by participating
sites may reflect reporting constraints faced by those sites and do not necessarily reflect how the
epidemic progressed in those countries/regions over time.

Figure 4: England (EN) (Second wave starts at week 36/2020, N=3,400)

Figure 5: Scotland (SC) (Second wave starts at week 31 2020, N=3,507)

12 | P a g e
Figure 6: Belgium6 (BE) (Second wave starts at week 32/2020, N=581)

Figure 7: Portugal (PT) (Second wave starts at week 42/2020, N=225)

6 Third wave not represented in the bulletin as some cases were not reported in time (BE dataset is complete up to the end
January 2021).

13 | P a g e
Figure 8: Spain7 (ES - Region of Granada and Aragon) (Second wave starts at week 23/2020, N=2,240)

Figure 9: Spain (NA - Navarra Region) (Second wave starts at week 27/2020, N=2,953)

7Wide heterogeneity in regions in Spain; but the shape of the second wave was overall representative of the shape at
national level.

14 | P a g e
Figure 10: France I-REIVAC (FR-R) (Second wave starts at week 01/2021, N=234)

Figure 11: Albania (AL) (Second wave starts at week 24/2020, N=1,214)

15 | P a g e
Figure 12: Lithuania (LT) (Second wave starts at week 29/2020, N=299)

Figure 13: Romania (RO) (Second wave starts at week 29/2020, N=232)

16 | P a g e
Demographics
The demographic characteristics of the patients in the surveillance dataset are presented below.
• Approximately 54% of cases were male; (8,051/14,886; 39 records missing).
• The median age of cases was 68 years, range 0–104 years (n=14,900; 5 records missing age).
• 10% of cases had supported living arrangements8 prior to admission (813/8,388; 6,517
records missing/unknown).
Figure 14 shows the sex and age distribution of confirmed, probable and suspected cases overall,
categorised by Intensive care unit (ICU) and High Dependency Unit (HDU) admissions.
Figure 14: Age and sex distribution of confirmed, probable and suspected COVID-19 cases by
ICU/HDU admission
8 Prior to admission, patient was either living at home with assistance from a carer, or was resident in a care home.
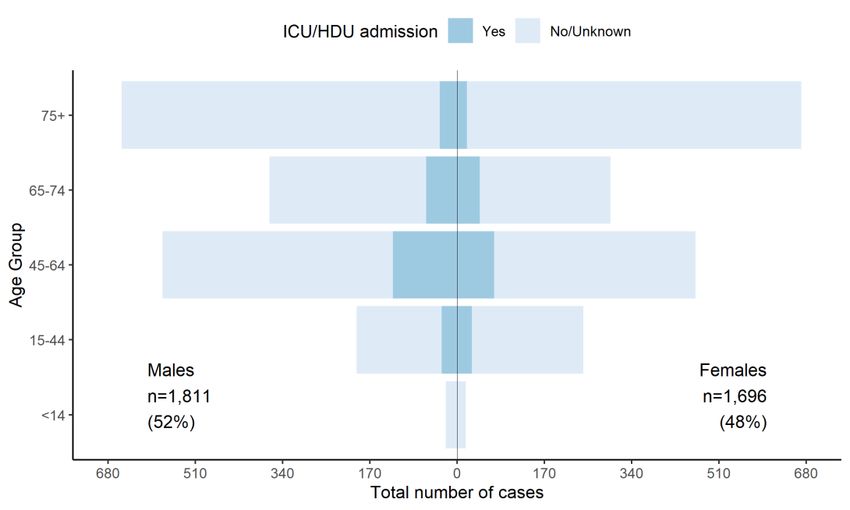
17 | P a g eFigures 15–249 show the age/sex distribution of cases by site. Note that these are absolute numbers that are not age-adjusted according to a country’s population structure, and that not all sites receive paediatric patients or collect data on paediatric cases (
Figure 17: Belgium (BE)

Figure 18: Portugal (PT)

19 | P a g e
Figure 19: Spain (ES - Region of Granada and Aragon)

Figure 20: Spain (NA - Navarra Region)

20 | P a g e
Figure 21: France I-REIVAC (FR-R)

Figure 22: Albania (AL)

21 | P a g e
Figure 23: Lithuania (LT)

Figure 24: Romania (RO)

22 | P a g e
Section Two – Clinical Characteristics

Methodology

    •   Cases included

For this part of the bulletin, the analysis is limited to confirmed cases where key variables (age, sex
and date of admission) were not missing.

    •   Selection of EN cases

Cases were selected as described in Section One; although limited to the dataset described above (ie
confirmed cases where key variables were not missing). The same five hospitals are selected as in
Section One.

    •   Selection of SC cases

The Scottish dataset is created through linkage of national-level, complete data registries and
appending a smaller, enhanced COVID-19 surveillance dataset for a smaller proportion of cases
(N=4,695; 20% of the entire Scottish dataset). The enhanced surveillance dataset was created for
research purposes and includes granular data on patient characteristics, symptoms and treatments.
These variables are only available for cases in the enhanced surveillance dataset. Therefore, for this
analysis, all cases with enhanced surveillance data were selected; cases not in this dataset were
dropped to avoid high levels of missing data.

    •   Selection of second wave cases

Second wave cases were selected following the same methodology described in Section One.

    •   Final selection included for analysis

The final selection comprised 11,563 confirmed cases. Table 3 describes the contribution of the data
by site.

23 | P a g e
Table 3 European countries participating in I-MOVE-COVID-19 (WP3) hospital surveillance, second
wave (07 May 2020–31 March 2021) and their respective contribution to this report
Country Region Participating Number of Admission of first Admission of last
hospitals cases (%) reported case reported case
Date Week Date Week
Albania (AL) - Two hospitals 1,211 (10) 06 Jun 2020 23 28 Feb 2021 8
Belgium (BE) - One hospital 562 (5) 04 Aug 2020 32 29 Mar 2021 13
England (EN) Nationwide Five hospitals, 3,372 (29) 03 Sep 2020 36 31 Mar 2021 13
randomly
selected
France (FR) Two site:
FR-R Five hospitals 222 (2) 01 Jan 2021 1 31 Mar 2021 13
(REIVAC)
FR-V Two hospitals 18 (0.2) 07 May 2020 19 22 Oct 2020 43
(ViVI)
Lithuania (LT) - Two hospitals 296 (2) 13 Jul 2020 29 30 Mar 2021 13
Portugal (PT) - Three hospitals, 178 (2) 13 Oct 2020 42 26 Mar 2021 12
all wards
Romania (RO) - Two hospitals, 163 (1) 15 Jul 2020 29 31 Mar 2021 13
all wards
Scotland (SC) Nationwide All hospitals 1,893 (16) 28 Jul 2020 31 31 Mar 2021 13
participating in .
enhanced
surveillance
(N=4695)
Spain Two sites:
ES Two hospitals 695 (6) 01 Jun 2020 23 31 Mar 2021 13
Navarra region:
NA six hospitals 2,953 (26) 21 Jul 2020 30 31 Mar 2021 13
Total 11,563 07 May 19 31 Mar 2021 13
2020
24 | P a g eChronic conditions
Table 4 shows the number of cases in the second wave of the pandemic, by underlying chronic
condition. Sites collect information on chronic conditions with varying degrees of data completeness
and this is reflected in the results. The top five chronic conditions reported were hypertension, obesity,
heart disease, diabetes and lung disease.
Table 4 Number (%) confirmed COVID-19 patients with underlying chronic conditions
Number (%) of cases Number (%) of cases with chronic
with information available condition
Hypertension 9,684 (83.7) 4,025 (41.6)
Obese 7,675 (66.4) 2,241 (29.2)
Heart disease 10,196 (88.2) 2,742 (26.9)
Diabetes 9,989 (86.4) 2,285 (22.9)
Lung disease 8.335 (72.1) 1,198 (14.4)
Renal disease 9,916 (85.8) 1,248 (12.6)
Cancer 6,554 (56.7) 727 (11.1)
Asthma 9,730 (84.1) 1,038 (10.7)
Neuromuscular disorder 6,919 (59.8) 539 (7.8)
Rheumatic illness 6,546 (56.6) 500 (7.6)
Stroke 4,897 (42.4) 308 (6.3)
Dementia 6,534 (56.5) 391 (6.0)
Anaemia 4,893 (42.3) 203 (4.1)
Liver disease 9,902 (85.6) 328 (3.3)
Immunodeficient/organ transplant 6,517 (56.4) 94 (1.4)
Tuberculosis 3,340 (28.9) 23 (0.7)
Asplenia 2,645 (22.9) 4 (0.2)
25 | P a g eTable 5 shows the number of cases (%) who had no; one; and two or more chronic conditions by hospital
admissions, ICU/HDU admissions and death.
Table 5: Number (%) COVID-19 hospitalisations, ICU admissions and deaths amongst patients with
no; one; and two or more underlying health conditions
Number (%) All Number (%) ICU/HDU Number (%)
Admissions Admissions Deaths
No underlying conditions 899 (10) 88 (8) 30 (2)
One underlying condition 2745 (32) 281 (27) 353 (22)
Two or more underlying 5,072 (58) 684 (65) 1,230 (76)
conditions
26 | P a g eSymptoms
Table 6 describes cases by their symptoms at or before presentation. Sites routinely collect information
on symptoms with the exception of England, with varying degrees of data completeness.
Table 6 Clinical characteristics of patients hospitalised with confirmed COVID-19
Total number (%) with
Number (%) of cases
information available
with symptom
(N=11,563)
Symptom groups10
Respiratory 4,803 (41.5) 4,658 (97.0)
Febrile illness 2,865 (24.8) 2,496 (87.1)
Neurological 2,799 (24.2) 1,874 (67.0)
Gastrointestinal 3,342 (28.9) 1,624 (48.6)
Other 3,886 (33.6) 3,589 (92.4)
Symptoms
Shortness of breath 5,043 (43.6) 3,593 (71.2)
Cough 4,818 (41.7) 3,298 (68.5)
General deterioration 3,461 (29.9) 2,252 (65.1)
Fever 3,323 (28.7) 1,850 (55.7)
Malaise 3,928 (34.0) 1,883 (47.9)
Feverishness 2,678 (23.2) 1,221 (45.6)
Tachypnoea 2,034 (17.6) 824 (40.5)
Myalgia 4,270 (36.9) 1,259 (29.5)
Headache 4,223 (36.5) 1,043 (24.7)
Diarrhoea 4,300 (37.2) 1,029 (23.9)
Chills 1,622 (14.0) 323 (19.9)
Chest pain 3,270 (28.3) 632 (19.3)
Confusion 3,161 (27.3) 526 (16.6)
Vomit 4,125 (35.7) 563 (13.6)
Dizziness 1,630 (14.1) 212 (13.0)
Nausea 2,571 (22.2) 326 (12.7)
Coryza 1,746 (15.1) 221 (12.7)
Ageusia 3,719 (32.2) 462 (12.4)
Anosmia 3,746 (32.4) 452 (12.1)
Abdominal pain 4,129 (35.7) 374 (9.1)
Palpitations 1,688 (14.6) 123 (7.3)
Sore throat 3,723 (32.2) 265 (7.1)
Rash/other dermatological manifestation 2,782 (24.1) 49 (1.8)
Conjunctivitis 2,832 (24.5) 25 (0.9)
10Respiratory (coryza, cough, sore throat, shortness of breath, tachypnoea, chest pain); Neurological (ageusia, anosmia, confusion, dizziness,
headache); Gastrointestinal (abdominal pain, diarrhoea, nausea, vomiting); Febrile illness (Fever, feverishness, chills); Other (any other
symptom listed).
27 | P a g eSection Three - Patient Outcomes
Methodology
• Cases included
For this part of the bulletin, the analysis is also limited to confirmed cases where key variables
(age, sex and date of admission) were not missing.
• Selection of EN cases
Cases were selected as described in Section One; although limited to the dataset described
above (i.e. confirmed cases where key variables were not missing). The same five hospitals
were selected as in Section One.
• Selection of SC cases
For Figures 25 and Table 7, cases were selected as described in Section One; although limited
to the dataset described above (i.e. confirmed cases where key variables were not missing).
For Tables 8 and 9, cases were selected as described in Section Two; this is because many of
the patient characteristics and outcomes variables presented are only available for cases that
are included the enhanced surveillance dataset.
• Selection of first/second wave cases
Cases belonging to the first and second waves were ascertained using the site-specific
definitions of first and second wave weeks described in Section One.
• Final selection included for analysis
The final selection for Figures 25 and Table 10 comprised 20,661 confirmed cases for both the
first and second waves. Table 7 describes the contribution of the data by site for each wave.
28 | P a g eTable 7 European countries participating in I-MOVE-COVID-19 (WP3) hospital surveillance, first and second waves (01 February 2020–31 March 2021) and their
respective contribution to this report
Country Region Participating Number of Number of cases in Admission of first Admission of first Admission of last
hospitals cases in first second wave (%) reported case: first reported case: second reported case
wave (%) wave wave
Date Week Date Week Date Week
Albania (AL) - Two hospitals 94 (1) 1,211 (9) 20 Feb 2020 8 06 Jun 2020 23 28 Feb 2021 8
Belgium (BE) - One hospital 426 (6) 562 (4) 21 Feb 2020 8 04 Aug 2020 32 29 Mar 2021 13
England (EN) Nationwide Five hospitals, 2,054 (27) 3,372 (26) 15 Mar 2020 11 03 Sept 2020 36 31 Mar 2021 13
randomly selected
France (FR) Two site:
FR-R Five hospitals 1,049 (14) 222 (2) 01 Feb 2020 5 05 Jan 2021 1 31 Mar 2021 13
(REIVAC)
FR-V Two hospitals 0 (0) 18 (0) - - 10 May 2020 19 22 Oct 2020 43
(ViVI)
Lithuania (LT) - Two hospitals 4 (0) 296 (2) 26 Jun 2020 26 13 Jul 2020 29 30 Mar 2021 13
Portugal (PT) - Three hospitals, all 474 (6) 178 (1) 13 Feb 2020 7 13 Oct 2020 42 26 Mar 2021 12
wards
Romania (RO) - Two hospitals, all 161 (2) 163 (1) 10 Mar 2020 11 15 Jul 2020 29 31 Mar 2021 13
wards
Scotland (SC) Nationwide All hospitals 1,135 (15) 3,484 (26) 03 Mar 2020 10 28 Jul 2020 31 31 Mar 2021 13
29 | P a g eSpain Two sites:
ES Two hospitals 205 (3) 695 (5) 16 Mar 2020 12 08 Jun 2020 24 31 Mar 2021 13
Navarra region: six 21 Jul 2020
NA hospitals 1,905 (25) 2,953 (22) 06 Feb 2020 06 30 31 Mar 2021 13
Total 7,507 13,154 01 Feb 2020 5 10 May 2020 19 31 Mar 2021 13
30 | P a g eLength of stay, ICU admission and deaths
• Over all sites, the median length of stay in hospital was 10 days, range 1–281 (n=14,861).
• Over all sites, 13% cases required ICU/HDU admission.
• Over all sites, 21% cases died in hospital.
Figure 25 shows patient outcome by sex. Note that all patients are included in the figure, even if
outcome is yet to be determined (as may be the situation, for example, for more recent admissions).
Figure 25 Patient outcome by sex (N=20,661)
31 | P a g eTable 8 describes patient outcomes (ICU/HDU admissions; deaths) by a range of potential
risk/protective factors.
Table 8 Patient outcome by potential protective/risk factors (all sites)
Exposures Total cases ICU/HDU admission Deaths
(risk/protective factors) N % N % N %
All cases11 11,563 - 1,239 12.2 1,818 17.7
Missing data - - 1,412 12.2 1,312 11.3
Age groups
0–14 287 2.5Table 9 describes patient requirement for ventilation for a range of risk/protective factors, for all sites
Table 9 Level of mechanical ventilation required by risk/protective group (all sites)
Total ECMO Other
Any Ventilator Ventilator High flow
Exposures (risk/protective) N(%) ventilation (non-invasive) (invasive) oxygen
factors)
n (%) n (%) n (%) n (%)
n (%) n (%)
All cases13 11,563 2,810 324 314 785 17 1,387
(42.5) (4.9) (4.7) (11.6)Comparison of patient outcome in first vs second epidemic waves
Table 10 compares the percentage of ICU admissions and deaths amongst patient groups in the first
versus the second wave, using a Chi-squared test of proportions to test for significance. As a percentage
of all hospital admissions, ICU/HDU admissions dropped significantly overall, in both sexes, and across
all age groups except theStrengths and limitations of I-MOVE-COVID19 hospital surveillance The I-MOVE-COVID-19 hospital surveillance network complements and enhances national-level COVID- 19 surveillance by the pooling of data from multiple surveillance sites across Europe. As sites follow the same protocol, this provides a relatively homogenous dataset of greater sample size, which in turn allows for more in-depth investigation of the data (e.g. by stratification into smaller sub-groups), facilitating epidemiological insights at a European regional level. Participation in the surveillance system also allows sites to share their experience with other European colleagues in the network, providing a wider context for their national data. Importantly, for some sites, network participation has led to improvements in national level data collection systems and practice, e.g. through data linkage or digitalisation of hospital data. Network members also report a positive effect of the regular surveillance bulletin meetings, which provide feedback on the data collected and the opportunity for discussion with other network members. Nonetheless, the surveillance has a number of limitations. The definition of a confirmed case potentially includes patients who were hospitalised during the surveillance period for reasons other than COVID- 19, but who were incidentally swab positive for SARS-CoV2 shortly prior to, during or after admission. This may bias the results e.g. in favour of less severe outcomes. Intra- and inter-country/site reporting practice and completeness of data may vary over time, which means that comparisons both within and between sites should be interpreted with caution. The timeframe during which data were submitted by participating sites reflect the logistical constraints faced by those sites. This do not necessarily reflect how the epidemic progressed in those countries over time. In addition, containment, case management and mitigation strategies for the COVID-19 pandemic have differed between country, and within countries over time. For this reason, alongside the collection of dates of onset/admission/respiratory specimen collection, case- containment/mitigation strategies (including roll out of vaccine programmes) and dates of any changes should be considered for each country when interpreting the graphs. Data for patient outcome have not been censored. This may introduce bias into the report findings by including recently hospitalised patients for whom outcome is not yet determined. The selection of Scottish data in Sections Two and Three comes from an enhanced surveillance dataset set up for research purposes, which is only available for a small proportion (20%) of all patients hospitalised with COVID-19 in Scotland. These data have been shown to be biased towards older ages status and more severe outcomes (higher % ICU/HDU admissions and deaths) when compared to overall COVID-19 admissions in Scotland. Therefore, the clinical characteristics and patient outcomes may not be representative of all hospitalised Scottish patients, potentially introducing bias into the pooled sample. 35 | P a g e
Annexes

      1.1. Annex A. The I-MOVE-COVID-19 project

             1.1.1. Background
The I-MOVE (Influenza – Monitoring Vaccine Effectiveness in Europe) project was initiated in 2007 and
was the first network to monitor influenza vaccine effectiveness (VE) within Europe. The network has
two components: one for primary care practices, recruiting patients with influenza-like illness (ILI) and
the other for hospitals, recruiting patients with severe acute respiratory illness (SARI).
The emergence of a novel coronavirus – (SARS-CoV-2) – occurred at the end of 2019, causing a new
coronavirus disease, COVID-19. As of the 22nd June 2021 (the time of writing), there had been
179,661,027 confirmed cases of COVID-19 globally, including 3,890,926 deaths, reported to the World
Health Organization.16

In February 2020, partners already involved in studies within the I-MOVE network came together as the
I-MOVE-COVID-19 consortium and successfully bid for the European Commission H2020 call on
“Advancing knowledge for the clinical and public health response to the novel coronavirus epidemic”.
The expanded network includes primary care networks, hospitals, and national laboratory reference
centres in 13 countries across the WHO European Region.17

The I-MOVE-COVID-19 consortium aims to obtain epidemiological and clinical information on patients
with COVID-19 as well as virological information on SARS-CoV-2, and provide the following through
different work packages (WPs): (a) provision of a flexible surveillance platform, adaptable to the
epidemiological situation, through WP2 (primary care surveillance) and WP3 (hospital surveillance), (b)
research studies, through WP4 and (c) evaluation of public health interventions (e.g. vaccination,
antivirals) in WP2–4, in order to contribute to the knowledge base, guide patient management, and
inform the public health response.

The WP3 hospital surveillance for COVID-19 is coordinated by Public Health Scotland (PHS) with
Epiconcept support. The hospital network comprises 11 surveillance sites involving hospitals in six EU
Member States,18 England, Scotland, and Albania (with two of the EU member state countries having
two sites each). While each of the surveillance sites can analyse their data separately, pooling the data
for overall analysis provides a sample size big enough to depict trends and generate hypotheses
(surveillance) and answer study questions with reasonable precision (research).

This document presents the fourth surveillance bulletin for the hospital-based surveillance component
of I-MOVE-COVID-19 for 2020. The specifics of each site’s COVID-19 data collection are detailed in the
individual site protocol annexes.

16
     Source: World Health Organization (WHO) Situation Report dashboard. Available at: https://covid19.who.int/. Accessed 22 June 2021.
17
   Albania Belgium, Croatia, France, Germany, Ireland, Lithuania, the Netherlands, Portugal, Romania, Spain, Sweden and the UK (England
and Scotland).
18
   Belgium, France, Lithuania, Portugal, Romania, and Spain

36 | P a g e
1.1.2. Objectives of the I-MOVE-COVID-19 WP3 Surveillance
Primary objectives
The main objective of the I-MOVE-COVID19 WP3 project is to describe, for nine European countries,
clinical and epidemiological characteristics of patients hospitalised with COVID-19 and virological
characteristics of SARS-CoV-2 in hospitalised patients, in order to contribute to the knowledge base,
guide patient management, and inform the public health response.
Secondary objectives
Potential secondary objectives include:
● To strengthen preparedness to respond to COVID-19 through hospital surveillance.
● To describe COVID-19 suspected, probable and confirmed cases with severe disease by sex,
age-group, and other potential risk or protective factors.
● To describe deaths from COVID-19 in hospital by country and pooled across the network.
● To measure the incidence of hospitalised COVID-19 patients, by participating region/country
(where appropriate) in order to measure the impact of/inform decisions on mitigation
measures, and to identify at-risk groups for severe disease.
1.2.Annex B. Methods
1.2.1. Active hospital-based surveillance of COVID-19 at European level
Type of surveillance
• Multi-centre population-based surveillance over several countries/regions
Population under surveillance
• The surveillance population consists of the entire population living in the catchment
areas of the participating hospitals.
1.2.2. Surveillance and study period
The surveillance period started in February 2020. Participating hospitals carry out surveillance
throughout the year. This fourth surveillance bulletin is for the period from 07 May 2020 to 31 March
2021.
1.2.3. Outcomes
The two primary outcomes of interest are laboratory-confirmed COVID-19 in patients hospitalised with
suspected COVID-19, and severe COVID-19 in patients hospitalised with suspected COVID-19.
The secondary outcomes of interest are:
● Suspected COVID-19 cases
● Probable COVID-19 cases
37 | P a g e1.3.Annex C. Case definitions
Hospitalised patient
A hospitalised patient is defined as a patient who has been admitted to one of the participating
hospitals during the surveillance period, and has not been discharged home or home-equivalent
before 24h.
Suspected COVID-19 patient
A suspected COVID-19 patient is defined as a hospitalised person with:
● at least one systemic symptom or sign: fever or feverishness, malaise, headache or
myalgia or deterioration of general condition (asthenia or loss of weight or anorexia or
confusion or dizziness)
AND
● at least one respiratory symptom or sign (cough, sore throat or shortness of breath; or
tachypnoea or signs of low oxygen saturation)
at admission or within 48 hours after admission.
All patients fulfilling the above criteria, until they are re-classified as COVID-19 negative, probable or
confirmed (see below), are considered as suspected COVID-19 patients.
Confirmed case of COVID-19 (confirmed case)
A confirmed COVID-19 is defined as a patient hospitalised during the surveillance period with a
respiratory sample positive for SARS-CoV-2.
Probable case of COVID-19 (probable case)
A probable COVID-19 case will be defined as a patient hospitalised with suspected COVID-19 during the
surveillance period for whom
● testing for virus causing COVID-19 is inconclusive (according to the test results reported
by the laboratory)
OR
● testing was positive on a pan-coronavirus assay
OR
● no laboratory tests are available but there is clinical confirmation with suggestive
radiology
Severe COVID-19 case
For the purposes of surveillance, all patients hospitalised due to confirmed COVID-19 disease are severe
COVID-19 cases. However, these hospitalised patients will be further classified as “severe hospitalised
COVID-19 patients” if they have any of the following clinically, analytically or radiologically significant
alterations/outcomes mentioned in the admission or discharge diagnosis:
38 | P a g e● Bilateral pneumonia with ground-glass opacities
● Admitted to ICU/HDU
● On ventilation
o Invasive (i.e. with intubation)
o non-invasive (e.g. high-flow oxygen; or those needing >6L)
● Extracorporeal membrane oxygenation (ECMO)
● Death
COVID-19 death
A COVID-19 death is defined as a confirmed COVID-19 case who died during hospitalisation.
1.3.1. Exclusion criteria for surveillance
All COVID-19 patients will be included in the surveillance unless the surveillance site/country requires
consent and the patient:
● is unwilling to participate or unable to communicate and give consent (the consent may also be
given by her/his legal representative, or by specific consent procedures, acceptable according to
the local ethical review process)
Note: in some countries, individual patient consent is not required for routine surveillance.
39 | P a g eYou can also read