Gun violence incidence during the COVID 19 pandemic is higher than before the pandemic in the United States
←
→
Page content transcription
If your browser does not render page correctly, please read the page content below
www.nature.com/scientificreports
OPEN Gun violence incidence
during the COVID‑19 pandemic
is higher than before the pandemic
in the United States
Paddy Ssentongo1,2,8*, Claudio Fronterre 3,8, Anna E. Ssentongo1,4,8, Shailesh Advani5,6,8,
Emily S. Heilbrunn 1, Joshua P. Hazelton4, John S. Oh4, Jennifer S. McCall‑Hosenfeld7,8 &
Vernon M. Chinchilli1,8
During the coronavirus disease 2019 (COVID-19) pandemic, gun violence (GV) in the United States
(U.S.) was postulated to increase strain on already taxed healthcare resources, such as blood products,
intensive care beds, personal protective equipment, and even hospital staff. This report aims to
estimate the relative risk of GV in the U.S. during the pandemic compared to before the pandemic.
Daily police reports corresponding to gun-related injuries and deaths in the 50 states and the District
of Columbia from February 1st, 2019, to March 31st, 2021 were obtained from the GV Archive.
Generalized linear mixed-effects models in the form of Poisson regression analysis were utilized to
estimate the state-specific rates of GV. Nationally, GV rates were 30% higher between March 01,
2020, and March 31, 2021 (during the pandemic), compared to the same period in 2019 (before the
pandemic) [intensity ratio (IR) = 1.30; 95% CI 1.29, 1.32; p < 0.0001]. The risk of GV was significantly
higher in 28 states and significantly lower in only one state. National and state-specific rates of GV
were higher during the COVID-19 pandemic compared to the same timeframe 1 year prior. State-
specific steps to mitigate violence, or at a minimum adequately prepare for its toll during the COVID-
19 pandemic, should be taken.
The coronavirus disease 2019 (COVID-19) global pandemic and the policies implemented to address it sig-
nificantly impacted the psychological, physical, emotional, and financial well-being of almost all individuals
living in the United States (U.S.)1,2. As of June 17th, 2021, the U.S. had 33 million confirmed cases of COVID-19
and more than 600,000 deaths despite stay-at-home orders enacted in March 2020 and continued emphasis on
social distancing, hygiene methods and vaccination. As of April 20, 2020, 42 states and the District of Colombia
were under stay-at-home advisories or shelter-in-place policies, affecting approximately 96% of the population
in the U.S.3. While the purpose of these orders was to decrease disease transmission, there were unintended
consequences. The orders forced businesses to close, leaving millions u nemployed4. Furthermore, the physical
distancing necessary to curb transmission of the virus also disrupted social support networks. Combined, these
forces may have created a climate with the potential to increase firearm-related suicides5. In addition, unemploy-
ment and financial strain, increased unscheduled time, and increased substance abuse may result in increased
risk-taking behaviors, elevating the risk of violent crimes5,6.
1
Department of Public Health Sciences, Penn State College of Medicine and Milton S. Hershey Medical
Center, 90 Hope Drive, Suite 2200, Hershey, PA 17033, USA. 2Center for Neural Engineering, Department of
Engineering, Science and Mechanics, The Pennsylvania State University, State College, PA, USA. 3Centre for
Health Informatics, Computing and Statistics, Lancaster University, Lancaster, UK. 4Department of Surgery,
Division of Trauma Surgery, Penn State College of Medicine and Milton S. Hershey Medical Center, Hershey, PA,
USA. 5Department of Oncology, Georgetown University School of Medicine, Georgetown University, Washington,
DC, USA. 6Social Behavioral Research Branch, National Human Genome Research Institute, National Institutes
of Health, Bethesda, MD, USA. 7Department of Medicine, Penn State College of Medicine and Milton S. Hershey
Medical Center, Hershey, PA, USA. 8These authors contributed equally: Paddy Ssentongo, Claudio Fronterre, Anna
E. Ssentongo, Shailesh Advani, Jennifer S. McCall-Hosenfeld and Vernon M. Chinchilli. *email: pssentongo@
pennstatehealth.psu.edu
Scientific Reports | (2021) 11:20654 | https://doi.org/10.1038/s41598-021-98813-z 1
Vol.:(0123456789)www.nature.com/scientificreports/
An assessment of gun purchases in the U.S. revealed that during the COVID-19 stay-at-home orders, there
was a significant increase in the number of criminal background checks for gun purchases. From March until
June 2020, the FBI conducted 13,674,878 background checks for gun purchases, indicating a 42% increase in
comparison to the same timeframe in 20197. This suggests greater firearm access among the U.S. population
during the pandemic, and access to firearms is independently associated with the risk of gun-related suicide and
homicide8. A meta-analysis of 16 observational studies found a threefold greater odds of suicide and a twofold
greater odds of homicide among participants who had firearm access compared to those who did n ot9.
Despite the increased risk factors for GV, some cities are reporting a paradoxical decrease in GV perhaps
due to the stay-at-home orders. However, other cities are experiencing a rapid increase in overall crime. Recent
data support the notion that in some U.S. cities, gun violence (GV) is reaching an all-time high. Philadelphia is
just one example of this, with 141 shootings in March of 2020, “making it Philadelphia’s worst March for [GV]
in 5 years”10. In addition, numbers of injured individuals from GV rose from 23,000 in 2014 to 31,000 in 2017; it
declined to 28,000 in 2018 and slightly rose to 30,000 in 2019 before dramatically increasing to 39,000 in 2020.
These trends were similar for deaths (Supplementary file 1)11. To date, no comprehensive study has systemati-
cally assessed GV rates during the COVID-19 pandemic and stay-at-home orders across all states in the U.S.
We hypothesized that there would be an increase in GV rates during the COVID-19 pandemic across the U.S.
in comparison to the pre-pandemic year of 2019.
Methods
Data sources. The Gun Violence Archive (GVA) is an independent not-for-profit organization that com-
piles comprehensive and accurate information about GV in the US11https://www.gunviolencearchive.org. The
GVA provided all data corresponding to gun-related injuries and deaths in the U.S. from February 1st, 2019, to
March 31st, 2021. This data is collected via law enforcement, media, government, and commercial sources and
then verified by independent researchers. To obtain the dataset, ESH completed a Data Request Form as directed
by the GVA. The GVA provided comprehensive comma-separated values file documents, consolidating all gun
violence events through the study period. No written agreements related to confidentiality or data use were nec-
essary. Information about daily events, location of the incident (street address, city, and state) and the number of
individuals killed or injured were the data points of interest. No clearances were required because all incidents
are publicly and freely available online. Two authors (ESH and AES) randomly selected 1% of incidents and veri-
fied the accuracy of the data using the news report published and reporting about the incidents.
The COVID-19 Dashboard by the Centers for Systems Science and Engineering (CSSE) at Johns Hopkins
University provides freely available data related to COVID-194. State population data and other demographic
characteristics (age, sex, and race) were extracted from the U.S. Census Bureau, Department of Commerce
database12.
Outcome and measures. The primary outcome of interest was the rate of GV during the COVID 19 pan-
demic versus 13-month period prior, both at the state and national levels. The results were reported as intensity
ratios (IR). GV event rates were measured as counts of gun-related injuries and/or deaths per 1,000,000 popula-
tion. The secondary outcome was the correlation of GV events and the number of COVID-19 cases at the state
level.
Statistical analysis. Our data set consists of daily counts of GV events within each of the 50 states and
the District of Columbia from January 01, 2019, through March 31, 2021. We combined the daily data from
this 27-month period into bi-monthly amounts (January 01, 2019, through January 15, 2019; January 16, 2019,
through January 31, 2019; etc.), which yielded 54 time intervals. Although we were interested in comparing the
rate of GV between the 13 months of March 01, 2020, through March 31, 2021 (during the pandemic) to the
13 months of February 01, 2019, through February 29, 2020 (prior to the pandemic), we fit the entire time series
(January 01, 2019, through March 31, 2021) to improve numerical stability.
For the primary analysis to estimate the IR of GV comparing pre-pandemic and pandemic periods, we applied
a generalized linear mixed-effects model in the form of a Poisson regression analysis with a logarithm link func-
tion for each state with the following model characteristics:
• the logarithm of the state’s population as an offset
• cubic polynomial splines to model the event rate over the 54 time intervals
• knot points for splines at months 3, 6, 9, 12, 15, 18, 21, and 24
We embedded a cubic polynomial spline function within the Poisson regression of the generalized linear
mixed-effects model to model the GV counts during the 27-month observation period (January 01, 2019, through
March 31, 2021). The cubic polynomial spline function we applied consists of nine segments with knot points
selected at 3-month intervals. Let t denote the elapsed number of months since January 01, 2019, such that
t ∈ [0, 27], and we designate the knot points as
t(1) = 3, t(2) = 6, t(3) = 9, t(4) = 12, t(5) = 15, t(6) = 18, t(7) = 21, t(8) = 24
The unknown parameters to estimate in the model are an intercept parameter
(β0 ), a linear parameter (β1 ),
a quadratic parameter (β2 ), and nine cubic parameters β3(1) , β3(2) , . . . , β3(9) . Denoting the GV count as the
exponentiated value of f (t) at time t , the cubic polynomial spline function is as follows:
Scientific Reports | (2021) 11:20654 | https://doi.org/10.1038/s41598-021-98813-z 2
Vol:.(1234567890)www.nature.com/scientificreports/
f (t) = β0 + tβ1 + t 2 β2 + t 3 β3(1) 0 ≤ t ≤ t(1)
f (t) = β0 + tβ1 + t 2 β2 + t 3 β3(1)
3
t(1) ≤ t ≤ t(2)
+ t − t(1) β3(2) − β3(1)
f (t) = β0 + tβ1 + t 2 β2 + t 3 β3(1)
3
+ t − t(1) β3(2) − β3(1) t(2) ≤ t ≤ t(3)
3
+ t − t(2) β3(3) − β3(2)
..
.
f (t) = β0 + tβ1 + t 2 β2 + t 3 β3(1)
3
+ t − t(1) β3(2) − β3(1)
3
+ t − t(3) β3(4) − β3(3)
3
+ t − t(4) β3(5) − β3(4)
3
t(8) ≤ t ≤ 27
+ t − t(5) β3(6) − β3(5)
3
+ t − t(6) β3(7) − β3(6)
3
+ t − t(7) β3(8) − β3(7)
3
+ t − t(8) β3(9) − β3(8)
At t(i), the ith knot point, i = 1, 2, . . . , 8, f (t) has the following properties:
• limt↑t(i) f (t) = limt↓t(i) f (t)
• limt↑t(i) f ′ (t)= limt↓t(i) f′ (t)
• limt↑t(i) f ′′ (t)= limt↓t(i) f′′ (t)
In other words, f (t) and its first two derivatives are continuous at each knot point.
We fit cubic polynomial splines to account for the curvilinear changes in the event rate over the 27-month
period within each state. As is typical of cubic polynomial splines, we imposed the smoothing conditions such
that the splines and their first two derivatives are continuous at the knot points.
Next, we constructed test statistics based on the model-based estimates to construct 24 distinct comparisons:
• March 01, 2020 through March 15, 2020 versus March 01, 2019 through March 15, 2019
• March 16, 2020 through March 31, 2020 versus March 16, 2019 through March 31, 2019
• …
• February 16, 2021, through February 28, 2021, versus February 16, 2020, through February 29, 2020
We did not apply any multiple comparison adjustments. More importantly, we constructed an overall com-
parison of the 13-month pandemic period March 01, 2020 through March 31, 2021 versus the 13-month pre-
pandemic period February 01, 2019 through February 29, 2020.
For the overall U.S. analysis, we applied a generalized linear mixed-effects model in the form of a Poisson
regression analysis as described above with three additional features:
• a first-order autoregressive process to account for the correlation across the time intervals
• random effect for state
• four covariates based on census data (each state’s median age, Black-White ratio, Hispanic-White ratio, and
male–female ratio).
For the secondary outcome of correlation of the number of COVID-19 cases and the number of GV events,
we constructed a data set with the daily numbers of COVID-19 and GV cases from each state for the period
February 01, 2020, through March 10, 2021. We constructed a bivariate generalized linear mixed-effects model
in the form of Poisson regression with a cubic polynomial function. The statistical model is bivariate because
it simultaneously analyzes the two sets of correlated longitudinal variables (COVID-19 cases and gun-violence
events). For the analysis of each state’s data, we included a time-dependent binary variable (no/yes) as to the
status of the state’s stay-at-home order. For the analysis of the overall U.S. data, we included the four covariates
(state’s median age, Black-White ratio, Hispanic-White ratio, and male–female ratio) based on census data. In
all these bivariate models, we estimated the correlation between COVID-19 cases and gun-violence events.
Comparison of the spatial distributions of GV during the pandemic vs. pre-pandemic was performed using
spatial relative risk s urfaces13. Statistical significance level was set at p < 0.01 for spatial relative risk surface and
p < 0.05 for all other analyses. All analyses were performed with the R statistical language (R Development Core
Team 2020 Version 3.0.6) and SAS Version 9.4
Scientific Reports | (2021) 11:20654 | https://doi.org/10.1038/s41598-021-98813-z 3
Vol.:(0123456789)www.nature.com/scientificreports/
Incidents Deaths Injured
Pre-pandemic (February 01, 2019, through February 29, 2020) 38,919 16,687 32,348
Pandemic (March 01, 2020 through March 31, 2021) 51,063 21,504 43,288
Table 1. The table indicates that there was a 31.2% increase in the number of incidents between the pandemic
and pre-pandemic periods.
Consent for publication. No consent to publish was needed for this study as we did not use any details,
images or videos related to individual participants.
Results
We identified 92,731 gun violence events resulting in injury or death in the U.S. from January 01, 2019, through
March 31, 2021. Table 1 indicates the numbers of events according to the 13-month pre-pandemic period and
the 13-month pandemic period.
Risk of gun violence during COVID‑19 pandemic period. On a national level, the risk of GV was 30%
higher during 13-month pandemic period March 01, 2020 through March 31, 2021, compared to the 13-month
pre-pandemic period February 01, 2019 through February 29, 2020 (IR = 1.30; 95% CI 1.29, 1.32; p < 0.0001,
Fig. 1). The risk of GV in the U.S. was consistently higher for all bi-monthly intervals from March 01, 2020
through March 31, 2021, in comparison to the baseline period (Fig. 1).
States with a significantly higher risk of GV during the pandemic compared to the same period pre-pandemic
included: Arizona, California, Colorado, Connecticut, Delaware, District of Columbia, Georgia, Idaho, Illinois,
Indiana, Iowa, Kentucky, Louisiana, Michigan, Minnesota, Missouri, Montana, Nevada, New Jersey, New York,
North Carolina, Ohio, Oregon, Pennsylvania, Tennessee, Texas, Utah, and Wisconsin (Fig. 2). Conversely, Alaska
was the only state that showed a lower risk of GV during the pandemic than pre-pandemic. Complete estimates
of state-specific bimonthly rates of GV during pandemic compared to the pre-pandemic periods are reported
in Supplementary file 1.
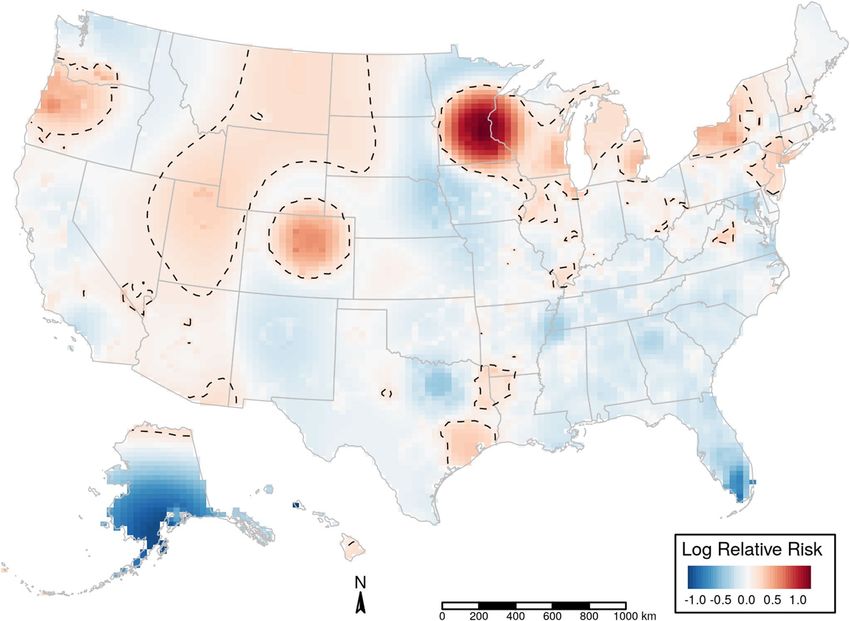
We examined the spatial distribution of GV using the global position system (GPS) coordinates of the event.
Within some states, there were hotspot of higher GV risk (p < 0.01). These spatial clusters are heterogenous
(Fig. 3).
Correlation of COVID‑19 cases and GV rates per state. In the correlation analysis, overall a mod-
est correlation between COVID-19 cases and GV rates (r = 0.32, p = 0.0001) was observed. However, in the
multivariable analysis adjusting for the population, mean age, gender proportion, and lockdown orders, we
only observed a relatively weak positive correlation between COVID-19 cases and GV in Hawaii (r = 0.14; 95%
CI 0.04, 0.23; p = 0.006). There were no other state with statistically significant positive correlations between
COVID-19 cases and GV.
Discussion
We found a strong association between the COVID-19 pandemic time frame and an increase in gun violence in
the U.S. compared to the pre-pandemic period. We identified significantly higher rates of GV in 28 states. While
stay-at-home orders and social distancing measures are vital to contain the spread of COVID 19, we also need
to be aware of the unintended social and economic stressors that may lead to gun violence.
The current increase in GV seen across the U.S. may be attributed to (1) increased psychological stress result-
ing from COVID-19 or (2) the increase in firearm sales. Recent reports suggest a substantial increase in the
burden of depressive symptoms in the U.S. associated with the COVID-1914,15. This could potentially lead to an
increase in fire-arm-related suicides. It is hypothesized that psychological stress and depressive symptoms may
be due to the heightened need to maintain physical distancing from family and friends, thereby limiting social
interactions. Our data did not directly address this, but there were also protests against racial injustice during this
same period. Although the protests were largely peaceful, there were reports in the media about gun incidents
among protestors and counter protestors.
Increased access to firearms is another plausible reason for the higher rates of GV during the pandemic. Since
the COVID-19 pandemic also led to the closure of businesses, the National Instant Criminal Background Check
System (NICS) recorded a surge in gun sales driven by public panic and unfounded fears that guns would soon
be in short supply. An estimated 41% increase in sales of handguns were recorded in March 2020 as compared
to March 2 0197. Several states determined such stores to be essential businesses, leading them to remain open.
Public health implications. Gun violence is a frequently ignored public health epidemic. The spike in gun
violence in the era of the COVID-19 pandemic come as a stark reminder that we cannot afford to ignore it any
Scientific Reports | (2021) 11:20654 | https://doi.org/10.1038/s41598-021-98813-z 4
Vol:.(1234567890)www.nature.com/scientificreports/
01MAR2020 − 15MAR2020 ●
16MAR2020 − 31MAR2020 ●
01APR2020 − 15APR2020 ●
16APR2020 − 30APR2020 ●
01MAY2020 − 15MAY2020 ●
16MAY2020 − 31MAY2020 ●
01JUN2020 − 15JUN2020 ●
16JUN2020 − 30JUN2020 ●
01JUL2020 − 15JUL2020 ●
16JUL2020 − 31JUL2020 ●
01AUG2020 − 15AUG2020 ●
16AUG2020 − 31AUG2020
Bimonthly interval
●
01SEP2020 − 15SEP2020 ●
16SEP2020 − 30SEP2020 ●
01OCT2020 − 15OCT2020 ●
16OCT2020 − 31OCT2020 ●
01NOV2020 − 15NOV2020 ●
16NOV2020 − 30NOV2020 ●
01DEC2020 − 15DEC2020 ●
16DEC2020 − 31DEC2020 ●
01JAN2021 − 15JAN2021 ●
16JAN2021 − 31JAN2021 ●
01FEB2021 − 15FEB2021 ●
16FEB2021 − 28FEB2021 ●
01MAR2021 − 15MAR2021 ●
16MAR2021 − 31MAR2021 ●
01MAR2020 − 31MAR2021 (Overall) ●
1.0 1.1 1.2 1.3 1.4 1.5
Intensity Ratio (95%CI)
Figure 1. Bimonthly intervals for intensity of GV during and before the pandemic. Bimonthly interval-
specific intensity ratio (IR) and their 95% confidence intervals of GV. The dashed blue line in the forest
plot represents the null estimate. IR greater than one indicates higher intensity of GV during COVID-19
pandemic compared to pre-pandemic.
longer. Unlike the COVID-19 pandemic, which still carries a low threat of death in children and young adults,
the threat of being killed by a firearm is a much more significant concern in this population.
Strengths and limitations. Our study included several strengths and limitations. It is the first study to
report the rate of gun-related incidents in the United States during the COVID-19 pandemic and compare them
to the pre-pandemic period. Including data on all incidents reported to police across all 50 states is another
strength of the study. Due to the interdependence between events, auto-regressive covariance structure, non-
linear effects, and non-Gaussian distributions, the Poisson GLMM model with cubic polynomial spline we used
Scientific Reports | (2021) 11:20654 | https://doi.org/10.1038/s41598-021-98813-z 5
Vol.:(0123456789)www.nature.com/scientificreports/
Alabama
Alaska
Arizona
Arkansas
California
Colorado
Connecticut
Delaware
District of Columbia
Florida
Georgia
Hawaii
Idaho
Illinois
Indiana
Iowa
Kansas
Kentucky
Louisiana
Maine
Maryland
Massachusetts
Michigan
Minnesota
Mississippi
States
Missouri
Montana
Nebraska
Nevada
New Hampshire
New Jersey
New Mexico
New York
North Carolina
North Dakota
Ohio
Oklahoma
Oregon
Pennsylvania
Rhode Island
South Carolina
South Dakota
Tennessee
Texas
Utah
Vermont
Virginia
Washington
West Virginia
Wisconsin
Wyoming
0.5 1.0 1.5 2.0 2.5
Intensity Ratio (95%CI)
Figure 2. State-specific intensity of GV during and before the pandemic. State-specific intensity ratio (IR)
and their 95% confidence intervals of GV. The dashed blue line in the forest plots represents the null estimate.
IR greater than one indicates higher intensity of GV during the COVID-19 pandemic compared to the pre-
pandemic period.
for the data analysis was appropriate and advantageous in estimating time and space events, including removing
the confounding effect of both time and space and non-linearity16. The geospatial analysis method we fitted is
granular. We did not map the state-specific counts of events to avoid aggregation of data, thereby preventing
ecological fallacy and modifiable areal unit problems. One limitation of using police reports is that the homicide/
suicide investigation is often still pending at the time of the report. Therefore, it was not possible to determine
whether these recent incidents were due to suicide or homicide. In addition, although we adjusted for other
major confounders in the models (state’s median age, race composition of the state), it is possible that residual
confounding remained and could bias the estimates observed. Lastly, the high-order polynomial models we used
to estimate the risk of GV have the disadvantages of model overfitting. Despite this, our study remains strong.
It is the first of its kind to identify a substantial change in fire-arm-related incidents during the pandemic and
estimate the relative spatial risk using GPS location of the events.
Scientific Reports | (2021) 11:20654 | https://doi.org/10.1038/s41598-021-98813-z 6
Vol:.(1234567890)www.nature.com/scientificreports/
Figure 3. Spatial relative risk of gun violence during the pandemic vs. pre-pandemic. Map shows the
intensity (or risk) difference which was estimated by comparing the smoothed intensity of GV events during
the pandemic (March 01, 2020, through March 31, 2021) vs. before the pandemic (February 01, 2019, through
February 29, 2020) across 51 states. If the difference is ~ 0, the risk of GV is unrelated to spatial location.
Evidence of spatial variation in risk occurs where the intensities differ. Difference values > 0 indicate higher
risk, and values < 0 indicate lower risk. Dotted lines highlight areas of significantly higher risk of GV during the
pandemic.
Conclusion. Overall, U.S. and state-specific rates of gun violence are higher during the COVID-19 pandemic
compared to the same period pre-pandemic.
Received: 12 April 2021; Accepted: 8 September 2021
References
1. Holmes, E. A. et al. Multidisciplinary research priorities for the COVID-19 pandemic: A call for action for mental health science.
Lancet Psychiatry 7(6), 547–560 (2020).
2. Pfefferbaum, B. & North, C. S. Mental health and the Covid-19 pandemic. N. Engl. J. Med. 383(6), 510–512 (2020).
3. Mervosh, S., Lu, D. & Swales, V. See Which States and Cities Have Told Residents to Stay at Home (New York Times, 2020).
4. Johns Hopkins University. Coronavirus Resource Center. https://coronavirus.jhu.edu/ (2020).
5. Sutherland, M., McKenney, M. & Elkbuli, A. Gun violence during COVID-19 pandemic: Paradoxical trends in New York City,
Chicago, Los Angeles and Baltimore. Am. J. Emerg. Med. 39, 225–226 (2020).
6. Dawson, D. A. Temporal drinking patterns and variation in social consequences. Addiction 91, 1623–1635 (1996).
7. FBI. NICS Firearm Checks: Month/Year. https://w ww.fbi.g ov/fi
le-r eposi tory/n ics_firear m_c hecks _-_m onth_y ear.p df/v iew. (2020).
8. Studdert, D. M. et al. Handgun ownership and suicide in California. N. Engl. J. Med. 382, 2220–2229 (2020).
9. Anglemyer, A., Horvath, T. & Rutherford, G. The accessibility of firearms and risk for suicide and homicide victimization among
household members: A systematic review and meta-analysis. Ann. Intern. Med. 160, 101–110 (2014).
10. Hatchimonji, J. S., Swendiman, R. A., Seamon, M. J. & Nance, M. L. Trauma does not quarantine: Violence during the Covid-19
pandemic. Ann. Surg. 20, 20 (2020).
11. Gun Violence Archive. Mass Shootings. https://www.gunviolencearchive.org/mass-shooting. (2020).
12. Data. Gov. US Census Bureau, Department of Commerce. https://c atalo g.d ata.g ov/d atase t/t iger-l ine-s hapefi
le-2 017-n ation-u -s-c urre
nt-state-and-equivalent-national. (2019).
13. Kelsall, J. E. & Diggle, P. J. Non-parametric estimation of spatial variation in relative risk. Stat. Med. 14, 2335–2342. https://doi.
org/10.1002/sim.4780142106 (1995).
14. Fitzpatrick, K. M., Harris, C. & Drawve, G. Living in the midst of fear: Depressive symptomatology among US adults during the
COVID-19 pandemic. Depress. Anxiety 20, 20 (2020).
Scientific Reports | (2021) 11:20654 | https://doi.org/10.1038/s41598-021-98813-z 7
Vol.:(0123456789)www.nature.com/scientificreports/
15. Ettman, C. K. et al. Prevalence of depression symptoms in US adults before and during the COVID-19 pandemic. JAMA Netw.
Open 3, e2019686–e2019686 (2020).
16. Moreau, G. The pitfalls in the path of probabilistic inference in forensic entomology: A review. Insects 12, 240 (2021).
Author contributions
P.S. conceived and designed the study, carried out statistical analysis, created figures and wrote the initial draft
for the manuscript. A.E.S. conceived the study and wrote the initial draft for the manuscript. S.A. wrote the initial
draft for the manuscript. C.F. performed spatial analysis, E.S.H. assisted with data collection. J.P.H. revised the
manuscript for intellectual content. J.S.O. critically revised the manuscript for intellectual content. J.S.M.-H.
supervised the study and critically revised the manuscript for intellectual content. V.M.C. performed the statisti-
cal analysis and supervised the study.
Funding
This study received no external or internal funding.
Competing interests
The authors declare no competing interests.
Additional information
Supplementary Information The online version contains supplementary material available at https://doi.org/
10.1038/s41598-021-98813-z.
Correspondence and requests for materials should be addressed to P.S.
Reprints and permissions information is available at www.nature.com/reprints.
Publisher’s note Springer Nature remains neutral with regard to jurisdictional claims in published maps and
institutional affiliations.
Open Access This article is licensed under a Creative Commons Attribution 4.0 International
License, which permits use, sharing, adaptation, distribution and reproduction in any medium or
format, as long as you give appropriate credit to the original author(s) and the source, provide a link to the
Creative Commons licence, and indicate if changes were made. The images or other third party material in this
article are included in the article’s Creative Commons licence, unless indicated otherwise in a credit line to the
material. If material is not included in the article’s Creative Commons licence and your intended use is not
permitted by statutory regulation or exceeds the permitted use, you will need to obtain permission directly from
the copyright holder. To view a copy of this licence, visit http://creativecommons.org/licenses/by/4.0/.
© The Author(s) 2021
Scientific Reports | (2021) 11:20654 | https://doi.org/10.1038/s41598-021-98813-z 8
Vol:.(1234567890)You can also read