Is MOOC Learning Different for Dropouts? A Visually-Driven, Multi-granularity Explanatory ML Approach - Unpaywall
←
→
Page content transcription
If your browser does not render page correctly, please read the page content below
Is MOOC Learning Different for Dropouts?
             A Visually-Driven, Multi-granularity
                 Explanatory ML Approach

               Ahmed Alamri(&), Zhongtian Sun, Alexandra I. Cristea,
                 Gautham Senthilnathan, Lei Shi, and Craig Stewart

            Department of Computer Science, Durham University, Durham, UK
                         ahmed.s.alamri@durham.ac.uk

       Abstract. Millions of people have enrolled and enrol (especially in the Covid-
       19 pandemic world) in MOOCs. However, the retention rate of learners is
       notoriously low. The majority of the research work on this issue focuses on
       predicting the dropout rate, but very few use explainable learning patterns as
       part of this analysis. However, visual representation of learning patterns could
       provide deeper insights into learners’ behaviour across different courses, whilst
       numerical analyses can – and arguably, should – be used to confirm the latter.
       Thus, this paper proposes and compares different granularity visualisations for
       learning patterns (based on clickstream data) for both course completers and
       non-completers. In the large-scale MOOCs we analysed, across various
       domains, our fine-grained, fish-eye visualisation approach showed that non-
       completers are more likely to jump forward in their learning sessions, often on a
       ‘catch-up’ path, whilst completers exhibit linear behaviour. For coarser, bird-
       eye granularity visualisation, we observed learners’ transition between types of
       learning activity, obtaining typed transition graphs. The results, backed up by
       statistical significance analysis and machine learning, provide insights for course
       instructors to maintain engagement of learners by adapting the course design to
       not just ‘dry’ predicted values, but explainable, visually viable paths extracted.

       Keywords: Learning analytics      Visualisation  MOOCs  Behavioural
       pattern  Machine learning

1 Introduction

Massive Open Online Courses (MOOC) platforms (e.g., edX, Coursera, FutureLearn,
Udemy) offer vast amounts of virtual course materials. With easy access, especially
during the Covid-19 pandemic, MOOCs are the de facto platform for self-learning.
However, in spite millions of enrolments, the completion rate is usually less than 10%,
[1]. Researchers have attempted early identification of likely dropouts, to allow for
interventional activities of course instructors. Existing studies [2–5, and 6] mainly
employ machine learning and statistical analysis. However, few can provide sound
insights and explanations to course instructors regarding the learning manner of par-
ticipants [7]. Importantly, to the best of our knowledge, there is no prior work on

© Springer Nature Switzerland AG 2020
V. Kumar and C. Troussas (Eds.): ITS 2020, LNCS 12149, pp. 353–363, 2020.
https://doi.org/10.1007/978-3-030-49663-0_42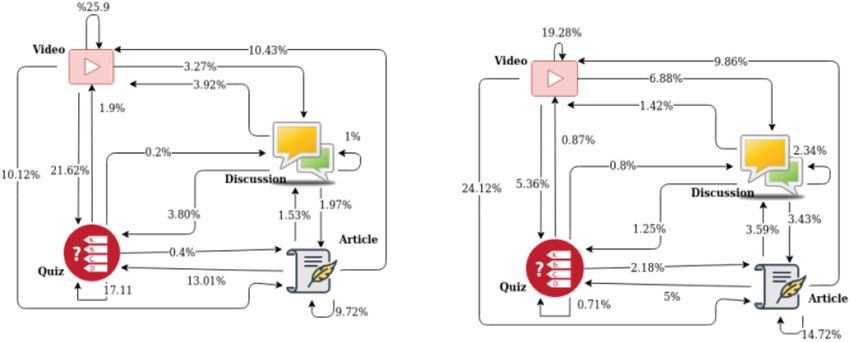
354       A. Alamri et al.

visually comparing the learning path of completers and non-completers for the entire
course session. This paper addresses the following research questions:
1. How can learning paths be visualised to differentiate between completers’ and non-
   completers’ behaviour (to inform teachers for early interventions)?
2. Are there (significant) differences in the learning paths of completers and non-
   completers and can they be deduced from visualisation early on in the course?
3. What kind of level of granularity is necessary for the visualisation of significant
   differences between completers and non-completers?
      The main contributions of this paper are:
• Providing new insights into early learning behaviour exhibited by course com-
  pleters and non-completers through bird-eye and fish-eye visualisation of partial or
  full learning graphs, with different levels of information disclosure.
• Proposing visual graph analysis as a pre-step to machine learning and prediction,
  here illustrated by discovering linear or catch-up behaviours, which then can be
  reliable predicted.
• Showing that theme-based visualisation (which also can be at bird-eye or fish-eye
  level) detects other relations in the course, e.g. the effect of forums.

2 Related Work

Existing studies on MOOCs analytics mostly focus on finding reliable completion
indicators from learner behaviour patterns, using data of forum activities [8], click-
streams [9], participants’ time spent and number of accesses [10], assignment activities
[11] to name a few. Other predictive studies [12–14] attempt to forecast the perfor-
mance, including final grade and pass/fail in exams. Overall, existing research usually
does not disregard the potential in using visualisation as an initial step before pre-
diction, nor do they consider the granularity of visualisation as a factor.

2.1     Visualisation
The explanatory power of visualisation has been stated to be crucial to provide more
insights for module instructors and designers, next to completion prediction [7].
A learning path is defined as the learning trajectory through a course by learners;
according to [15], participants generally study web courses in a non-linear manner. We
are specifically interested in comparing the transition behaviour between completers
and non-completers, as suggested by [16]. [17] investigated the typical learning activity
sequences across two MOOC datasets and mined the difference in learning themes
among groups with different grades, by visualising the theme distribution. However,
they mainly focused on which topics were more popular, instead of visualising the
entire learning paths of their four groups of learners (none, fail, pass and distinction).
Later, [7] visualised log traces of learners across four edX MOOC datasets, using
discrete-time Markov Models and observed that learners were more likely to jump
forward than backwards from video content. Additionally, they found that non-passing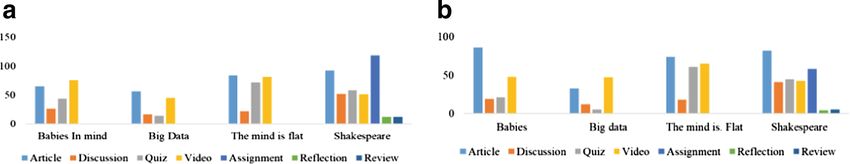
Is MOOC Learning Different for Dropouts?     355

learners were more likely to exhibit binge video watching, i.e., transit from one video
to another without answering questions, deviating from the designed linear learning
path. However, they only visualised the video interaction activity of passing and non-
passing learners, instead of the whole learning sessions, like in our work. Recently,
[18] used visualisation software, Gephi, to visualise clickstream-based learning paths.
They observed that learners are more likely to skip the quizzes at the end of each
chapter, by watching the beginning videos of the next chapter, but learn linearly within
chapters. However, neither did such previous studies explore the phenomenon in-depth,
nor provided a convincing explanation. This paper validates that completers behave
differently from dropout learners, by visualising the entire learning paths of partici-
pants. We also implement machine learning models, to statistically analyse students’
movements, by combining courses’ themes and content.

2.2   Statistical Analysis
According to [19], statistical analysis can be divided into descriptive statistics, to
summarise the demographics information of learners and inference statistics, to explore
behaviours exhibited by participants. For instance, [20] firstly examined if there is any
impact on the behaviour of learners, after they reached the passing state. They examine
weekly quiz score distribution for all learners by K-means clustering, which showed
that early passers obtained relatively lower scores immediately after passing, compared
with their previous performance. Later, [21] investigated the motivation of two groups
of completers: university students and general participants, using Mann–Whitney U
test, and concluded that as participants’ ages increased, earning a certificate was less
significant. Recently, [22] explored different behaviours of course completers and non-
completers from a discourse perspective on course content review, via a chi-square test.
They found that completers were more likely to post original and less negative opin-
ions, whilst non-completers were more willing to reply to and criticise others’ posts.
Inspired by their work, we implement a Wilcoxon signed-rank test for completers and
non–completers to learn their transition behaviours among different learning themes,
separately. Additionally, we also apply two machine learning algorithms for early
completion prediction, based on our analysis of two groups of student activities during
the first week.

3 Methodology

To explore if completers and non-completers behave differently, we apply visualisation
analytics firstly, to identify the different learning paths executed by these groups and
then implements statistical modelling to analyse their learning behaviour (transition
from themes such as video, quiz, discussion, review and article) across different
courses. Additionally, by comparing dropout learners’ transition from different learning
activities across different courses, the paper offers insights into the impact of the
designed course learning path on the learning behaviour of participants.
356 A. Alamri et al.
3.1 Dataset
The dataset of learner activities has been extracted from 8 runs of 4 Future Learn-
delivered courses from The University of Warwick between 2013 and 2017, with over
than 106,036 learners. Runs are defined as the number of repetitive teaching session for
each course. We investigate learner activities across different domains: Psychology
(The Mind is Flat and Babies in Mind), Literature (Shakespeare and His World) and
Computer Science (Big Data). The over 1.5 million learner activities include watching
videos, taking a quiz, discussion, submitting assignments, viewing assignment feed-
back and reviewing another learner’s assignment and giving feedback (Table 1).
Table 1. The dataset of learner activities
Course Title & Run Enrolled Accessed 1 step Dropout Completers
Babies in Mind Run 1 12651 5841 4634 1207
Run 2 9740 4924 4030 894
Big data Run 1 11281 4715 4202 513
Run 2 5761 3840 3583 257
Shakespeare and His World Run 1 15914 9050 7170 1880
Run 2 12692 6902 5804 1098
The Mind is Flat Run 1 22929 8198 6858 1340
Run 2 15068 6760 5743 1017
Of all participants, 50230 learners have accessed at least one step of the course, but
over half, 53%, have never accessed the course after registration. The 42024 learners
who accessed less than 80% are defined as dropout learners. The 8206 learners who
accessed 80% or more of the materials in one run are defined as completers. The 80%
threshold (as opposed to, e.g., 100% completion) is based on prior literature discussing
different ways of computing completion [23]. Completers represent 7% of the total and
16% of the learners who accessed at least once.
3.2 Visualisation of High and Low Granularity Levels
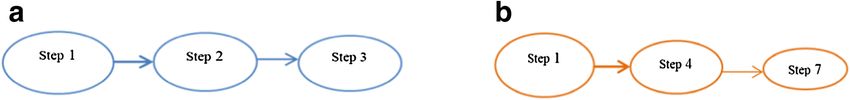
After analysing the learning path of learners, we have divided the dataset of learners’
activities into two components: linear and catch-up (Fig. 1). The former shows the
linear path between two sequential steps and the latter shows the catch-up activities,
i.e., jumping behaviour. The paper implements a flow network analysis, to present the
learning pattern for linear (source: xi−1, destination: xi) and catch-up (source: xi−1,
destination 6¼ xi). Depending on the granularity, the learning pattern is further identi-
fiable as bird’s eye view, i.e., high granularity (a node representing multiple steps), and
fish-eye view, i.e., low granularity view (step-level representations). In addition, course
activities have been grouped by different colours, based on their themes.Is MOOC Learning Different for Dropouts? 357
Fig. 1. Examples: a) Linear activities b) Catch-up activities
The size of the circle represents the number of learners who accessed the course
content and the thickness of the arrow shows the percentage of learners’ movements.
3.3 Statistical Analysis and Machine Learning
We applied the Shapiro–Wilk test for normality check. For non-parametric data, we
applied the Wilcoxon signed-rank test for significance measurement of differences
between groups. We report results as percentages, instead of a total number of learners,
to eliminate the effects of having different numbers of learners for each course. To
explore more on learners’ engagement with different learning themes, we also build an
early dropout prediction model based on the time spent on each activity, by ensemble
machine learning methods: Gradient Boosting [24] and XGBoost [25].
4 Results and Discussion
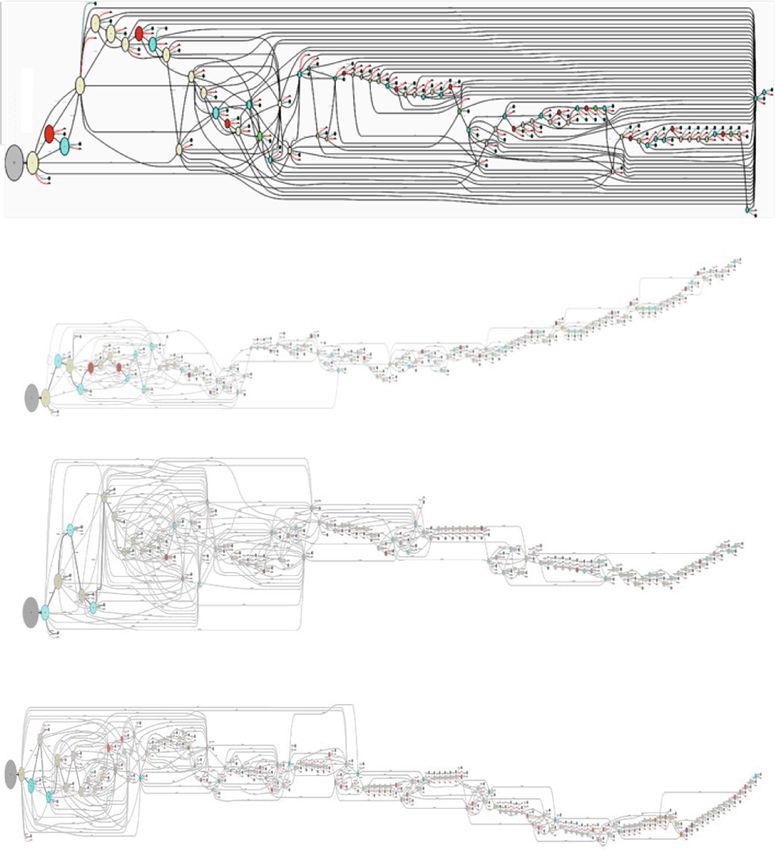
The flow network analysis shows that completers are more likely to complete the
courses linearly (Figs. 4 and 5), whilst non-completers are more likely to skip quizzes
and assessments (the catch-up learning pattern; Figs. 2 and 3 which mainly show the
overall learning pattern instead of providing a clear view in details due to the course
length). For instance, non-completers have various learning paths; some of them may
directly jump to lessons in week two after accessing the first lesson (Fig. 3). Instead,
completers are much more “obedient”, as they mainly follow the designed learning
path, compared with dropout learners; interestingly, this holds true across different
domains - as the bird eye views in Fig. 2 show. Statistical analysis results in Table 2
further confirm that these learning paths are significantly different.358 A. Alamri et al.
a) Babies in Mind
b) Big Data
c) The Mind is Flat
d) Shakespeare
Fig. 2. Dropout learners learning path (bird eye view)Is MOOC Learning Different for Dropouts? 359
Article
Test
Review
Assignment
Reflection
Quiz
Discussion
Vide
Fig. 3. Dropout learning path, first week (Shakespeare and his world) fish eye view
Table 2. P-values of linear and catch-up learning activities
P-value Catch-up activities Linear activities
Babies in Mind Run 1 1.13E−13 (p < 0.001) 2.46E−85 (p < 0.001)
Babies in Mind Run 2 7.74E−14 (p < 0.001) 2.32E−62 (p < 0.001)
Big Data Run 1 2.66E−018 (p < 0.001) 5.97E−110 (p < 0.001)
Big Data Run 2 1.35E−68 (p < 0.001) 2.66E−18 (p < 0.001)
Shakespeare Run 1 1.130E−13 (p < 0.001) 2.09E−23 (p < 0.001)
Shakespeare Run 2 7.73E−14 (p < 0.001) 1.87E−09 (p < 0.001)
Mind is Flat Run 1 2.66E−018 (p < 0.001) 5.21E−74 (p < 0.001)
Mind is Flat Run 2 6.62E−63 (p < 0.001) 2.51E−16 (p < 0.001)
Fig. 4. Completers learners learning path (Bird eye view). a: Babies in Mind b: Big Data c: The
Mind is Flat d: Shakespeare360 A. Alamri et al.
Fig. 5. Completers learning path, first week (Shakespeare) fish eye view
Then, we chart the percentage of learning transition from different themes for the
two learner groups (Fig. 6). We compared dropout after their last accessed activity:
video, discussion, quiz and article for the four courses. The figure illustrates that
learners are more likely to drop out after articles and videos. Interestingly, participants
drop out the least after discussion. The attraction of discussion has been confirmed by
our statistical analysis across courses. The reason may be that participants feel
encouraged to share their knowledge and can gain support [26]. In the Literature
course, Shakespeare, participants were more likely to drop out after the assignment.
The reason may be the difficulty of the creative writing at the final week that learners
are required to write their film, book, ballet or musical; this is useful feedback for the
course designers to change assignments potentially. The figures also suggest that the
dropout patterns, according to themes are similar across runs.
Fig. 6. Number of dropout/topic: a) first run b) second run
Furthermore, we predict the early dropout (dropout in first 10% of the course’s
duration) of the four courses based on time spend on each activity via two machine
learning algorithms. The higher indicator of dropout per video shown in Fig. 6, the
higher prediction accuracy demonstrated in Table 3, which indicates video theme is
more predicable at an early stage of learning. For instance, the numbers of dropout per
video in the Mind is Flat, Babies in Mind, Big Data and Shakespeare four courses in
second run are: 65, 48, 47, 42 and the accuracy also follows this order.Is MOOC Learning Different for Dropouts? 361
Table 3. Early prediction (in first ten percentage of course) of dropout
The mind is flat Babies in Mind Big Data Shakespeare
XG Boosting 89.3% 86.5% 83.6% 83.2%
Gradient Boosting 89.3% 86.5% 83.7% 83.5%
To explore the relationship between learning themes at a macro, i.e. bird-eye level,
we visualise the catch-up transition behaviour for dropout learners (Fig. 7; as most
completers transit from themes as designed).
Fig. 7. Babies in Mind (left) & Big Data (right): catch-up themes transition, dropout learners
The most significant component, 25.9% and 24.12% of the participants continue
from videos to videos and switch from videos to articles in the Babies in Mind and Big
Data courses, respectively. The transition from videos to articles is 24.12% in the Big
Data course, i.e., nearly one-quarter of the dropout learners lose interests after reading
papers. Therefore, course designers should consider replacing some readings with
interactive activities, to improve engagement. Interestingly, 17.1% dropouts transfer
from quizzes to quizzes, which could be inefficient attempts to finish quickly. Such
behaviour can inform instructors to intervene early.
5 Conclusion and Limitations
The paper visualises and compares different learning paths of completers and non-
completers across four MOOCs, and explores from which learning theme learners tend
to drop out. We have shown how different granularity visualisation (fish eye, bird eye)
allows both researchers, and potentially teachers, to understand where issues occur and
where patterns emerge, backed up by statistical analysis. Specifically, we have shown
that course completers are more likely to learn linearly, while the dropout learners are
more likely to jump forward to a later activity, which we dubbed here as “catch-up”
learning pattern. Additionally, we find that video learning pattern is a powerful362 A. Alamri et al.
indicator for early prediction of dropout for learners, validated by two machine learning
models, XG Boosting and Gradient Boosting. Our research has shown the benefits of
theme-based visualisation, based on which we have identified that non-completers are
more likely to watch videos and skip quizzes, shown by their transition from other
themes, to videos. Moreover, we show how this type of analysis can generate fine-
grained ideas for instructors and course designers; e.g., to improve retention, instructors
(and online course designers) should introduce more discussion support mechanisms.
Limitations include clickstream analysis not entirely reflecting the true engagement
of learners with learning activities (as learners may, e.g., click the complete button too
soon). Additionally, we only consider the first access, due to our data limitations, which
may underestimate jumping patterns of dropout learners. Other learning features could
be considered, e.g., length of activity accessed.
References
1. Jordan, K.: MOOC Completion Rates: The Data (2013). Retrieved 27th July 2013, http://
www.katyjordan.com/MOOCproject.html. Accessed 01 Feb 2020
2. Onah, D.F., Sinclair, J., Boyatt, R.: Dropout rates of massive open online courses:
behavioural patterns. In: EDULEARN 2014 Proceedings, vol. 1, pp. 5825–5834 (2014)
3. Fei, M., Yeung, D.Y.: Temporal models for predicting student dropout in massive open
online courses. In: 2015 IEEE International Conference on Data Mining Workshop
(ICDMW), pp. 256–263. IEEE (2015)
4. Crossley, S., Paquette, L., Dascalu, M., McNamara, D.S., Baker, R.S.: Combining click-
stream data with NLP tools to better understand MOOC completion. In: Proceedings of the
Sixth International Conference on Learning Analytics & Knowledge, pp. 6–14 (2016)
5. Xing, W., Chen, X., Stein, J., Marcinkowski, M.: Temporal predication of dropouts in
MOOCs: reaching the low hanging fruit through stacking generalization. Comput. Hum.
Behav. 58, 119–129 (2016)
6. Nagrecha, S., Dillon, J.Z., Chawla, N.V.: MOOC dropout prediction: lessons learned from
making pipelines interpretable. In: Proceedings of the 26th International Conference on
World Wide Web Companion, pp. 351–359 (2017)
7. Davis, D., Chen, G., Hauff, C., Houben, G.J.: Gauging MOOC Learners’ Adherence to the
Designed Learning Path. International Educational Data Mining Society (2016)
8. Santos, J.L., Klerkx, J., Duval, E., Gago, D., Rodríguez, L.: Success, activity and drop-outs
in MOOCs an exploratory study on the UNED COMA courses. In: Proceedings of the
Fourth International Conference on Learning Analytics and Knowledge, pp. 98–102. ACM
(2014)
9. Kloft, M., Stiehler, F., Zheng, Z., Pinkwart, N.: Predicting MOOC dropout over weeks using
machine learning methods. In: Proceedings of the EMNLP 2014 Workshop on Analysis of
Large Scale Social Interaction in MOOCs, pp. 60–65 (2014)
10. Alamri, A., et al.: Predicting MOOCs dropout using only two easily obtainable features from
the first week’s activities. In: Coy, A., Hayashi, Y., Chang, M. (eds.) ITS 2019. LNCS, vol.
11528, pp. 163–173. Springer, Cham (2019). https://doi.org/10.1007/978-3-030-22244-4_20
11. Coffrin, C., Corrin, L., de Barba, P., Kennedy, G.: Visualizing patterns of student
engagement and performance in MOOCs. In: Proceedings of the Fourth International
Conference on Learning Analytics and Knowledge, pp. 83–92. ACM (2014)Is MOOC Learning Different for Dropouts? 363
12. Ye, C., Biswas, G.: Early prediction of student dropout and performance in MOOCSs using
higher granularity temporal information. J. Learn. Anal. 1(3), 169–172 (2014)
13. Greene, J.A., Oswald, C.A., Pomerantz, J.: Predictors of retention and achievement in a
massive open online course. Am. Educ. Res. J. 52(5), 925–955 (2015)
14. Li, X., Wang, T., Wang, H.: Exploring N-gram features in clickstream data for MOOC
learning achievement prediction. In: Bao, Z., Trajcevski, G., Chang, L., Hua, W. (eds.)
DASFAA 2017. LNCS, vol. 10179, pp. 328–339. Springer, Cham (2017). https://doi.org/10.
1007/978-3-319-55705-2_26
15. Guo, P.J., Reinecke, K.: Demographic differences in how students navigate through
MOOCs. In: Proceedings of the First ACM Conference on Learning@ Scale Conference,
pp. 21–30. ACM (2014)
16. Jiang, S., Williams, A., Schenke, K., Warschauer, M., O’dowd, D.: Predicting MOOC
performance with week 1 behaviour. In: Educational Data Mining 2014 (2014)
17. Wen, M., Rosé, C.P.: Identifying latent study habits by mining learner behaviour patterns in
massive open online courses. In: Proceedings of the 23rd ACM International Conference on
Information and Knowledge Management, pp. 1983–1986. ACM (2014)
18. Gao, M., Zhang, J.J., Sun, D., Zhang, J.: Using clickstream to understand learning paths and
the network structure of learning resources: using MOOC as an example (2019)
19. Zheng, Y., Yin, B.: Big data analytics in MOOCs. In: 2015 IEEE International Conference
on Computer and Information Technology; Ubiquitous Computing and Communications;
Dependable, Autonomic and Secure Computing; Pervasive Intelligence and Computing,
pp. 681–686. IEEE (2015)
20. Zhao, Y., Davis, D., Chen, G., Lofi, C., Hauff, C., Houben, G.J.: Certificate achievement
unlocked: how does MOOC learners’ behaviour change? In: Adjunct Publication of the 25th
Conference on User Modeling, Adaptation and Personalization, pp. 83–88 (2017)
21. Watted, A., Barak, M.: Motivating factors of MOOC completers: comparing between
university-affiliated students and general participants. Internet High. Educ. 37, 11–20 (2018)
22. Peng, X., Xu, Q.: Investigating learners’ behaviours and discourse content in MOOC course
reviews. Comput. Educ. 143, 103673 (2020)
23. Cristea, A.I., Alamri, A., Kayama, M., Stewart, C., Alsheri, M., Shi, L.: Earliest predictor of
dropout in MOOCs: a longitudinal study of FutureLearn courses. Association for
Information Systems (2018)
24. Friedman, J.H.: Greedy function approximation: a gradient boosting machine. Ann. Stat.,
1189–1232 (2001)
25. Chen, T., Guestrin, C.: XGBoost: a scalable tree boosting system. In: Proceedings of the
22nd ACM SIGKDD International Conference on Knowledge Discovery and Data Mining,
pp. 785–794. ACM (2016)
26. Warren, J., Rixner, S., Greiner, J., Wong, S.: Facilitating human interaction in an online
programming course. In: Proceedings of SIGCSE 2014, pp. 665–670. ACM Press, New
York (2014)You can also read