2025 TOURISM DUNEDIN TOURISM GROWTH FRAMEWORK - Dunedin Host

Page created by Paul Sparks
 
CONTINUE READING
2025 TOURISM DUNEDIN TOURISM GROWTH FRAMEWORK - Dunedin Host
TOURISM
2025
DUNEDIN TOURISM
GROWTH FRAMEWORK

                                 T
TARGET: $1.6 BILLION BY 2025

                 A             F
   D           R                    DEVELOPED BY

                               WITH SUPPORT FROM
2025 TOURISM DUNEDIN TOURISM GROWTH FRAMEWORK - Dunedin Host
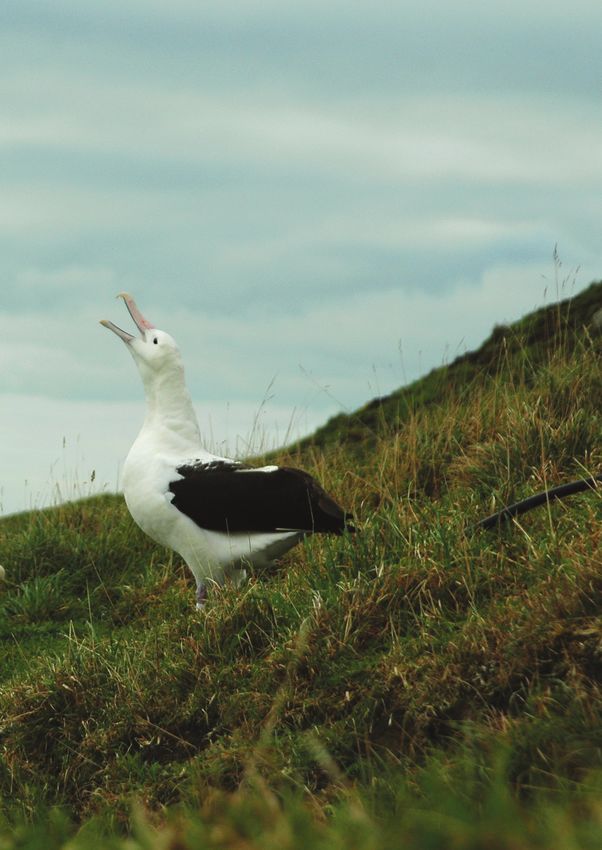
DUNEDIN TOURISM’S ASPIRATIONAL GOAL

        $1.6 BILLION
     total tourism revenue in 2025

         Tē tōia, tē haumatia
         NOTHING CAN BE ACHIEVED WITHOUT A PLAN

Front Cover: Dunedin Railway Station © James Lewis
2025 TOURISM DUNEDIN TOURISM GROWTH FRAMEWORK - Dunedin Host
HOW WE ARE GETTING THERE

    By improving the value,
competitiveness, sustainability and
   connectivity of Dunedin’s
         tourism industry.

                         Albatross © The Royal Albatross Centre
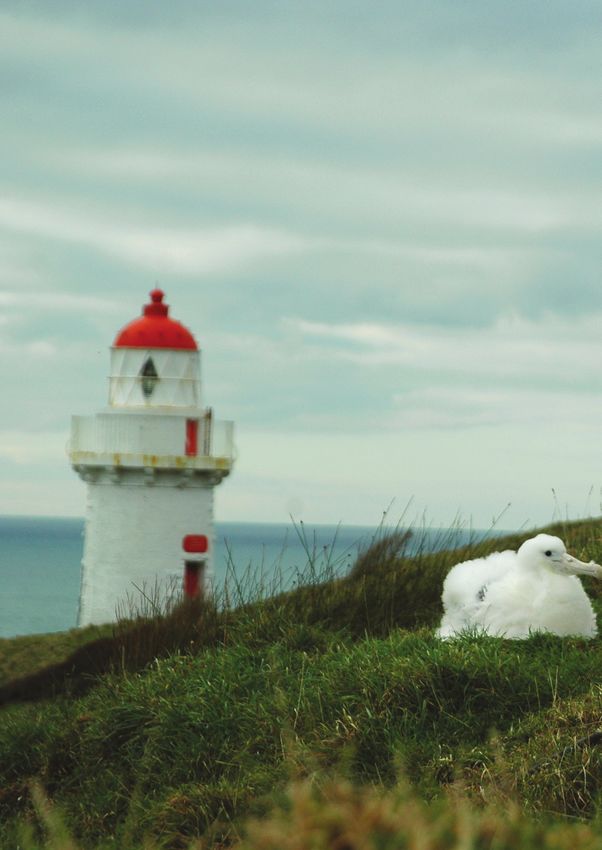
2025 TOURISM DUNEDIN TOURISM GROWTH FRAMEWORK - Dunedin Host
Page | 2

A FRAMEWORK FOR GROWTH

The Dunedin tourism sector has developed the following regionalised tourism
strategy, based on the national Tourism 2025 Growth Framework, to drive tourism
revenue growth in Dunedin to $1.6 billion per year by 2025.

SUMMARY OF THE NATIONAL                                   THE DUNEDIN FRAMEWORK
2025 TOURISM GROWTH
FRAMEWORK                                                 In 2017 DunedinHOST, with support from Tourism
                                                          Industry Aotearoa and the wider tourism sector
                                                          developed the Dunedin Tourism 2025 Growth
The national Tourism 2025 Growth Framework was            Framework.
launched in 2013.
                                                          Dunedin is positioned to capitalise on the
Central to the framework to achive sector growth are      opportunities of the current sector growth phase, by
the key themes:                                           focussing on the key national themes, while taking
• Visitor Experience                                      into account the need for sustainability, regional
• Target for Value                                        dispersal, and seasonality to create an environment
                                                          that encourages investment and growth in the local
• Air Connectivity
                                                          tourism economy.
• Productivity
    - backed by Insight.

                                                          WHAT IS TOURISM?
In 2016, Tourism Industry Aotearoa (TIA) prepared
the Tourism 2025 – Two Years On report. It showed         For the purposes of this framework “tourism
there had been impressive progress in achieving its       economy“ means all revenue derived from both
growth targets at a national level:                       international and domestic travellers to the Dunedin
• Airline capacity has increased                          region.
• Value has grown faster than volume                      Visitation may be driven by tourism, business and
• International visitor satisfaction has remained         conference activities, visiting friends and family,
  at a high level, and                                    specific purposes such as sporting and concert events
• Total tourism expenditure has reached $34.7            at the stadium, local festivals, and other events such
   billion, well ahead of the pathway to $41 billion by   as national sporting events, and graduations.
   2025.
In response to this positive data TIA refocussed
the Framework to emphasis a need to support
seasonality, regional dispersal, capacity development
and infrastructure, and sustainability.

Dunedin Tourism Growth Framework
For Consultation: 29 March 2017
2025 TOURISM DUNEDIN TOURISM GROWTH FRAMEWORK - Dunedin Host
Page | 3

NATIONAL TOURISM REVENUE GROWTH

THE POWER OF TOURISM
IN THE REGIONS
The tourism industry makes a significant contribution
to regional economic development through jobs and
income it creates.
Only a fraction of visitor spending occurs in
places commonly considered visitor specific e.g
accommodation, attractions. The rest takes place in
shops, cafes, petrol stations, and other local businesses.

                                                             Dunedin Tourism Growth Framework
                                                               For Consultation: 29 March 2017
2025 TOURISM DUNEDIN TOURISM GROWTH FRAMEWORK - Dunedin Host
Page | 4

NEW ZEALAND TOURISM PERFORMANCE

The following data series demonstrates national tourism growth against the
Tourism 2025 key performance indicators.

    NZ TARGET FOR VALUE
1. Tourism Expenditure (TSA) – Total, International and Domestic
					                                                                         % increase     % increase
    YE March ($billion)                     2014        2015         2016      2015/16        2014/16
    Total expenditure                       28.0        30.9         34.7          12.2           23.8
    International tourism expenditure       10.3        12.1         14.5          19.6           40.0
    Domestic tourism expenditure            17.7        18.8         20.2           7.4           14.2
    Comment: Strong progress

2. International Arrivals (IVA) – Total and Holiday
					                                                                        % increase     % increase
   YE Dec 2016                            2014     2015 2016                  2015/16        2014/16
   Total arrivals                  2,857,400       3,131,927    3,499,939         11.8            22.4
   Holiday arrivals                1,368,672       1,563,776    1,817,136         16.2            32.8
   Comment: Strong progress

3. Expenditure per International Arrival (TSA, IVA) – International
    YE March $                                          2014           2015                2016
    Total spend per international visitor              3,759          4,110               4,450
    Comment: Strong progress

 NZ CONNECTIVITY
4. Air Connectivity (Sabre) – Total Air Capacity (seats)
   YE March                                             2014 2015                         2016
    International seats to New Zealand              6,758,304     6,995,962       7,573,946
    Domestic seats within New Zealand              13,519,821    13,950,978      14,775,560
    Comment: Strong progress

Dunedin Tourism Growth Framework
For Consultation: 29 March 2017
2025 TOURISM DUNEDIN TOURISM GROWTH FRAMEWORK - Dunedin Host
Page | 5

NEW ZEALAND TOURISM PERFORMANCE

The following data series demonstrates national tourism growth against the
Tourism 2025 key performance indicators.

 NZ VISITOR EXPERIENCE
5. Overall Visitor Satisfaction (IVS) – Total International
    YE June %                                           2014          2015              2016
    Met or Exceeded Expectations                         93.2         95.1               94.9
    Comment: Sustained at High Level

 NZ PRODUCTIVITY
6. Seasonality (IVA) – Total International Arrivals by Season
    (% of annual arrivals)                          2013/14       2014/15           2015/16
    Winter (Jun to Aug)                                  19.1         18.4               17.8
    Spring (Sep to Nov)                                  22.9         22.6               22.7
    Summer (Dec to Feb)                                  35.0         35.2               35.3
    Autumn (Mar to May)                                  23.0         23.7               24.2
    Comment: Progress in Autumn Travel Emerging

7. Dispersal (MRTEs) – International Spend by Gateway and Regional RTOs
    YE June (% of total spend)                          2014          2015               2016
    Gateway RTOs (Auck, Well, ChCh, Qtown)                 64           65                  65
    Regional RTOs (all other RTOs)                         36           35                  35
    Comment: No Progress

Statistics supplied by TIA: As at 26 October 2016

                                                                             Dunedin Tourism Growth Framework
                                                                               For Consultation: 29 March 2017
2025 TOURISM DUNEDIN TOURISM GROWTH FRAMEWORK - Dunedin Host
Page | 6

NEW ZEALAND SCORECARD –
MEASURING SUCCESS

                             TOURISM 2025                                                         The Aspirational Goal:                                                                                                              Tourism
                             SCORECARD                                                            $41 billion total tourism                                                                                                           2025>
                                                                                                                                                                                                                                      GROWING value together
                             > TO 2016                                                            revenue in 2025                                                                                                                     Whakatipu Uara Ngatahi

                                                                                                                                                                                                                      UP
                                                                                                                                                                                                             23.8%
                                                                                                                                                                                        UP
                                   TARGET FOR VALUE
                                                                                                                                                                                   12.2%            15/16
                                                                                                                                                                                                                             14/16

                                 TOURISM EXPENDITURE
                                 Source: Tourism Satellite Account

                                         DOMESTIC               INTERNATIONAL

                                                                                                                                                                                                             2016

                                                                                                                                                                                                                                                $14.5 BILLION
                                                                                                                                                                                       .2 BILLION

                                                                                                                                                                                                                                                                        PROGRESS
                                                                                                                         2015

                                                                                                                                                                                                                                                                        STRONG
                                                                                                      BILLION

                                                                                                                                                         $1 2 .

                                                    2014
                                                                               $10.

                                                                                                                                                               1 BILLION
                                      .7 BILLION

                                                                                                                                                                                    $20
                                                                                   3 BILLIO

                                                                                                                                                                                                                Total for year
                                                                                                          .8

                                                                                                                                                                                                               $34.7 BILLION
                                                                                                      $18

                                                                                                                             Total for year
                                                                                                                            $30.9 BILLION
                                                     Total for year
                                        $17

                                                                                           N

                                                     $28 BILLION

                                 20
                                               INTERNATIONAL ARRIVALS GROWTH V
               % annual growth

                                 15
                                               INTERNATIONAL SPEND GROWTH
                                 10

                                  5

                                  0
                                                               2014                                                                 2015                                                                                   2016

                                 VISITOR EXPERIENCE                                                             CONNECTIVITY

                                 VISITOR SATISFACTION                                                           INTERNATIONAL                                                                       DOMESTIC
                                 Source: International Visitor Survey                                           Source: SABRE - Total air capacity (seats)

                                                                        94.9%
                                                                        2016
                                                                                                                                                        6.7m                                                                               13.5m
  MAINTAINED

                                                                                                            2014                                                                                     2014
                                                                                                                                                                                                                                                                        PROGRESS
                                                                                                                                                                                                                                                                        STRONG

                                                              95.1%
                                                              2015                                          2015                                        6.9m                                         2015                                  13.9m
                                                     93.2%
                                                     2014                                                   2016                                        7.5m                                         2016                                  14.8m
                                 PRODUCTIVITY

                                 DISPERSAL OF TOURISM SPENDING                                                                                                SEASONALITY - International Visitor Arrivals by Season
                                 Source: MBIE Monthly Regional Tourism Estimates                                                                              Source: MBIE

                                                                                                                                                                    35%
 NO PROGRESS

                                                                                                                                                                                                                                                                          NO PROGRESS

                                                                                                                                                                           35%                                   35.2%                                          35.3%

                                              36%                          35%                                         35%                                          30%

                                                        64%                                     65%                                  65%                            25%                                          23.7%                                          24.2%
                                                                                                                                                                           23%

                                                                                                                                                                           22.9%                                 22.6%                                          22.7%

                                                   2014                                        2015                              2016
                                                                                                                                                                    20%
                                                                                                                                                                                                                 18.4%
                                                                                                                                                                                                                                                                17.8%
                                                                                                                                                                           19.1%

                                                                           GATEWAY                              REGIONAL                                                   2014                                  2015                                           2016
                                                                           Auckland, Wellington,                All other RTOs
                                                                           Christchurch, Queenstown
                                                                                                                                                                                                    Winter   Spring          Summer    Autumn

Dunedin Tourism Growth Framework
For Consultation: 29 March 2017
2025 TOURISM DUNEDIN TOURISM GROWTH FRAMEWORK - Dunedin Host
Page | 7

DUNEDIN TARGET $1.6 BILLION BY 2025

The Dunedin tourism sector has regionalised the national Tourism 2025 Growth Framework to recognise
the factors that influence, or could influence, growth in the Dunedin tourism economy.

The national framework recognises that not only do operators benefit directly from this targeted growth,
but a much wider spin-off can be seen across many sectors of the local economy and community.

Dunedin becomes an increasingly desirable destination for people wanting to visit, live, work, study and
invest here.

AN ASPIRATIONAL TARGET
 In the year ending December 2016 Dunedin
 generated the following revenue from tourism:

 • $694 million        Total revenue

 			    $211 million		        International
 			    $483 million		        Domestic

 Based on the above figures and annual growth
 year on year of 10%, the Dunedin tourism                   If the sector aims for
 economy could achieve $1.6 billion by 2025.
                                                            10% growth year on
 YEAR		        $MILLION
                                                            year by leveraging the
 2016		        $694
 2017          $763                                         framework, the target
 2018          $839                                         would be achieved.
 2019          $923
 2020          $1.015
 2021          $1.117
 2022          $1229
 2023          $1.352
 2024          $1.487
 2025          $1.636

                                                                              Dunedin Tourism Growth Framework
                                                                                For Consultation: 29 March 2017
2025 TOURISM DUNEDIN TOURISM GROWTH FRAMEWORK - Dunedin Host
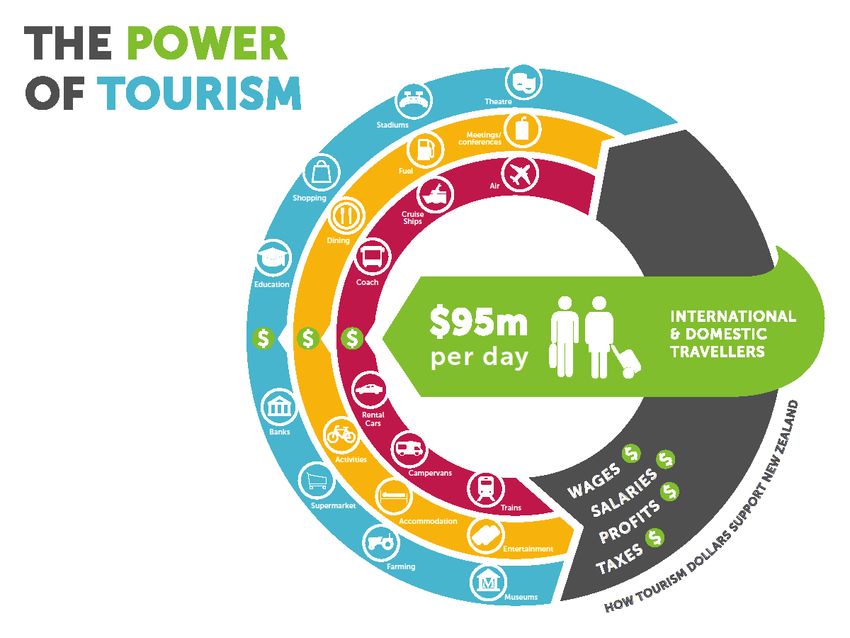
Annual spend grouped by Regional Tourism
Organisation
 Page | 8    (RTO), country of origin, and
product category
 PRODUCTIVITY FOR PROFIT
 Monthly Regional Tourism Estimates 2016
      Domestic               International            ?   Reset

 Use the resources deployed in tourism to generate profit and attract investment.
 Annual Spend grouped by RTO                                                                       Annual Spend grouped by TA
 Search for new solutions for seasonality and regional dispersal, and to find ways
 to improve our capability.
   Auckland RTO                                                                                        Dunedin City, $694m

 Increase
  Christchurch yield across all products, sectors and key target markets.
   Queenstown RTO

 Create         an economy that attracts development of existing and investment in new
   Wellington RTO
  Waikato RTO
 tourism
  Northland RTO  product.
   Bay of Plenty RTO
   Rotorua RTO
   South Canterbury

 ACTIVATE
 Dunedin RTO RETAIL SPEND AND GENERATE NEW REVENUE FROM THIS SECTOR
   Nelson Tasman RTO
   Hawke's Bay RTO
   Lake Taupo RTO
 InManawatu
      DunedinRTO    the retail sector is the largest earner of                                          What retail and complementary hospitality
   West Coast RTO
 tourism        dollars.
   Lake Wanaka RTO
                                                                                                        activities will encourage growth in retail returns?
   Coromandel RTO
 Retail				$324
  Southland RTO million                                                                                 • Understand what tourists buy and what
   Marlborough RTO
                                                                                                          market sectors are of most value: Domestic vs
 Food       and Beverage
  Taranaki RTO
                                                          $97 million
  North Canterbury                                                                                        International, Country specific (ie “Octagon
   Kapiĕ‐Horowhenua RTO
 Other       passenger transport
 Fiordland RTO                                            $75 million                                     Market ” vs directing visitors to higher value
   Central Otago RTO                                                                                      locally-made/authentic products)
 Accommodation
  Ruapehu RTO
               		                                         $67 million
   Waitaki RTO                                                                                          • Support and encourage growth and investment
   Wairarapa RTO
 Other      tourism product
 Gisborne RTO                                             $51 million*                                    in tourist retail offering
   Kawerau‐Whakatane

  (*Annual
   Whanganui RTO spend grouped by Regional Tourism                                                      • Give consideration to drop-off and pick-up
   Clutha
  Organisation         Dunedin, country of origin, and                                                    zones to enable easy access to retail areas – for
$0m      $1,000m $2,000m $3,000m $4,000m $5,000m $6,000m $7,000m
  product category, MBIE YE 28 Sept 16).                                                                  campers, tours, cruise buses, private and FIT.

                       Spend by Product                                                Spend by Country                                         Total spending for year to December

                                                                  NZ
   Retail sales ‐ other
                                                                  Australia

   Food and beverage serving services                             USA                                                                          $600m

                                                                  China

   Other passenger transport                                      UK                                                                           $500m

                                                                  Rest of Europe
   Retail sales ‐ alcohol, food, and beverages
                                                                                                                             Total spend NZD

                                                                  Rest of Asia                                                                 $400m

                                                                  Germany
   Accommodaĕon services
                                                                                                                                               $300m
                                                                  Canada

   Other tourism products                                         Japan
                                                                                                                                               $200m
                                                                  Korea, Republic of

   Retail sales ‐ fuel and other automoĕve products               Africa and Middle East
                                                                                                                                               $100m
                                                                  Rest of Americas
   Cultural, recreaĕon, and gambling services
                                                                  Rest of Oceania
                                                                                                                                                $0m
$0m        $50m           $100m       $150m      $200m        $0m         $100m        $200m   $300m     $400m                                     2009   2010   2011   2012   2013   2014   2015   2016

 Dunedin Tourism Growth Framework
 For Consultation: 29 March 2017
Page | 9

PEOPLE AND SKILLS                                       INCREASE LENGTH OF STAY AND
                                                        CAPACITY
• Upskill existing staff to provide excellent service
  and knowledge of Dunedin’s offering – upsell          • Let’s change: “I didn’t know there is so much to
  on arrival                                              do in Dunedin; I wish I had stayed another day”
                                                          to “I loved the extra days I spent in Dunedin”
• Retain staff and grow the number of people
  employed in tourism in Dunedin                        • Encourage accommodation providers to
                                                          promote “+Stay (a-while-longer)” packages
• Work with training providers to develop staff
  with appropriate skills.                              • Package attractions and events with travel
                                                          and accommodation, working directly with
                                                          operators and iSite
REDUCE SEASONALITY WITH A FOCUS ON                      • Extend business/leisure opportunities
DEVELOPING OR ATTRACTING                                • Create event packages beyond event day.

• Unique offerings: nature, culture, heritage
• Cornerstone events in off-season                      WEBSITE PART OF THE
• Business events and conferences into shoulder         TRAVEL EXPERIENCE
  season
                                                        • Make building a Dunedin itinerary easier online
• Enhanced education opportunities (eg                    before and during a visit eg DunedinNZ.com
  graduations, international student family visit-        website to be an “online i-site” promoting local
  packages)                                               product and itinerary planning to encourage
• Investment in high-yield tourism products and           people to plan in advance to stay longer.
  services (eg Marine eco-tourism, Night Skies etc).

                                                        CALENDAR OF EVENTS
                          Hoiho (yellow-eyed penguin)

                                                        • Created for operators to assist in planning,
                                                          filling gaps, growing off-peak activity, and
                                                          avoiding overlap of events.
                                                        • Include major events, conferences, festival,
                                                          sporting events – local/national/international,
                                                          concerts, graduations, cruise ship visits.

                                                                              Dunedin Tourism Growth Framework
                                                                                For Consultation: 29 March 2017
Page | 10

VISITOR EXPERIENCE

Drive value through outstanding visitor
experience.                                         POSITIONING

By listening to our visitors and                    • Promote Dunedin’s points of difference –
understanding their needs we can                      support key messaging – natural (wildlife and
continuously improve the experience                   location), and cultural heritage (architecture,
enjoyed by our visitors.                              food, wine, retail, cultural)
Provide outstanding customer                        • Support new national and local initiatives eg
experience which is safe, secure and                  South-East Marine Protected Areas, cycleways
delivers highest levels of customer                 • Aim to increase value per visitor through new
service, exceeding expectations.                      major product development.

EXPERIENCE REAL
                                                    WEBSITE
SOUTHERN HOSPITALITY

• Embrace New Zealand’s unique hospitality          • Hospitality starts online – make it easy to find
• Visitors have a New Zealand experience, which       and get to Dunedin.
  grows the capability of New Zealanders to
  deliver (develop the ‘Kiwiness’ of experience).
                                                    SUSTAINABILITY

MEASURE                                             • Understand what we are doing, and why, and
                                                      what steps we can take to preserve our unique
                                                      position in the market
• Measure visitor satisfaction at operator level
  and benchmark against national visitor            • Quality visitors, not Quantity (sustainability due
  satisfaction surveys. (Enterprise Dunedin,          to demand)
  University of Otago and Otago Polytechnic         • Ensure that tourism products developed
  support. Collaboration required to develop          and offered are sustainable and protect the
  and report on insights).                            environment and the value of the offering
                                                    • Turn visitors and users of Dunedin product into
                                                      ambassadors.

Dunedin Tourism Growth Framework
For Consultation: 29 March 2017
Page | 11

CONNECTIVITY

Grow sustainable connectivity
Use relationships, partnerships and collaboration opportunities to ensure Dunedin
is serviced by sustainable connections, both international, domestic and local.

DEVELOP DUNEDIN AS THE
                                                      CRUISE
SOUTHERN HUB

• Come\stay\explore                                   • Target yield from cruise by leveraging insights:
                                                        what do passengers buy, do, see, spend –
• Become a hub for exploring the wider area –           share information with key operators
  food, culture, heritage, wildlife, cycling, night
  viewing and education                               • Support this market by developing existing
                                                        product and offering new targeted product.
• Encourage people to stay longer, spend
  more, using Dunedin as their base to explore
  wider offerings eg Catlins and back in a day,
  explore Waitaki, Central Otago Rail Trail           ROAD/TOURING ROUTE
• Become the arrival and departures point to
                                                      • Promote growth and maintenance of road
  other destinations via connectivity – gateway
                                                        infrastructure to ensure it is meeting demand,
  to Rakiura (Stewart Island), Fiordland and
                                                        growing volume, locally and through regional
  Queenstown, Southern touring route.
                                                        connections
                                                      • Develop touring routes for cars, campers
                                                        cyclists and walkers from and to Queenstown,
AIR                                                     Fiordland, the south and east coast
                                                      • Support key suppliers in this market – camping
• Support Dunedin Airport to attract more               sites, food suppliers, service stations.
  international flights direct to Dunedin e.g.
  resume/develop direct east coast of Australia
  flights
                                                      CYCLE
• Create opportunities to develop more domestic
  travel routes
                                                      • Develop and support cycle connectivity to and
• Grow volume from Auckland, Queenstown                 from Dunedin eg pick-up/drop-off points and
  and Christchurch Airports for dispersal of            infrastructure, hire bikes, transportation and
  international tourists into region                    accommodation options
• Explore and support development of a drop-          • Support development of cycleways in and
  off/pick-up hub for campervans at Dunedin             around Dunedin linking to major national
  Airport.                                              cycleway initiatives (for community and visitors).

                                                                             Dunedin Tourism Growth Framework
                                                                               For Consultation: 29 March 2017
Page | 12

RAIL                                                  NZ TOURS

• Support further rail connectivity – Taieri Rail,    • Become a viable accommodation alternative
  Oamaru, Catlins.                                      to Queenstown

                                                      • Link into Auckland Airport International arrivals
                                                        direct to Dunedin – the Southern Hub.
ONLINE CONNECTIVITY

• Make it easy to find the information to get here.
  Improve DunedinNZ.com website
• Influence itinerary planning for South Island.

Larnach Castle

Dunedin Tourism Growth Framework
For Consultation: 29 March 2017
Page | 13

TARGET FOR VALUE

Target visitors with highly valued
attributes (such as spend, seasonal
pattern, regional dispersal) that deliver
the greatest overall economic benefit.

IDENTIFY GROWTH OPPORTUNITIES                        WEBSITE

• Analyse market data to understand our most         • Make it easy to plan and book an itinerary
  valued target markets, existing and potential        not just a single activity or room night eg an
                                                       activity or a room
• Act in a timely manner to get products and
  opportunities to market                            • One-click access to Dunedin attractions,
                                                       packages, accommodation, travel, itinerary
• Bring together sector operators – airline, land
                                                       builders
  transport, accommodation, events, education,
  retail and cruise to deliver products              • Package attractions locally to encourage
                                                       longer stays and higher value from conference,
• Effective planning and timely communications
                                                       meeting and business market.
  with tourism sector and Enterprise Dunedin –
  aim to collaborate on key sector initiatives and
  give long lead-times for buy-in
• Recognise and develop value of domestic            TARGET INTERNATIONAL TRADE
  tourism economy – secure new markets and
  encourage repeat visitation                        • Develop high-value export-ready
• Regional dispersal – make the most of                commissionable products
  opportunities from Auckland, Christchurch and
  Queenstown in shoulder and off-season              • Focus on attracting inbound tour operators
                                                       and interational travel agents in target markets
• Seasonality – promote and enhance growth in          to visit Dunedin.
  the shoulder and winter season
• Maximise major events – encourage extended–        • Actively target international accommodation
  stay packaging.                                      suppliers to invest in Dunedin

                                                                            Dunedin Tourism Growth Framework
                                                                              For Consultation: 29 March 2017
Page | 14

PRIORITISE INSIGHT TO DRIVE AND
TRACK PROGRESS

Tourism industry collects, analyses, disseminates and uses information to
provide the insights to inform the decisions needed to achieve the Tourism
2025 growth aspiration.
• Use insight tools to develop a replicable indicator set, eg key MRTEs figures (spend, by origin, spend
  per sector), CAM figures (guest nights, length of stay, origin), plus reliable local data, and visitor
  satisfaction tracking

• Information narrative distributed quarterly to operators and business owners within the Dunedin sector

• Dashboard tracking KPIs to track outcomes and inform ongoing development of the framework

• Annual scorecard to track trends and changes to inform the decisions to achieve the tourism 2025
  growth aspiration.

Copper Kettles © Tourism Dunedin

Dunedin Tourism Growth Framework
For Consultation: 29 March 2017
Page | 15

OWN THE FRAMEWORK

CONSULT FEBRUARY 2017

• Dunedin Host
• Enterprise Dunedin –
  Destination Dunedin Plan
• Tourism Industry Aotearoa
• Grow Dunedin Partnership
• Dunedin Airport
• Chamber of Commerce
• Tourism New Zealand
• Port Otago
• DMVL
• Kāi Tahu Runaka & Ngāi Tahu

COMMUNICATE MARCH 2017

• Distribute, share the framework with all stakeholders, members etc

INITIATE AND ACTIVATE

• Lead, support and collaborate to bring initiatives into effect

MEASURE AND REPORT
ON KEY INSIGHTS

• Report back to operators, and at leadership and local government level
• One year update 2017
• Two years on 2018

MEASURE AND MODIFY THE PLAN

                                                    Dunedin Tourism Growth Framework
                                                      For Consultation: 29 March 2017
Page | 16

APPENDIX ONE

QUICK FACTS & FIGURES

                      THE FACTS

                      • Tourism is a vital contributor to
                        New Zealand’s economic and
                        social wellbeing, generating
                        wealth and supporting jobs
                        in communities around the
                        country.
                      • Tourism is New Zealand's
                        largest export earner, overtaking
                        dairy in 2015/16.
                      • Tourism and its contribution is
                        felt at national, regional and
                        local levels throughout the New
                        Zealand economy.
                      • As well as visitor expenditure,
                        visitors contribute income to the
                        Government through GST, the
                        border levy, petrol tax and the
                        income taxes paid by people
                        directly employed in tourism,
                        and the company taxes paid
                        by the thousands of businesses
                        servicing visitors.
                      • The industry’s Tourism 2025
                        growth framework has a goal of
                        growing total tourism revenue
                        to $41 billion a year by 2025.

Knox Church © Ian J Brodie

Dunedin Tourism Growth Framework
For Consultation: 29 March 2017
Page | 17

$    THE FIGURES*

    • Total tourism expenditure reached $34.7 billion in the year
      ended March 2016, up 12.2% on the previous year.
    • International tourism expenditure reached $14.5 billion (YE
      March 16), up 19.6% on the previous year.
    • Tourism is New Zealand's biggest export industry, contributing
      20.7% of New Zealand's foreign exchange earnings.
    • Domestic tourism expenditure reached $20.2 billion (YE
      March 16), up 7.4% on the previous year.
    • International visitors are delivering $40 million in foreign
      exchange to the New Zealand economy each day of the
      year – one in five export dollars. Domestic tourism contributes
      another $55 million in economic activity every day.
    • Tourism generated a direct contribution to GDP of $12.9
      billion, or 5.6% of GDP (compared with $11.5 billion $10.6
      billion – 5.2% 4.9% of GDP in YE March 15).
    • The indirect value-added of industries supporting tourism
      generates an additional $9.8 billion for tourism – 4.3% of
      GDP.
    • 332,322 people are directly and indirectly employed in
      tourism in New Zealand - better than 1 in 8 jobs.
    • The Government’s collection of GST from international
      visitors increased to $1.1 billion (YE March 16), a 20.4%
      increase on the previous year. When GST paid by domestic
      travellers is included, the total GST take from annual tourism
      spending rises to $2.8 billion.
    • International students studying in New Zealand for less than
      12 months generated $2.7 billion in earnings in the YE
      March 2016, an increase of 8.6% on the previous year.

      *(Tourism Satellite Account, year ended March 2016,
      Statistics New Zealand)

                                          Dunedin Tourism Growth Framework
                                            For Consultation: 29 March 2017
For enquiries and feedback

dunedinhost.co.nz
dunedinhost.dunedinnz@gmail.com
You can also read