RESEARCH Industrial Vacancy Report - South African Property ...
←
→
Page content transcription
If your browser does not render page correctly, please read the page content below
RESEARCH Industrial Vacancy Report
Results for the           APRIL
12 months ended
December 2017             2018

KEY FINDINGS
As at December 2017, the national industrial vacancy rate as recorded by IPD was 3.3%. While this is
down from a revised 5.3% at December 2016, it is 100bps up from December 2015. Historic IPD data
going back to 1995 suggests that rental growth has lagged shifts in vacancy rate as excess supply or
demand typically takes a period of time to filter through to pricing. The current point in the cycle is no
different as the lower vacancy rate experienced through 2017 hasnÕt had a pronounced impact on base
rental growth yet. Data out of the listed sector suggests that industrial escalation rates average 7-8%
which suggests that current rental reversions are on aggregate flat to marginally negative.

The basic rental growth of 6.7% recorded for the 12 months ended December hasnÕt translated into an
equal quantum of capital growth which suggests that valuers are still taking a cautious view on the sectorÕs
near term earnings

The current vacancy level and rental growth suggests that the industrial market is recovering well and
again nearing excess demand. The sectorÕs aggregate vacancy rate is hovering close to its long term
average while the above-inflation base rental growth suggests that the excess market supply has seemingly
all been mopped up.

South African manufacturing production posted its highest year-on-year growth of 2.6% in December
2017. While the latest manufacturing growth figure is encouraging, the future growth potential of the sector
also depends on sustained improvements in efficiency measures like capacity utilisation and unit labour
costs. Building plans passed for industrial property declined by 1.5% in 2017 after a year-on-year growth
of 30.6% in 2016. While an increasing number of plans are being passed relative to 2014 & 2015, supply
remains well below the peak levels of 2007/Õ08 and is the driving factor behind the low vacancy rate and
above inflation rental growth in selected segments and geographies.

With the exception of High Tech industrial property, all other segments saw vacancy rates improve during
the 12 months ended December 2017. High-tech industrial vacancies increased by 40bps off a lower
base relative to other segments. High tech industrial property still has the lowest vacancy rate of the
industrial segments at 1.8%. High tech industrial segment still seems to be in a sweet spot where demand
is seemingly quite strong and supply is hampered by a shortage of industrial land and electricity/zoning
difficulties.

Analysing industrial property by box size reveals that there is currently more space available in mid-sized
units. Small industrial units (0-2.5k sqm) saw an improvement in vacancy rate Ð ending 2017 at 3.2% off
4.2% at the end of 2016. The larger industrial size brackets saw vacancy rates improve during 2017

While the aggregate industrial vacancy rate remains low in historical terms at 3.3% there is significant
variance between nodes.ÊSome nodes currently offer virtually zero available space & in most cases, these
nodes are also seeing improvements in rental growth momentum.

                           T: (011) 883 0679 F: (011) 883 0684
                           Email: marketingmanager@sapoa.org.za                                          02
                           Web: www.sapoa.org.za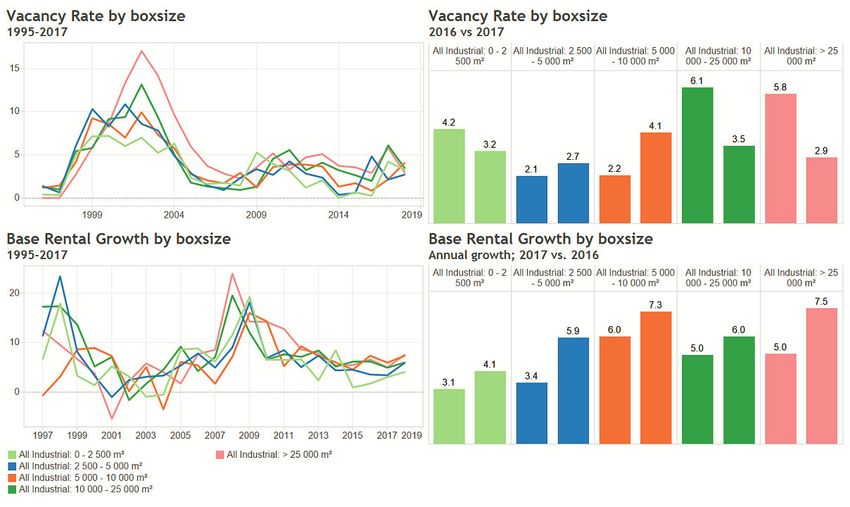
Results for the            APRIL
12 months ended
December 2017              2018

NATIONAL INDUSTRIAL VACANCY
& RENTAL GROWTH TREND
As at December 2017, the national industrial vacancy rate as recorded by IPD was 3.3%. While this is
down from a revised 5.3% at December 2016, it is 100bps up from December 2015. Historic IPD data
going back to 1995 suggests that rental growth has lagged shifts in vacancy rate as excess supply or
demand typically takes a period of time to filter through to pricing. The current point in the cycle is no
different as the lower vacancy rate experienced through 2017 hasnÕt had a pronounced impact on base
rental growth yet. Data out of the listed sector suggests that industrial escalation rates average 7-8%
which suggests that current rental reversions are on aggregate flat to marginally negative.

The basic rental growth of 6.7% recorded for the 12 months ended December hasnÕt translated into an
equal quantum of capital growth which suggests that valuers are still taking a cautious view on the sectorÕs
near term earnings. Meanwhile, a net income growth of 4.6% was recorded for the industrial sector in
2017 suggesting that operating costs grew faster than rental income. Industrial sector capital growth for
2017 was recorded at 2.8% which means that the so-called income residual factor (or valuer sentiment)
detracted -5.9% from capital growth bearing in mind that yield compression also added +2.0% to capital
growth on the back of a 20bp strengthening in the base rental yield.

The current vacancy level and rental growth suggests that the industrial market is recovering well and
again nearing excess demand. The sectorÕs aggregate vacancy rate is hovering close to its long term
average while the above-inflation base rental growth suggests that the excess market supply has seemingly
all been mopped up.

                            T: (011) 883 0679 F: (011) 883 0684
                            Email: marketingmanager@sapoa.org.za                                          03
                            Web: www.sapoa.org.za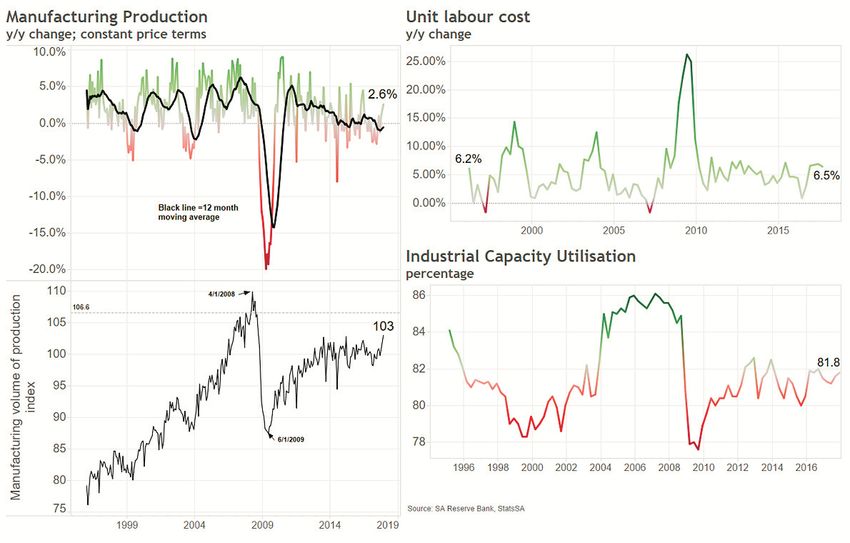
Results for the           APRIL
12 months ended
December 2017             2018

ECONOMIC DRIVERS OF THE
INDUSTRIAL SECTOR
South African manufacturing production posted its highest year-on-year growth of 2.6% in December
2017. On an indexed basis, the latest uptick in growth puts manufacturing volumes back at 2008 levels.
While the latest manufacturing growth figure is encouraging, the future growth potential of the sector also
depends on sustained improvements in efficiency measures like capacity utilisation and unit labour costs.
If these measures do not improve it is likely that the aggregate industrial vacancy rate will continue to
hover between 3 & 5%.

The industrial sectorÕs capacity utilisation percentage ended 2017 at 81.8%. While this signals an
improvement since 2014, a level of at least 84-85% is needed to catalyse expansion in the sector as was
the case in the period 2003-2007.

Unit labour costs increased to 6.5% year on year to September 2017 Ð down from 6.9% in the quarter
before. This suggestsÊ that the cost of labour is increasing at a faster rate than manufacturing output
which could have negative consequences for industrial property demand as firms seek to optimise current
operations before looking to expand.

                           T: (011) 883 0679 F: (011) 883 0684
                           Email: marketingmanager@sapoa.org.za                                          04
                           Web: www.sapoa.org.za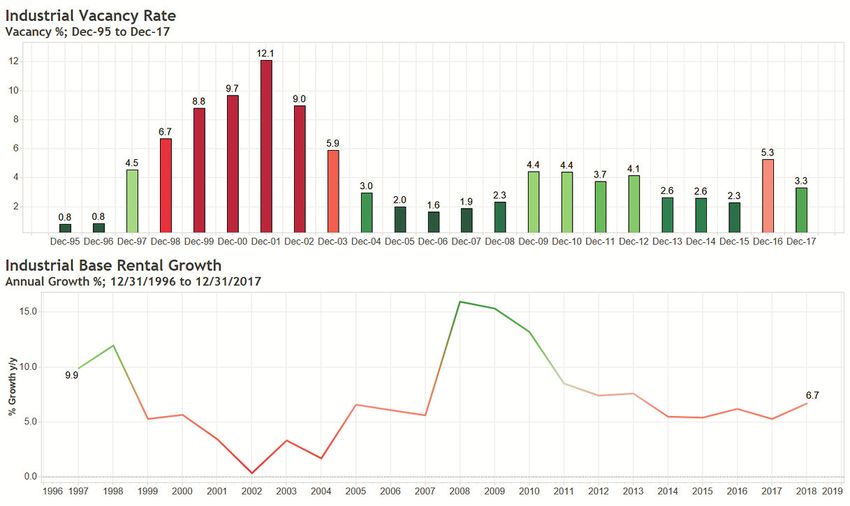
Results for the           APRIL
12 months ended
December 2017             2018

ECONOMIC DRIVERS OF THE
INDUSTRIAL SECTOR
Building plans passed for industrial property declined by 1.5% in 2017 after a year-on-year growth of
30.6% in 2016. While an increasing number of plans are being passed relative to 2014 & 2015, supply
remains well below the peak levels of 2007/Õ08 and is the driving factor behind the low vacancy rate and
above inflation rental growth in selected segments and geographies.

On an annual basis, building plans passed is getting closer to peak 2009 levels which may weigh on rental
growth Ð especially if occupiers of new space are leaving behind their old space vacant. Given flat
manufacturing production growth and sub-optimal capacity utilisation it is likely to be more challenging
for landlords to fill excess space.

Building plan completions have remained fairly stable since 2012. Bear in mind, industrial buildings
currently scheduled for completion could have had their plans passed at least a year ago, meaning that
the current decline in plans passed could possibly only reflect in completions a year from now. Apart from
a general contraction in demand for new, purpose built industrial space it could also mean delays in
speculative, tenant driven schemes.

                            T: (011) 883 0679 F: (011) 883 0684
                            Email: marketingmanager@sapoa.org.za                                        05
                            Web: www.sapoa.org.za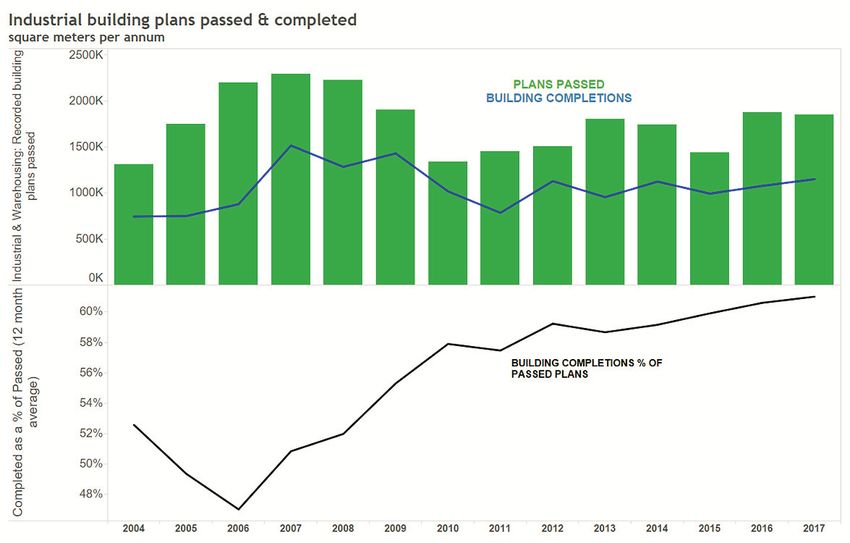
Results for the APRIL
12 months ended
December 2017 2018
PERFORMANCE BY INDUSTRIAL SEGMENT
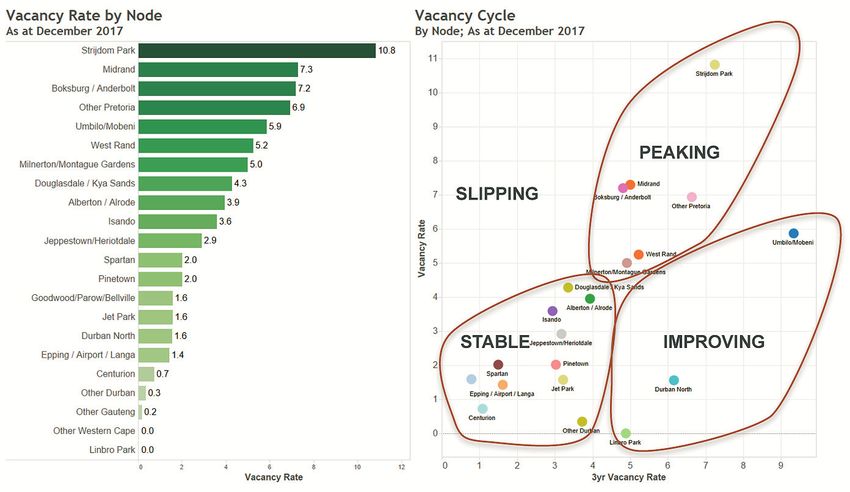
With the exception of High Tech industrial property, all other segments saw vacancy rates improve during
the 12 months ended December 2017. High-tech industrial vacancies increased by 40bps off a lower base
relative to other segments. High tech industrial property still has the lowest vacancy rate of the industrial
segments at 1.8%. High tech industrial segment still seems to be in a sweet spot where demand is
seemingly quite strong and supply is hampered by a shortage of industrial land and electricity/zoning
difficulties.
Warehousing and light manufacturing property both saw vacancy rates improve by around 1.5% during
the year ended December 2017. Standard units/workshops saw the largest improvement in occupancy
with its vacancy rate improving from 8.0% to end the year at 3.7%.
The vacancy rate of light manufacturing property remains the highest among the industrial segments
suggesting that the weak manufacturing data & currency depreciation of the past year or two is now filtering
through to fundamentals underlying manufacturing related property.
T: (011) 883 0679 F: (011) 883 0684
Email: marketingmanager@sapoa.org.za 06
Web: www.sapoa.org.zaResults for the APRIL
12 months ended
December 2017 2018
PERFORMANCE BY BOX SIZE
Analysing industrial property by box size reveals that there is currently more space available in mid-sized
units with industrial property sized between 2.5k sqm and 10k sqm seeing an increase in vacancy rate
relative to the year before. Industrial units sized between 5k-10k sqm ended the year with a vacancy rate
of 4.1% - the highest among the size segments.
Small industrial units (0-2.5k sqm) saw an improvement in vacancy rate Ð ending 2017 at 3.2% off 4.2%
at the end of 2016. The year ended December 2016 saw some pressure on the lower end of the size
spectrum as the difficult macroeconomic environment seemingly weighed heavier on smaller operations.
The larger industrial size brackets saw vacancy rates improve during 2017. Industrial units of 10-25k sqm
saw its vacancy rate improve to 3.5% off 6.1% while units large than 25k sqm saw an improvement from
5.8% to 2.9%. Notwithstanding the latest improvement in the occupancy rate of larger units, the currently
vacancy rates are well above 2014 levels which suggests that occupiers may currently be downsizing
their space requirements or splitting up different industrial operations in order to increase capacity utilisation.
This trend may continue since overall industrial capacity utilisation is currently at 81.8% - well off the highs
of 2006/07.
T: (011) 883 0679 F: (011) 883 0684
Email: marketingmanager@sapoa.org.za 07
Web: www.sapoa.org.zaResults for the APRIL
12 months ended
December 2017 2018
NODAL PERFORMANCE
SIGNIFICANT VARIANCE ON NODAL LEVEL
While the aggregate industrial vacancy rate remains low in historical terms at 3.3% there is significant
variance between nodes Ð illustrated below.Ê Some nodes currently offer virtually zero available space
& in most cases, these nodes are also seeing improvements in rental growth momentum. As at December
2017, 12 of 20 industrial nodes have vacancy rates below 4%.
Meanwhile there are others with vacancy rates in excess of 5%. Rental growth in these nodes are mostly
sluggish and in some cases slipping to levels below its 3 year average. Strijdom Park currently has the
highest vacancy rates at around 10% which ahs seen its base rental growth slip down to below 1% from
its 3-year annualised rental growth of 3.6%.
Active asset management with a focus on nodal selection as well as segmental and geographicÊ
diversification remain key during this phase of the property cycle - where it seems tenants are increasingly
adopting a wait-and-see approach.
The graphic below emphasises this point as the major industrial nodes are virtually evenly split in their
current position in vacancy cycle. Almost as many nodes are either seeing vacancy rates Improving,
Slipping, Bottoming out or becoming sluggish or sticky relative to 3 year average.
T: (011) 883 0679 F: (011) 883 0684
Email: marketingmanager@sapoa.org.za 08
Web: www.sapoa.org.zaResults for the APRIL
12 months ended
December 2017 2018
NODAL PERFORMANCE
Analysing basic rental growth on a nodal level reveals a similar pattern to that of vacancy rates. Some
nodes are seeing very strong growth while other nodes are seeing rentals come under pressure Ð
either as a result of vacancy rates increasing or negative rental reversions in the interests of retaining
existing tenants.
Categorising nodes into four quadrants according to their 1 year and 3 year annualised rental growth
rates reveal that rental growth in the majority of nodes can be said to be currently peaking.
Midrand and Bellville/Parow count among the nodes where the one year rental growth figure to
December has slipped well below the three year annualised level which suggests
JohannesburgÕs Linbro Park node, meanwhile, is the only area that saw a pronounced rebound in
rental growth momentum over the past 12 monthsÊ as their one year rental growth surpassed their
low three year rental growth rates.
There has been a pronounced increase in the amount of nodes where rental growth may be peaking
given that the latest year on year rental growth exceeds the three year annualised rate.
Given the fact that rental growth usually lags changes in vacancy rate by at least a year it should
follow that many of the nodes currently in the ÔSluggishÕ quadrant will see rental growth improve over
the next 6-12 months.
T: (011) 883 0679 F: (011) 883 0684
Email: marketingmanager@sapoa.org.za 09
Web: www.sapoa.org.zaResults for the APRIL
12 months ended
December 2017 2018
NODAL PERFORMANCE
Given where the industrial sector finds itself in the property cycle and the variance between individual
nodes with regards to vacancy levels itÕs worth looking at a slightly longer time period.
The map below shows 5 year average vacancy levels for individual industrial nodes in the Johannesburg,
Cape Town and eThekwini metro area. Industrial vacancy rates in the coastal markets remain low overall
with some exceptions. The Umbilo/Mobeni node in KZN has seen occupancy levels come under some
pressure in the last few years.
While 5-year occupancy levels in institutionally owned industrial property in the Western Cape and KZN
is low across the boardÐ this is not the case in Gauteng where a wide variance is observed in the underlying
nodes. This suggests that occupiers of industrial property are preferring certain nodes above others. This
could be for a variety of reasons, including access to main arterial routes, proximity to the airport and
possibly the location of eToll routes in Gauteng.
The peripheral Strijdom Park node has seen its overall vacancy rate increase as some large occupiers
have seemingly chosen not to renew leases. The major nodes around the airport meanwhile maintains
their low vacancy rates highlighting the value of proximity to ports in an environment where transport
costs are increasing faster than inflation.
T: (011) 883 0679 F: (011) 883 0684
Email: marketingmanager@sapoa.org.za 10
Web: www.sapoa.org.zaResults for the APRIL
12 months ended
December 2017 2018
SAMPLE COMPOSITION
AS AT DECEMBER 2017
T: (011) 883 0679 F: (011) 883 0684
Email: marketingmanager@sapoa.org.za 11
Web: www.sapoa.org.zaResults for the APRIL
12 months ended
December 2017 2018
ABOUT MSCI
For more than 40 years, MSCIÕs research-based indexes and analytics have helped the worldÕs
leading investors build and manage better portfolios.Ê
Clients rely on our offerings for deeper insights into the drivers of performance and risk in their
portfolios, broad asset class coverage and innovative research.
Our line of products and services includes indexes, analytical models, data, real estate
benchmarks and ESG research.Ê
MSCI serves 98 of the top 100 largest money managers, according to the most
recent P&I ranking.
For more information, visit us at www.msci.com
Report compiled by:
T: (011) 883 0679 F: (011) 883 0684
Email: marketingmanager@sapoa.org.za 12
Web: www.sapoa.org.zaResults for the APRIL
12 months ended
December 2017 2018
NOTICE AND DISCLAIMER
This document and all of the information contained in it, including without limitation all text, data, graphs, charts (collectively, the
ÒInformationÓ) is the property of MSCI Inc. or its subsidiaries (collectively, ÒMSCIÓ), or MSCIÕs licensors, direct or indirect suppliers or any
third party involved in making or compiling any Information (collectively, with MSCI, the ÒInformation ProvidersÓ) and is provided for
informational purposes only.Ê The Information may not be modified, reverse-engineered, reproduced or redisseminated in whole or in
part without prior written permission from MSCI.
The Information may not be used to create derivative works or to verify or correct other data or information.ÊÊ For example (but without
limitation), the Information may not be used to create indexes, databases, risk models, analytics, software, or in connection with the
issuing, offering, sponsoring, managing or marketing of any securities, portfolios, financial products or other investment vehicles utilizing
or based on, linked to, tracking or otherwise derived from the Information or any other MSCI data, information, products or services.Ê
The user of the Information assumes the entire risk of any use it may make or permit to be made of the Information.Ê NONE OF THE
INFORMATION PROVIDERS MAKES ANY EXPRESS OR IMPLIED WARRANTIES OR REPRESENTATIONS WITH RESPECT TO
THE INFORMATION (OR THE RESULTS TO BE OBTAINED BY THE USE THEREOF), AND TO THE MAXIMUM EXTENT PERMITTED
BY APPLICABLE LAW, EACH INFORMATION PROVIDER EXPRESSLY DISCLAIMS ALL IMPLIED WARRANTIES (INCLUDING,
WITHOUT LIMITATION, ANY IMPLIED WARRANTIES OF ORIGINALITY, ACCURACY, TIMELINESS, NON-INFRINGEMENT,
COMPLETENESS, MERCHANTABILITY AND FITNESS FOR A PARTICULAR PURPOSE) WITH RESPECT TO ANY OF THE
INFORMATION.
Without limiting any of the foregoing and to the maximum extent permitted by applicable law, in no event shall any Information Provider
have any liability regarding any of the Information for any direct, indirect, special, punitive, consequential (including lost profits) or any
other damages even if notified of the possibility of such damages. The foregoing shall not exclude or limit any liability that may not by
applicable law be excluded or limited, including without limitation (as applicable), any liability for death or personal injury to the extent
that such injury results from the negligence or willful default of itself, its servants, agents or sub-contractors.Ê
Information containing any historical information, data or analysis should not be taken as an indication or guarantee of any future
performance, analysis, forecast or prediction.Ê Past performance does not guarantee future results.Ê
The Information should not be relied on and is not a substitute for the skill, judgment and experience of the user, its management,
employees, advisors and/or clients when making investment and other business decisions.Ê All Information is impersonal and not tailored
to the needs of any person, entity or group of persons.
None of the Information constitutes an offer to sell (or a solicitation of an offer to buy), any security, financial product or other investment
vehicle or any trading strategy.
It is not possible to invest directly in an index.Ê Exposure to an asset class or trading strategy or other category represented by an index
is only available through third party investable instruments (if any) based on that index.ÊÊ MSCI does not issue, sponsor, endorse, market,
offer, review or otherwise express any opinion regarding any fund, ETF, derivative or other security, investment, financial product or
trading strategy that is based on, linked to or seeks to provide an investment return related to the performance of any MSCI index
(collectively, ÒIndex Linked InvestmentsÓ). MSCI makes no assurance that any Index Linked Investments will accurately track index
performance or provide positive investment returns.Ê MSCI Inc. is not an investment adviser or fiduciary and MSCI makes no representation
regarding the advisability of investing in any Index Linked Investments.
Index returns do not represent the results of actual trading of investible assets/securities. MSCI maintains and calculates indexes, but
does not manage actual assets. Index returns do not reflect payment of any sales charges or fees an investor may pay to purchase the
securities underlying the index or Index Linked Investments. The imposition of these fees and charges would cause the performance of
an Index Linked Investment to be different than the MSCI index performance.
The Information may contain back tested data.Ê Back-tested performance is not actual performance, but is hypothetical.Ê There are
frequently material differences between back tested performance results and actual results subsequently achieved by any investment
strategy.Ê
Constituents of MSCI equity indexes are listed companies, which are included in or excluded from the indexes according to the application
of the relevant index methodologies. Accordingly, constituents in MSCI equity indexes may include MSCI Inc., clients of MSCI or suppliers
to MSCI.Ê Inclusion of a security within an MSCI index is not a recommendation by MSCI to buy, sell, or hold such security, nor is it
considered to be investment advice.
Data and information produced by various affiliates of MSCI Inc., including MSCI ESG Research Inc. and Barra LLC, may be used in
calculating certain MSCI indexes.Ê More information can be found in the relevant index methodologies on www.msci.com.
MSCI receives compensation in connection with licensing its indexes to third parties.Ê MSCI Inc.Õs revenue includes fees based on assets
in Index Linked Investments. Information can be found in MSCI Inc.Õs company filings on the Investor Relations section of www.msci.com.
MSCI ESG Research Inc. is a Registered Investment Adviser under the Investment Advisers Act of 1940 and a subsidiary of MSCI Inc.Ê
Except with respect to any applicable products or services from MSCI ESG Research, neither MSCI nor any of its products or services
recommends, endorses, approves or otherwise expresses any opinion regarding any issuer, securities, financial products or instruments
or trading strategies and MSCIÕs products or services are not intended to constitute investment advice or a recommendation to make
(or refrain from making) any kind of investment decision and may not be relied on as such. Issuers mentioned or included in any MSCI
ESG Research materials may include MSCI Inc., clients of MSCI or suppliers to MSCI, and may also purchase research or other products
or services from MSCI ESG Research.Ê MSCI ESG Research materials, including materials utilized in any MSCI ESG Indexes or other
products, have not been submitted to, nor received approval from, the United States Securities and Exchange Commission or any other
regulatory body.
Any use of or access to products, services or information of MSCI requires a license from MSCI.Ê MSCI, Barra, RiskMetrics, IPD, FEA,
InvestorForce, and other MSCI brands and product names are the trademarks, service marks, or registered trademarks of MSCI or its
subsidiaries in the United States and other jurisdictions.Ê The Global Industry Classification Standard (GICS) was developed by and is
the exclusive property of MSCI and Standard & PoorÕs.Ê ÒGlobal Industry Classification Standard (GICS)Ó is a service mark of MSCI and
Standard & PoorÕs.
T: (011) 883 0679 F: (011) 883 0684
Email: marketingmanager@sapoa.org.za 13
Web: www.sapoa.org.zaSAPOA - South African Property Owners Association Tel: (011) 883 0679 Fax: (011) 883 0684 Email: marketingmanager@sapoa.org.za Web: www.sapoa.org.za Physical: Paddock View, Hunt's End Office Park, 36 Wierda Road West, Wierda Valley, Sandton Postal: P O Box 78544, Sandton 2146 Report compiled by:
You can also read