Results Presentation Half Year Ended 31 March 2016 Thursday 26 May 2016 - DMGT
←
→
Page content transcription
If your browser does not render page correctly, please read the page content below

Results Presentation
Half Year Ended 31 March 2016

Thursday 26 May 2016

                                © 2016 DMGT |   1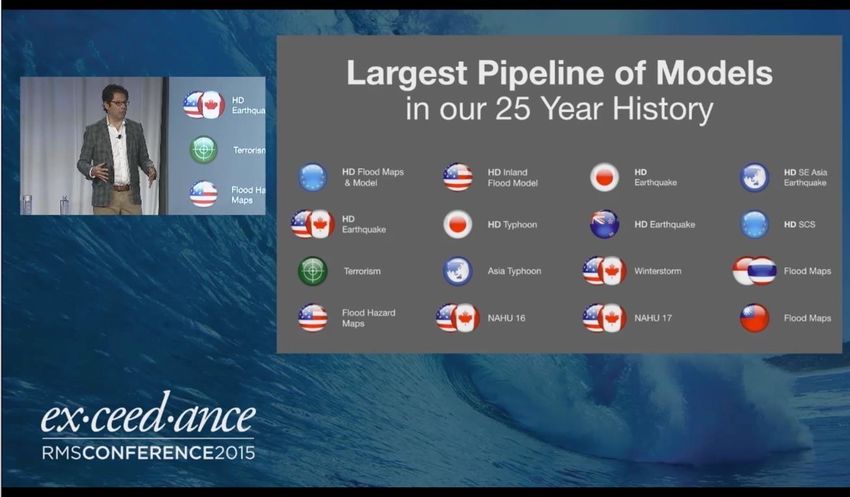
Agenda
         Highlights
  1
  1      Martin Morgan, Chief Executive

         Financial Performance
   2     Stephen Daintith, Finance Director

         Business Update
   3     Martin Morgan, Chief Executive

         Q&A
   4
                                              © 2016 DMGT |   2
Highlights
1   Martin Morgan, Chief Executive

                                 © 2016 DMGT |   3
Challenging first half – weak print advertising
•   Resilient Group underlying revenues
•   Underlying operating profit down 12%, operating margin of 15%
•   Adjusted profit before tax down 11%, EPS down 11%
•   Net debt:EBITDA ratio of 2.0x
•   Interim dividend of 6.7p, up 3%
•   Active portfolio management
•   Outlook for Full Year unchanged, except for dmg media’s
    operating margin
•   New CEO, Paul Zwillenberg, appointed from 1 June 2016
                                                        © 2016 DMGT |   4
Financial Performance
2   Stephen Daintith, Finance Director

                                   © 2016 DMGT |   5
Financial Summary
Adjusted numbers
    £ million                         HY 2016            HY 2015      Change        Underlying
    Revenue                                950              922            +3%                (1%)
    Operating profit                       138              150           (8%)              (12%)
    Profit before tax                      129              146          (11%)
    Operating margin                       15%              16%
    Earnings per share                  27.9 p            31.4 p         (11%)
    Dividend per share                    6.7 p            6.5 p           +3%
•    Revenue dynamics: growth in B2B (+1%),
                                                     •    Operating profit down 12% underlying
     resilient dmg media (-3%)
•    HY16 factors: Local World disposal; Gastech
                                                     •    Adjusted profit before tax down 11%
     included; FX benefit from stronger US$; print   •    EPS down 11%, Dividend up 3%
     advertising declines; Euromoney challenges

                                                                                   © 2016 DMGT |   6
B2B & Consumer diversity

              HY 2016 Revenues                                       HY 2016 Profits *

                         Consumer                                         Consumer
                            38%                                               24%
                    B2B                                                 B2B
                      62%                                               76%
         Underlying growth rates                                    Underlying growth rates
         B2B +1%, Consumer –3%                                     B2B -3%, Consumer –33%
* Profits include Corporate costs, allocated on a revenue basis.
                                                                                         © 2016 DMGT |   7
Geographical diversity
               HY 2016 Revenues                       HY 2016 Profits

                                  48%                                46%
                                  UK                                 UK

                                  31%                                33%
                                  North America                      North America

                                  21%                                21%
                                  Rest of World                      Rest of World

       Underlying growth rates                      Underlying growth rates
     UK –6%, North America +7%,                   UK –19%, North America –8%,
          Rest of World +0%                            Rest of World -1%

Revenues by destination and profits by source.
                                                                          © 2016 DMGT |   8
Diverse revenue streams
Transactions & Other Print Advertising
18% 14%
7%
Digital Advertising
Events, Conferences
& Training
14%
16% Circulation
Subscriptions 31%
Percentages represent share of revenues in HY 2016
Arrows represent underlying revenue trajectory, comparing HY 2016 to HY 2015 © 2016 DMGT | 9Digital focus
Group HY 2016 revenues Group - excluding events
48% 56%
Digital
Digital
44%
38% Non-digital
Non-digital
B2B only - excluding events
14%
Events 88%
Digital
12%
Non-digital
All figures based on HY 2016 revenues.
© 2016 DMGT | 10B2B
© 2016 DMGT | 11Performance in line with expectations
£ million HY 2016 HY 2015 Change Underlying
Revenue 96 91 +6% +1%
Operating Profit 19 13 +51% +47%
Operating Margin 20% 14%
• Revenue growth despite impact of Outlook: Full Year 2016
client consolidation
• Low-single digit underlying revenue
• Strong product development continued growth
• Margin benefit from reduced costs, • RMS(one) costs in H2 (sales & support,
despite £6m reduction in capitalisation amortisation, ↓capitalisation)
• RMS(one) on track and roll-out in
• Full year margin in line with FY 2015
(c.14%)
progress
© 2016 DMGT | 12© 2016 DMGT | 13
Continued growth
£ million                       HY 2016          HY 2015       Change Underlying
Revenue                            230              201          +14%       +6%
Operating Profit                     25               27          (6%)      +1%
Operating Margin                    11%              13%
•   Underlying revenue growth across the
    businesses: Property +5%, Education +1%
    and Energy +19%                                Outlook: Full Year 2016
                                                   • Underlying revenue growth of c.10%
•   Margin adversely impacted by ongoing
    investment and bolt-on acquisitions, as        •   Continued ongoing investment to
    expected                                           drive long-term growth prospects

•   Bolt-on acquisitions: ETSOS (Property) and     •   Operating margin in mid-teens
    PAR Framework (Education)

                                                                             © 2016 DMGT | 14
Continued revenue growth
£ million HY 2016 HY 2015 Change Underlying
Property - European 89 79 +12% +3%
Property - US 58 51 +14% +7%
Property 146 130 +12% +5%
Education 48 46 +5% +1%
Energy 35 24 +47% +19%
dmg information 230 201 +14% +6%
© 2016 DMGT | 15Continued underlying growth
£ million HY 2016 HY 2015 Change Underlying
Revenue 72 58 +24% +5%
Operating Profit 25 17 +43% (2%)
Operating Margin 35% 30%
• Continued underlying growth
• Gastech benefit to reported figures Outlook: Full Year 2016
(Oct’15 & Mar’14) • Mid-single digit underlying and reported
• Continued growth for ADIPEC and Big 5 revenue growth
• Underlying profit decline; Gastech • Challenging conditions facing Canadian
location and investment in attendance energy-related events (GPS)
• Acquisition of Exhibition Management • Operating margin of c.25%
Services
© 2016 DMGT | 16Challenging markets
£ million HY 2016 HY 2015 Change Underlying
Revenue 194 198 (2%) (6%)
Operating Profit 47 53 (12%) (15%)
Operating Margin 24% 27%
• Underlying revenue decline of –6%; Outlook: Full Year 2016
events, training and advertising
• Reduced margin:high flow through to
• Challenging market conditions continue
profits, benefit in FY15 from CAP • Strategy being implemented and early signs
encouraging
• New strategy presented in March 2016
• Disposal of energy publishing
• Second half profit expected to be similar to
second half of FY 2015
businesses
© 2016 DMGT | 17© 2016 DMGT | 18
Weak print advertising market
£ million                                 HY 2016               HY 2015               Change       Underlying
Revenue                                          358                    374                 (4%)            (3%)
Operating Profit                                   39                    57                (30%)          (29%)
Operating Margin                                 11%                    15%
•   Underlying revenue decline of –3%;                              FY 2016 Outlook
    weak print advertising, digital growth,
    resilient circulation volumes
                                                                    •   Stable underlying revenues (-2% to +2%):
                                                                        digital growth, print decline, benefit from
•   Cover price increase: Daily Mail Mon-Fri                            cover price
    60p → 65p
                                                                    •   Decline in reported revenues (Wowcher)
•   Profit and margin decline; reduction in
                                                                    •   53 week year
    print revenues and continued
    investment in digital assets                                    •   Operating margin of around 10%,
                                                                        impacted by print advertising
•   Wowcher disposal; MailOnline Australia
    acquisition
                                                                                                   © 2016 DMGT | 19
For the 8 weeks to 22 May 2016, underlying revenues: advertising –4% and circulation –2%
Revenue
£ million HY 2016 HY 2015 Change Underlying
Circulation 153 157 (3%) (3%)
Advertising print 113 131 (13%) (13%)
(4%)
Advertising digital 57 56 +2% +23%
Other 35 30 +16% +13%
Revenue 358 374 (4%) (3%)
• Cover price increase (Feb’16) helps second half
Reported digital advertising growth adversely impacted by disposal of Wowcher.
‘Other’ revenues primarily relate to low margin newsprint resale activities which are excluded from underlying revenues.
© 2016 DMGT | 20£ million HY 2016 HY 2015 Change Underlying
Daily Mail / The Mail on Sunday 242 260 (7%) (7%)
circulation 153 157 (3%) (3%)
advertising 80 95 (16%) (16%)
other 10 8 +16% +16%
MailOnline 44 36 +24% +20%
Mail Businesses 286 296 (3%) (3%)
Metro, 7 Days 36 39 (7%) (7%)
Other - continuing 29 22 +55%
351 356 (1%) (3%)
Wowcher 7 15 (55%)
Evenbase - 3 (100%)
Total 358 374 (4%) (3%)
MailOnline includes Metro.co.uk website revenues but excludes Elite Daily.
‘Other – continuing’ includes newsprint resale activities and Elite Daily. © 2016 DMGT | 21Revenue by business
£ million HY 2016 HY 2015 Change Underlying
B2B
Risk Management Solutions 96 91 +6% +1%
dmg information 230 201 +14% +6%
dmg events 72 58 +24% +5%
Euromoney 194 198 (2%) (6%)
592 548 +8% +1%
Consumer
dmg media 358 374 (4%) (3%)
Total Revenue 950 922 +3% (1%)
• Favourable FX impact on HY 2016 reported revenues of c.£18m (Average rate $1.48 vs. $1.55 HY 2015)
© 2016 DMGT | 22Operating profit by business
£ million HY 2016 HY 2015 Change Underlying
B2B
Risk Management Solutions 19 13 +51% +47%
dmg information 25 27 (6%) +1%
dmg events 25 17 +43% (2%)
Euromoney 47 53 (12%) (15%)
116 110 +6% (2%)
Consumer
dmg media 39 57 (30%) (29%)
Corporate costs (18) (17) (6%) (6%)
Total operating profit 138 150 (8%) (12%)
• Favourable FX impact on HY 2016 reported operating profits of c.£4m (Average rate $1.48 vs. $1.55 HY 2015)
Note: B2B and Consumer operating profits are stated before allocating Corporate costs. Including Corporate
costs, the underlying growth rates for B2B and Consumer were –3% and –33%. © 2016 DMGT | 23Joint Ventures & Associates
£ million HY 2016 HY 2015
Zoopla Property Group 11 7
Local World - 8
Total JV's & Associates* 11 14
• Zoopla: Outlook: Full Year 2016
• Strong performance following uSwitch
acquisition: Revenues +130%, • Zoopla seasonality (uSwitch)
Adjusted PAT +83%, Adjusted EPS +82%
• Acquisition of Property Software Group Apr’16 • Full Year guidance: £15-20m
• Disposal of Local World
* Total includes other JV’s and Associates, notably Dealogic and dmg information investments
© 2016 DMGT | 24Net finance costs
£ million HY 2016 HY 2015
Net interest payable 20 19
Items excluded from adjusted results:
Premium on bond redemption - 40
IAS19(R) finance costs 2 4
Outlook: Full Year 2016
• Increased share of associates’ interest • Net finance costs c.£40m
payable: Zoopla’s acquisition of uSwitch
© 2016 DMGT | 25Adjusted results
£ million HY 2016 HY 2015 Change
Adjusted operating profit 138 150 (8%)
Joint ventures and associates 11 14
Net finance costs (20) (19)
Adjusted profit before tax 129 146 (11%)
Taxation (19) (21)
Minorities (12) (11)
Adjusted earnings 99 114 (14%)
Adjusted EPS 27.9 p 31.4 p (11%)
Adjusted tax rate 14.8% 14.1%
© 2016 DMGT | 26Exceptional items and amortisation
£ million HY 2016 HY 2015
1
Reorganisation, redundancy and consultancy (6) (11)
Supplier in voluntary administration 1 (5) -
1
Earn-out / deferred consideration charge (1) (1)
Accelerated depreciation and impairment of plant (0) (2)
Exceptional operating costs 2 (12) (14)
Amortisation of intangible assets (23) (23)
Impairment of intangible assets & goodwill (13) (8)
Profit on sale of assets 110 128
Other non-operating items 6 (7)
Pre-tax exceptionals 68 76
• Redundancy, consultancy and supplier administration costs relate to dmg media
• Profit on sale of assets includes Local World and Wowcher transaction
• Outlook: cash exceptional items of c.£15m for full year, primarily dmg media
¹ Cash items
² Exceptional operating costs, impairment of internally generated and acquired computer software, © 2016 DMGT | 27
property, plant and equipment and investment property: continuing & discontinued operationsNet debt movement
£m Cash conversion: 35% Net debt: EBITDA 2.0x
900
800 6
8
60 92
700 16 19
48 33
16
600
500 702 719
400
300
Opening Operating Taxation Pensions Interest Dividends RMS(one) Share buy M&A Debt Closing net
net debt cash flow capex back revaluation debt
• Operating cash flow is stated after capex of £35m and exceptional operating items of £9m
• Cash conversion represents operating cash flow as a percentage of operating profit
• M&A includes £112m of disposals (Local World, Wowcher, Dealogic) and £20m of acquisitions (e.g. ETSOS, PAR Framework)
© 2016 DMGT | 28Net debt
Net debt:EBITDA ratio of 2.0x – targeting ≤ 2.0x
Half year net debt:
£m EBITDA 2.0x
1,200
1,000
£719m
800
3.5x
600 2.9x
2.7x 3.0x 2.8x
2.4x
400 2.3x 2.2x 2.0x 1.9x 1.8x
2.3x 1.8x 2.0x
2.0x 1.6x 1.5x
1.7x
200
0
Sep'07 Mar'08 Sep'08 Mar'09 Sep'09 Mar'10 Sep'10 Mar'11 Sep'11 Mar'12 Sep'12 Mar'13 Sep'13 Mar'14 Sep'14 Mar'15 Sep'15 Mar'16
© 2016 DMGT | 29H1 2016 Adjusted PBT
HY 2015 to HY 2016 Bridge
£m Gastech
160
155 8 (6)
150
(2)
7
145
(17)
140
135 (1)
146
130 (8) (1)
4
125 129
120
HY 2015 RMS dmg dmg events Euromoney dmg media Central Costs Local World Zoopla & Interest HY 2016
information Disposal Other
associates
• The HY 2016 adjusted PBT would have been c.£4m lower at HY 2015 FX rates
(Average rate of $1.48 vs. $1.55 in HY 2015)
© 2016 DMGT | 30H2 2016 Financial Considerations
• Continuing challenging market conditions facing print advertising,
Euromoney and energy events
• Significant organic investment: RMS(one), MailOnline, dmgi
• dmgi: impact of early-stage acquisitions and organic investment in
long-term growth
• Daily Mail cover price increase: Mon-Fri 60p to 65p (Feb’16)
• Disposal of Local World and Wowcher
• US$ / £ FX rate (HY 2016 $1.48 average, FY 2015 $1.54 average)
© 2016 DMGT | 31Revenue and profit outlook
FY 2015 Full Year Outlook FY 2016
Underlying revenue
Revenue Margin Margin
growth
B2B
Risk Management Solutions £187 m 14% Low-single digit % Stable
dmg information £430 m 17% Around 10% Mid-teens %
dmg events £95 m 21% Mid-single digit % ¹ Around 25%
Euromoney £403 m 26% See Euromoney statement
Consumer
dmg media £731 m 13% Stable ² Around 10%
• Corporate costs c.£40m
• JV’s & Associates (pre tax) £15-20m
• Net finance costs c.£40m
¹ Due to occurrence of Gastech and the disposal of the digital marketing events, both the reported and underlying revenue growth
rates are expected to be in the mid-single digits. © 2016 DMGT | 32
² Stable revenues for dmg media means -2% to +2%.Business Update
3 Martin Morgan, Chief Executive
© 2016 DMGT | 33Investing for growth – consistent strategy
Our strategic priorities
Fostering innovation to deliver organic growth
Maintaining rigorous and active portfolio management
Driving international growth
Using technology to enable growth
Attracting and developing entrepreneurial talent
© 2016 DMGT | 34Execution priorities for 2016
• Continued balanced and flexible approach to capital allocation
• RMS: roll-out of HD models and RMS(one)
• dmgi: organic growth supplemented by selected acquisitions
• dmg events: performance of major shows, geo-cloning, organic spin-
offs and acquisitions
• Euromoney: execution of new strategy
• dmg media: grow MailOnline, particularly internationally; extract
benefits from growing newspaper market share
© 2016 DMGT | 35Investment preferences
New
Organic Bolt-on Adjacent sector
© 2016 DMGT | 36Portfolio management in FY 2016 to date
First half FY 2016
Acquisitions £20m Disposals £112m
ETSOS PAR Framework Local World
Exhibition Management Services Daily Mail Australia Wowcher
Second half FY 2016 to date
Acquisitions Disposals
Codean Gulf Publishing
© 2016 DMGT | 37Large pipeline of models
© 2016 DMGT | 38Model and data product development
Cyber European Flood HD
Global Marine New Zealand Earthquake HD
Cargo / v.16
US + Europe Japan Typhoon HD
Flood Maps
© 2016 DMGT | 39Platform and software
RMS(one) products and solutions on track to be released in stages
© 2016 DMGT | 40Continued organic growth enhanced by well performing acquisitions
• Property information
• Trepp: new market segments (e.g. TreppPort & Codean)
• Xceligent: ongoing organic investment in US build-out
• dmgi land & property Europe: product innovation
across the property value chain (e.g. ETSOS)
• Hobsons: benefiting from growing adoption of Naviance
and new services for higher education (e.g. Starfish,
PAR Framework)
• Genscape: gaining scale from entering new segments
(e.g. solar, Locus Energy) and adding analytics
(e.g. Energytics)
© 2016 DMGT | 41• Good performance of market-leading major
events (ADIPEC, Big 5, Gastech)
• Managing oil-related headwinds for energy
shows – benefits of portfolio diversity
Global Petroleum Show, Calgary
• Successful geo-cloning and organic spin-off
strategy (e.g. Gas Indonesia, HVAC R Saudi,
Windows & Doors Dubai)
• Bolt-on acquisitions (e.g. Exhibition
Management Services)
© 2016 DMGT | 42• Difficult market conditions continue in some
sectors
• New strategy firmly in place – early
encouraging signs
• Three pillars of strategy
• Investing around big themes
• Transforming the operating model
• Actively managing the portfolio
• Good long-term growth opportunities
© 2016 DMGT | 43Strategic approach based on business positioning within each quadrant
+
Batten
down the Invest
Structure
hatches
- Cycle
+
Use the
Disinvest time
wisely
-
© 2016 DMGT | 44• Strong market position of Mail brands increasingly important
• Circulation volumes resilient following Daily Mail cover price rise
Daily Mail circulation revenues and volumes: H1 FY’07 to H1 FY’16
100
140
Average daily volume
120 80
Circulation Revenues
[Base H1’07 = 100]
6 months (£M)
100
60
80
60 40
40
20
20
0 0
H1 H2 H1 H2 H1 H2 H1 H2 H1 H2 H1 H2 H1 H2 H1 H2 H1 H2 H1
‘07 ‘07 ‘08 ‘08 ‘09 ‘09 ‘10 ‘10 ‘11 ‘11 ‘12 ‘12 ‘13 ‘13 ‘14 ‘14 ‘15 ‘15 ‘16
© 2016 DMGT | 45• Growing significance of digital advertising for Mail businesses
• Fostering international growth opportunities for MailOnline
• Continued balance of investment and cost efficiencies
MailOnline revenues as a % of Mail businesses’ advertising revenues
36%
33%
27% 27%
22%
19%
15%
13%
8% 9%
5%
H1 FY11 H2 FY11 H1 FY12 H2 FY12 H1 FY13 H2 FY13 H1 FY14 H2 FY14 H1 FY15 H2 FY15 H1 FY16
© 2016 DMGT | 46Well positioned for long-term growth
• Clear priorities for 2016 given challenging market conditions
• First Half results impacted by weak advertising market
• Investing to deliver medium to long-term growth
• Balanced capital allocation strategy
• Financial flexibility to drive shareholder returns
© 2016 DMGT | 474 Questions
© 2016 DMGT | 485 Appendix
© 2016 DMGT | 49Important Notice
Certain statements in this presentation are forward This presentation does not constitute or form part of any
looking statements. By their nature, forward looking offer or invitation to sell, or any solicitation of any offer to
statements involve a number of risks, uncertainties or purchase any shares in the Company, nor shall it or any
assumptions that could cause actual results or events to part of it or the fact of its distribution form the basis of, or
differ materially from those expressed or implied by the be relied on in connection with, any contract or
forward looking statements. These risks, uncertainties or commitment or investment decisions relating thereto,
assumptions could adversely affect the outcome and nor does it constitute a recommendation regarding the
financial effects of the plans and events described shares of the Company. Past performance cannot be
herein. Forward looking statements contained in this relied upon as a guide to future performance.
presentation regarding past trends or activities should
not be taken as representation that such trends or
activities will continue in the future. You should not
place undue reliance on forward looking statements,
which apply only as of the date of this presentation.
© 2016 DMGT | 50Notes
Operating profit is stated before exceptional items, other Underlying revenue or profit is revenue or profit on a like-for-
gains and losses, impairment of goodwill and intangible like basis, adjusted for constant exchange rates, disposals,
assets, pension finance charges, premiums on bond closures, non-annual events occurring in the current and
redemptions and amortisation of intangible assets arising prior year and acquisitions. For dmg information,
on business combinations. These adjusted results, including underlying growth includes the year-on-year organic
revenue and operating profit, are for total operations, growth from acquisitions and excludes disposals. For dmg
including those treated as discontinued, namely dmg events, the comparisons are between events held in the
media’s digital recruitment business, Evenbase. year and the same events held the previous time. For
Euromoney, disposals are excluded and a biennial event
that took place during the period is also excluded.
Percentages are calculated on actual numbers to one Euromoney’s underlying profit excludes the benefit in
decimal place. FY2015 of the release of the accrual made the previous
year in respect of its CAP incentive plan. For dmg media,
Amounts are stated rounded to the nearest million pounds, underlying comparisons exclude disposals, Wowcher and
consequently totals may not equal the sum of the Evenbase, and include the year-on-year organic growth
component integers. from acquisitions. Underlying revenues only include the
profit but not the gross-up, equivalent to the cost of sales,
from low margin newsprint resale activities.
© 2016 DMGT | 51Portfolio management ensuring long term growth
Acquisitions:
HY 2016
FY 2009 – £8M FY 2010 – £37M FY 2011 – £94M FY 2012 – £75M FY 2013 - £93M FY 2014 - £174M FY 2015 - £123M To 31 Mar 2016 -
£20M
Broadbean Calnea OnGeo Intelliworks First Search SearchFlow / DIIG Starfish ETSOS
Metropix Arete BuildFax PrepMe Beat the GMAT Energytics Locus Energy PAR Framework
Exhibition Management
Globrix Foresight Analytics Spring Rock Edumate SiteCompli Petrotranz
Services
National Transcript
Ned Davis Research Global Grain Xceligent Energy Fundamentals Daily Mail Australia
Center
Jobrapido Vessel Tracker Quartz Coatings Digital H2O
Praedicat * Insider Publishing Infrastructure Journal Commodity Vectors
Centre for Investor
Xceligent * Mining Indaba Empower
Education
Bolt-on TTI / Vanguard Petrotranz * Gulf Glass & GulfSol
HSBC's Quantitative
Adjacent iProf * Elite Daily
Techniques
Cougar Software* Skymet * WellAware *
Ochresoft * Liases Foras *
Mercatus * Funcent *
Propstack *
CompStak *
Dealogic *
Estimize *
Zanbato *
Disposals:
HY 2016
FY 2009 – £28M FY 2010 – £81M FY 2011 – £125M FY 2012 – £117M FY 2013 - £88M FY 2014 - £253M FY 2015 - £143M To 31 Mar 2016 -
£112M
© 2016 DMGT | 52
*Minority investmentDividend growth continues
20 year CAGR: 8%
21.4p
22
20
18
16
14
Pence
12
10
8 7.7p
6 4.5p
4
2
0
1995 2015
Dividend Inflation
FY 2016 Interim dividend of 6.7 pence, up 3%
© 2016 DMGT | 53Underlying analysis
Revenues
HY 2016 HY 2015
£ million % Underlying M&A Other Actual Underlying M&A Exchange Other Actual
B2B
RMS +1% 96 - - 96 96 - 4 - 91
dmg information +6% 230 - - 230 217 12 4 - 201
dmg events +5% 72 - - 72 69 (8) 2 16 58
Euromoney (6%) 190 - (5) 194 203 (2) 7 - 198
+1% 588 - (5) 592 584 3 17 16 548
Consumer
dmg media (3%) 331 (4) (23) 358 342 (13) - (19) 374
Total revenues (1%) 919 (4) (27) 950 926 (11) 18 (3) 922
M&A adjustments are for disposals, including dmg media’s Wowcher and Evenbase businesses, and acquisitions. The underlying results of dmg information,
dmg events and dmg media include the post-acquisition organic growth from acquired entities.
‘Other’ includes adjustments for the timing of shows at dmg events and a biennial event at Euromoney, as well as the gross-up, equivalent to the cost of
sales, on the low margin resale of newsprint activities.
Amounts are stated rounded to the nearest £1m, consequently totals may not equal the sum of the component integers.
© 2016 DMGT | 54Underlying analysis
Adjusted operating profit
HY 2016 HY 2015
£ million % Underlying M&A Other Actual Underlying M&A Exchange Other Actual
B2B
RMS +47% 19 - - 19 13 - - - 13
dmg information +1% 25 - - 25 25 (2) - - 27
dmg events (2%) 24 - (1) 25 25 (1) - 7 17
Euromoney (15%) 45 - (2) 47 52 (1) 3 (3) 53
(2%) 113 - (3) 116 115 (4) 4 5 110
Consumer
dmg media (29%) 38 (2) - 39 53 (4) - - 57
Corporate costs (6%) (18) - - (18) (17) - - - (17)
Total operating profit (12%) 133 (2) (3) 138 151 (8) 4 5 150
B2B and Consumer underlying figures are stated pre the allocation of Corporate costs. Including Corporate costs, the underlying growth rates for B2B and
Consumer were –3% and -33% respectively.
‘Other’ includes adjustments for the timing of shows at dmg events and a biennial event at Euromoney and an adjustment to exclude the benefit in FY
2015 from the release of previously accrued CAP costs at Euromoney.
© 2016 DMGT | 55
Amounts are stated rounded to the nearest £1m, consequently totals may not equal the sum of the component integers.B2B & Consumer diversity
£ million Share of total HY 2016 HY 2015 Change Underlying
Revenues
B2B 62% 592 548 +8% +1%
Consumer 38% 358 374 (4%) (3%)
100% 950 922 +3% (1%)
Profits*
B2B 76% 105 100 +5% (3%)
Consumer 24% 33 50 (34%) (33%)
100% 138 150 (8%) (12%)
* Profits include Corporate costs, allocated on a revenue basis.
© 2016 DMGT | 56Geographical diversity
£ million Share of total HY 2016 HY 2015 Change Underlying
Revenues
UK 47% 450 475 (5%) (6%)
North America 31% 298 263 +13% +7%
Rest of World 21% 202 184 +10% (0%)
100% 950 922 +3% (1%)
Profits
UK 46% 64 73 (13%) (19%)
North America 33% 45 49 (8%) (8%)
Rest of World 21% 29 28 +5% (1%)
100% 138 150 (8%) (12%)
Share of revenues shown to nearest whole percentage. On slide 8, UK’s 47.4% is shown as 48%.
Revenues by destination and profits by source
Rest of World revenues, 21%: 10% Rest of Europe, 1% Australia, 10% Asia, Middle East, Caribbean, Africa © 2016 DMGT | 57
and Latin AmericaGeographical analysis
Revenues by destination
£ million RMS dmgi dmge Euromoney dmg media Total
Revenue
UK 19 77 5 25 324 450
North America 60 129 5 87 17 298
Rest of World 18 24 62 82 17 202
96 230 72 194 358 950
This table shows the revenues based on the location of the client receiving the goods or services
© 2016 DMGT | 58Geographical analysis
Revenues by source
£ million RMS dmgi dmge Euromoney dmg media Total
Revenue
UK - 76 18 76 349 520
North America 94 132 0 95 5 326
Rest of World 3 22 53 23 4 104
96 230 72 194 358 950
This table shows the revenues based on the location of the DMGT company that is providing the goods or services to the clients
© 2016 DMGT | 59Revenue dynamics
Weak print advertising
£ million % of total HY 2016 HY 2015 Change Underlying
Advertising - print 14% 128 148 (13%) (13%)
(4%)
- digital 7% 68 65 +4% +21%
Circulation 16% 153 157 (3%) (3%)
Subscriptions 31% 297 273 +9% +2%
Events, conferences and training 14% 135 124 +9% (4%)
Transactions & other 18% 169 155 +9% +4%
Total Revenue 100% 950 922 +3% (1%)
- Reported digital advertising growth adversely impacted by disposal of Wowcher
- Reported subscriptions and events growth benefited from the stronger US dollar
- Reported events growth benefited by the occurrence of Gastech
© 2016 DMGT | 60Category analysis
Revenues by type
Revenues £ million RMS dmgi dmge Euromoney dmg media Total
Advertising - print - - - 15 113 128
- digital - 7 - 3 57 68
Circulation - - - - 153 153
Subscriptions 96 92 - 109 - 297
Events, conferences
- - 72 63 - 135
and training
Transactions & other - 131 - 4 35 169
96 230 72 194 358 950
© 2016 DMGT | 61Advertising revenues
Digital increase more than offset by print decline
£ million % of total HY 2016 HY 2015 Change Underlying
UK National newspapers 58% 113 131 (13%) (13%)
Euromoney 8% 15 16 (9%) (14%)
Other 0% - 1 (100%)
Total print 65% 128 148 (13%) (13%)
News websites (MailOnline & Metro) 23% 44 36 +24% +20%
Consumer websites 7% 13 20 (36%) +58%
Euromoney 2% 3 4 (6%) (8%)
Other 4% 7 6 +29% +24%
Total digital 35% 68 65 +4% +21%
Total advertising 100% 196 213 (8%) (4%)
© 2016 DMGT | 62Adjusting items
Reconciliation from statutory PBT to adjusted PBT
£ million HY 2016 HY 2015
Statutory Profit Before Tax - continuing operations 195 127
Add: Statutory PBT - discontinued operations (note 20) - 1
Add: Profit on disposal of discontinued operations (note 20) ¹ - 49
Statutory PBT including discontinued operations 195 177
Reverse: Pre-tax exceptional credit (slide 27) (68) (76)
Add back: Premium on bond redemptions (slide 25) - 40
Remove: IAS19(Revised) finance costs (slide 25) 2 4
Adjusted Profit Before Tax 129 146
¹ The £128m profit on disposals in HY 2015 shown on slide 27 includes the profit on disposal of discontinued operations, which is
excluded from statutory PBT as well as from adjusted PBT (since statutory results exclude discontinued operations). The profit on
disposal of discontinued operations is effectively added in and then reversed back out in this reconciliation.
© 2016 DMGT | 63Balance Sheet
£ million 31 Mar'16 31 Mar'15 Movement
Goodwill & Intangible assets 1,376 1,273 103
Other non-current assets 566 608 (42)
Current assets (excl. cash) 369 381 (12)
Net debt (719) (754) 35
Pension deficit (85) (210) 125
Other liabilities (880) (887) 7
Net assets 627 412 216
Equity attributable to owners of DMGT 466 262 204
Non-controlling interests 162 150 12
Shareholders' equity 627 412 216
© 2016 DMGT | 64Pension deficit
£ million Obligations Assets Deficit
As at 30 September 2015 (2,437) 2,278 (159)
Benefit payments 44 (44) -
Interest (cost) / income (44) 42 (2)
Company contributions - 37 37
Service & administration costs (2) - (2)
Actuarial movement (43) 84 42
As at 31 March 2016 (2,483) 2,397 (85)
© 2016 DMGT | 65Net debt
Strong funding position
Bonds Coupon £m
December 2018 5.75% 213
April 2021 10.0% 10
June 2027 6.375% 200
423
Derivatives (1)
Facilities 315
Other debt 3
Less: Cash in hand (21)
Net Debt 719
Bank facilities Facility Drawings Undrawn
Expiring March 2019 602 (315) 287
© 2016 DMGT | 66Pension deficit funding plan
70 £64m Total
£34m Recovery
60 Plan
£50m Amounts
£48m
50
Total
£ millions
£13m £19m
£33m £Xm Actual
40 £19m H1'16 £5m Payments
£31m £34m
£61m £8m £34m £34m £34m
30 £4m
Northcliffe disposal
£17m
20
£29m £29m £29m £29m Share buy-back /
10 Other
£12m Minimum recovery
0 payments
FY 2012 FY 2013 FY 2014 FY 2015 FY 2016 FY 2017
• Funding plan agreed in Feb’14: c.£34m p.a. to 2020, c.£28m p.a. to 2022 and £23m p.a. to 2026, including £5m p.a. to 2022 on
‘Offset recovery payments’. Payments in excess of the £34m p.a. recovery plan amounts can be carried forward against
future ‘Offset recovery payments’. Contributions cease once actuary agrees schemes are not in deficit.
• Actuarial valuation as at 31 March 2016 is currently in progress.
• IAS19 deficit at 31 March 2016 = £85m (£159m at 30 September 2015)
• Future payments in excess of £29m p.a. of minimum recovery plan payments to 2020 are dependent on share buy-backs, M&A affecting
schemes or pensions liability management, plus other minor contributions. The share buy-back and other payments in excess of £5m p.a. in
FY 2014 and FY 2015 can be carried forward such that, in the absence of further share buy-backs, only the £29m minimum recovery plan
payments would be required in FY 2017.
• Additional future payments equivalent to 20% of share buy-backs are required.
© 2016 DMGT | 67Gastech in FY 2016
FY 2012 FY 2013 FY 2014 FY 2015 FY 2016 FY 2017 FY 2018 FY 2019
Event H1 H2 H1 H2 H1 H2 H1 H2 H1 H2 H1 H2 H1 H2 H1 H2
Gastech B 18M 18M 18M 18M
Big 5 Dubai A A A A A A A A
ADIPEC B A A A A A A
Global Petroleum Show B B A (smaller) A (larger) A (smaller) A (larger) A (smaller)
FY12 FY13 FY14 FY15
Revenues £m £m £m £m
Total for major events 23 39 53 44
Key
Other events 48 48 47 50
71 87 100 95 A Annual
Disposals: 18M 18 Months
Evanta 18 - - -
B Biennial
Total including disposals 89 87 100 95
© 2016 DMGT | 68Revenue performance by business quadrant
+
Revenue share: Revenue share:
FY15 59% → H116 64%
FY15 16% → H116 18% Batten
down the Invest
Underlying growth rate: Underlying growth rate:
Structure
hatches FY15 +4% → H116 +2%
FY15 (4)% → H116 (9)%
- Cycle +
Revenue share: Revenue share:
FY15 16% → H116 12% Use the FY15 9% → H116 6%
Disinvest time
Underlying growth rate: Underlying growth rate:
wisely
FY15 (15)% → H116 (27)% FY15 (5)% → H116 (5)%
-
© 2016 DMGT | 69Underlying advertising revenue trends
£ million % Q1 Q2 Half Year
Newspapers 68% 59 54 113
% v last year (12%) (15%) (13%)
Newspaper websites 28% 23 24 47
% v last year +27% +13% +19%
Subtotal 96% 82 77 160
% v last year (4%) (8%) (6%)
Digital businesses 4% 4 3 7
% v last year +73% +45% +60%
Total 100% 86 80 166
% v last year (2%) (7%) (4%)
Percentages show underlying variances. The digital and total percentages exclude revenues from Evenbase, which has been disposed of.
‘Newspaper websites’ includes revenues from the Metro app for tablets and mobile devices, these are excluded from MailOnline’s revenues.
© 2016 DMGT | 70Advertising revenue quarterly trends
% of total Q1 v PY Q2 v PY HY16 v PY
Retail 26% (12%) (7%) (10%)
Travel 11% +0% (15%) (10%)
Entertainment 11% +22% (11%) +5%
Finance 7% (8%) (24%) (17%)
Telecoms 5% (16%) (31%) (23%)
Motors 3% (7%) (49%) (32%)
Mail Order 3% +8% (4%) +2%
Others 34% +0% +8% +3%
Total 100% (4%) (8%) (6%)
UK newspaper titles, including companion websites. Excludes other digital businesses such as Elite Daily.
© 2016 DMGT | 71Reporting calendar
Reporting dates for FY 2016
Release Date
Q3 Trading update 21 July 2016
Pre-close trading update 29 September 2016
Preliminary full year results 1 December 2016
© 2016 DMGT | 72Sep-95
Mar-96
Sep-96
Mar-97
Sep-97
Mar-98
Sep-98
Mar-99
Sep-99
Mar-00
Sep-00
Mar-01
FTSE ‘All Share’
Sep-01
Mar-02
Sep-02
Mar-03
Sep-03
Mar-04
Sep-04
Share price performance
Mar-05
Sep-05
Mar-06
Sep-06
Mar-07
Sep-07
Mar-08
Sep-08
Mar-09
Sep-09
Mar-10
The 20 year view – excluding dividend reinvestment
Sep-10
Mar-11
Sep-11
Mar-12
Sep-12
Mar-13
Sep-13
Mar-14
Sep-14
DMGT ‘A’ Shares
Mar-15
Sep-15
© 2016 DMGT | 73
Mar-16Thank You
DMGT
Northcliffe House
2 Derry Street, London W8 5TT UK
T +44 (0)20 7938 6000
F +44 (0)20 7938 4626
www.dmgt.com
© 2016 DMGT | 74You can also read


