The UKs leading online retailer of beach holidays Interim Results for the 6 months ended 31 March 2017

Page created by Clifton Hill
 
CONTINUE READING
The UKs leading online retailer of beach holidays Interim Results for the 6 months ended 31 March 2017
The UKs leading online retailer of beach holidays
Interim Results for the 6 months ended 31 March 2017
The UKs leading online retailer of beach holidays Interim Results for the 6 months ended 31 March 2017
Agenda

 Paul Meehan     H117 Highlights & Market Dynamics
      CFO

 Paul Meehan
                 H117 Financial Performance
      CFO

 Simon Cooper    Evolution of Key Drivers
     CEO         Summary and Outlook

                 Q and A

                                                      2
The UKs leading online retailer of beach holidays Interim Results for the 6 months ended 31 March 2017
H117 Highlights
OTB continues to disrupt the retail of beach holidays through innovative technology and value proposition

                           10% YOY increase in daily unique visitors to site in H117
   Structural Market
   Growth & Market         Hotelier pricing policies leading to later booking pattern for peak and Western Mediterranean
     Share Growth          Tour operator FX hedge provided advantage in early market, OTB now stealing share

                           Continued investment into IT function is increasing the pace of innovation
  Optimise Customer
                           5.0m logged in user sessions in H117
     Proposition
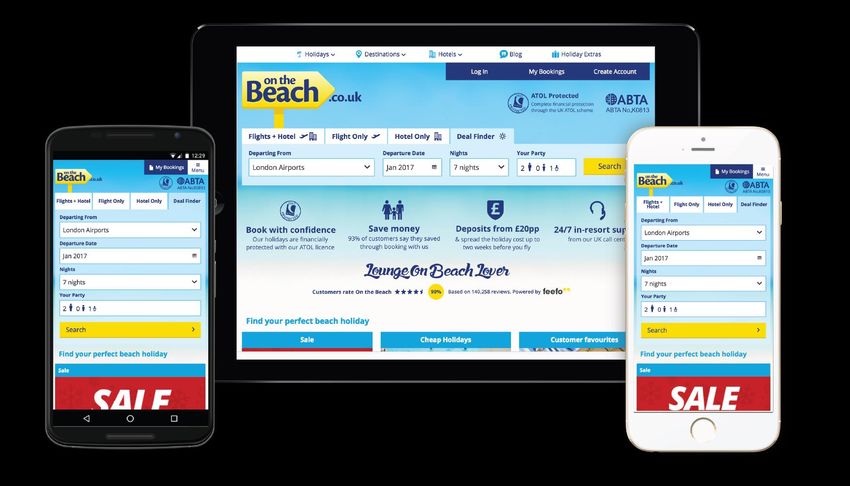
                           53% of all visits to site now on smartphone

                           21% YOY increase in H117 Revenue after marketing (excluding incremental offline activity end H1)
  Leverage £ Revenue       Direct contracting averaging 66% of all hotel buying in H1
                           Increasing % of supply is differentiated

  Drive Efficient Share    Efficiencies in online marketing reduced spend from 46.3% of revenue in H116 to 40.5% in H117
       Growth &            Proportion of online saving reinvested to increase offline share of voice
   Strengthen Brand        57% of H117 traffic to site from brand and direct sources

   Drive Operational       34% growth in Profit before tax in H117
  Leverage & Expand        23% increase in UK EBITDA
    Internationally        Continued growth of Revenue in Sweden and launch of Norway

                                                                                                                               3
The UKs leading online retailer of beach holidays Interim Results for the 6 months ended 31 March 2017
H117 Market Dynamics
Peak pricing policies are leading to a later booking pattern for peak summer departures
                                                                           H1 YOY % increase in bookings
  Tour operator share for early bookings supported by
        ‒ Rates agreed pre S16 for early S17 sales
        ‒ % of currency hedged pre Brexit

  Pricing policy for peak stays changed
        ‒ Early booking discounts removed
        ‒ Peak booking intake slower                                        Not W Med      W Med           All Dates    All Dest
                                                                             Off Peak      Off Peak     Not        W     Off Peak
                                                                            peak          peak           W        Med   peak
                                                                                                        Med
  The above trends are reversing
        ‒ Discounts now being applied for peak stays
        ‒ More availability in prime destinations / product for peak YOY
                                                                           H2 YOY % increase in bookings (to 3/5/17)

  Longer term these strategies should benefit OTAs more flexible model

                                                                           Not W Med       W Med           All Dates    All Dest
                                                                             Off Peak     Off Peak     Not        W      Off Peak
                                                                            peak         peak           W        Med    peak
                                                                                                       Med
                                                                                                                                    4
The UKs leading online retailer of beach holidays Interim Results for the 6 months ended 31 March 2017
Profit & Loss Account – UK Segment
H1 17 EBITDA growth of 23% YOY

P&L UK Segment                                                        UK YTD growth year on year:
Six months ended 31 March (£m)       H1 FY17   H1 FY16   Change %
                                                                             Revenue +7%
Revenue                                 37.5      35.0        7.1%           Revenue after Marketing + 17%
                                                                             EBITDA +23%
Marketing costs excluding offline     (15.2)    (16.2)
Offline                                (2.9)     (2.2)
Total Marketing                       (18.1)    (18.4)                Efficient increase in our market traffic share
- % of Revenue                        48.3%     52.6%                   with marketing spend excluding offline as a %
- % of Revenue (excluding offline)    40.5%     46.3%                   of revenue falling from 46.3% to 40.5%

Revenue after marketing costs           19.4      16.6       16.9%    31% increase in Offline Marketing spend to
Variable costs                         (2.0)     (1.9)                  further drive brand awareness
Overhead costs                         (3.1)     (3.1)                Revenue after Marketing increased by 16.9%
EBITDA                                  14.3      11.6       23.3%      and 21.0% excluding incremental offline spend
- % of Revenue                        38.1%     33.1%                   late in H1
                                                                      Fixed and variable cost per booking dropped
Daily Unique Visitors '000            27,538    25,151        9.5%      from 14.3% to 13.6% of Revenue
Variable cost % Revenue                5.3%      5.4%                 EBITDA % revenue at 38.1% up from 33.1% in
Overhead cost % Revenue                8.3%      8.9%                   H116
Total costs % Revenue                 13.6%     14.3%

                                                                                                                        5
Profit and Loss Account - International
Investment continues in Sweden to build scale and brand
 P&L International Segment                                                      Objective in new source markets remains to
 Six months ended 31 March (£m)               H1 FY17     H1 FY16   Change %     deliver a positive return within 3 full years of
                                                                                 launch
 Revenue                                          0.6         0.5      20.0%

                                                                                OTB has invested to grow its share of market
 Marketing costs excluding offline              (1.1)       (1.1)
                                                                                 both online and offline
 Offline                                        (0.4)       (0.2)
 Total Marketing                                (1.5)       (1.3)
                                                                                FY17 market slow to start but strengthening
 Revenue after marketing costs                  (0.9)       (0.8)                in recent months
 Variable costs                                 (0.1)       (0.1)
 Overhead costs                                     -       (0.1)
                                                                                Norway launched end 2016
 EBITDA                                         (1.0)       (1.0)

Source:   Company Information                                                                                                       6
Profit and Loss Account - Group
Adjusted profit before tax +28.4% increase YOY
 P&L Total
 Six months ended 31 March (£m)                                                                    H1 FY17                H1 FY16      Change %

 EBITDA UK segment excluding share based payments                                                        14.5                   11.6       25.0%
 EBITDA International segment                                                                           (1.0)                  (1.0)                Amortisation of acquired intangibles and
 Group EBITDA excluding share based payments                                                             13.5                   10.6       27.4%     deferred tax credit shown below adjusted
 Depreciation and amortisation (1)                                                                      (1.2)                  (1.0)                 profit before tax
 EBIT                                                                                                    12.3                    9.6       28.1%
 External Financing costs                                                                               (0.1)                  (0.1)                Interim Dividend of 0.9p declared
 Non trading costs                                                                                          -                      -
 Profit Before Tax                                                                                       12.2                    9.5       28.4%
 Corporation Tax                                                                                        (2.4)                  (1.9)
 Adjusted Profit after Tax                                                                                9.8                    7.6       28.9%
 Share Based Payments                                                                                   (0.2)                      -
 Amortisation of acquired intangibles                                                                   (2.1)                  (2.1)
 Deferred tax on amortisation of acquired intangibles                                                     0.4                    1.0
 Retained Earnings                                                                                        7.9                    6.5

 Effective tax rate                                                                                   19.7%                   20.0%

Source:   Company Information
Note:     Effective tax rate is based on corporation tax divided by Profit Before tax excluding amortisation of intangibles                                                                     7
Cash Flow
 Cash is invested in areas that drive growth
   Cash Flow
                                                             H1 FY17    H1 FY16
   Opening Cash Balance Total                                    51.7       34.8
   Opening Cash Balance Trust                                    25.6       23.9    Working capital movement relates to the seasonality
   Opening Cash Balance excluding trust balance                  26.1       10.9     of the business with c50% of bookings travelling
                                                                                     between June and August

   EBITDA                                                        13.3       10.6
   Decrease/(increase) in working capital                      (11.8)      (7.6)    Enhanced Low Deposit Scheme launched, offering the
   Movement in Trust balance                                   (23.0)     (14.9)     customer more flexible payment options. This drives
   Purchase of plant and equipment                              (0.4)      (0.6)     additional bookings and increased seasonal cash
                                                                                     outflow to fund this. Full year cash flow is unaffected
   Capitalised Dev Expenditure                                  (1.3)      (1.2)
                                                                                     as payments are made in full prior to departure
   Operating Cash Flow                                         (23.2)     (13.7)
   Operating cash/EBITDA                                     (174)%     (130)%
   Corporation tax                                             (2.4)      (0.7)
   Interest received                                               -        0.1
   Interest paid                                                   -      (0.1)
   Dividends paid                                              (2.8)          -
   Net increase/(decrease) in cash excluding trust account     (28.4)     (17.5)

   Closing Cash Flow excluding trust balance                    (2.3)      (6.6)
   Closing Cash Balance Trust                                    48.6       38.9
   Closing cash balance Total                                    46.3       32.3

Source:   Company Information                                                                                                                  8
Balance Sheet
Balance Sheet
                                           H1 FY17     H1 FY16
Tangible Assets                                  0.9         0.9    All customer monies are paid into a trust account which is
Intangible Assets - IT development               3.6         3.0     effectively a debtor to the business
Intangible Assets - Acquired Intangibles        37.7        42.0
Intangible Assets Goodwill                      21.5        21.5
                                                                    Seasonal cash flow requirements are covered by a
Total Fixed Assets                              63.7        67.4
                                                                     revolving credit facility of up to £35m which is drawn
Trade debtors                                 103.1         89.4
                                                                     down as required
Trust Account                                   48.6        38.9
Cash                                               -           -
Other debtors                                    7.8         3.0    Net debt has reduced from £6.6m to £2.3m
Total Current Assets                          159.5       131.3
Trade creditors                             (112.3)      (98.6)
Corporation tax payable                        (3.7)       (3.3)
Other taxes and social security                  0.8         0.2
Accrued expenses                             (10.8)      (11.6)
Derivative Financial Instruments               (1.0)         3.1
Total net current liabilities               (127.0)     (110.2)
NET CURRENT ASSETS                              32.5        21.1
Deferred Taxation                              (6.6)       (7.7)
Bank facility                                  (2.3)       (6.6)
Net assets                                      87.3        74.2

Net Debt                                      (2.3)       (6.6)
Net Trade Drs/Crs                              39.4        29.7

                                                                                                                                  9
KPIs: H113 to H117
         Traffic Growth ( ‘000 Daily Unique Visitors)                     Revenue per Daily Unique Visitor (£)
30000
                                                               £1.50
25000
                                                               £1.30
20000
                                                               £1.10
15000
10000                                                          £0.90

5000                                                           £0.70
    0                                                          £0.50
        H113       H114        H115       H116          H117           H113       H114         H115     H116      H117

                          Revenue (£m)                                   Revenue after Marketing Spend (£m)
                                                               £20.0
£40.0
                                                               £15.0
£30.0

£20.0                                                          £10.0

£10.0                                                           £5.0

 £0.0                                                           £0.0
        H113       H114        H115       H116          H117           H113       H114         H115    H116      H117

         Fixed and Variable costs as a % of Revenue                                      EBITDA (£m)
25.0%                                                          £15.0

20.0%
                                                               £10.0
15.0%

10.0%                                                           £5.0
 5.0%

 0.0%                                                           £0.0
        H113       H114         H115      H116          H117           H113       H114        H115     H116      H117
                                                                                                                         10
Key Drivers of Growth
Innovate through investment in talent & technology
Continued investment into in-house technology extends our ability to out innovate the competition

  Continued investment in our technology capability allows us to          Technology platform
   innovate at an increasing pace
                                                                                Service management, monitoring and alerting
  Our modular platform is continually evolving
                                                                                           Management information system

  Our working methodologies are becoming more agile                                              Technology platform

                                                                                                                                 Integrated
                                                                                 CMS            Beach Bot     CRM Services
  We continue to build innovative new features to benefit our customers                                                        Phone System

                                                                                              Recommendat       Universal         Enhanced
                                                                                myOTB                                           Backoffice app
                                                                                                ion Engine    Payments app

                                                                                                Scalability     Hotels
                                                                                Dynamic                                          iPhone, iPad,
                                                                                               Management     Management
                                                                                 Pricing                                        Apple TV Apps
                                                                                               Framework         app

                                                                              Manage Your                                       Internationalis
                                                                                                 Colossus
                                                                               Booking
                                                                                                              Personalisation        ation
                                                                                                  search                          Framework

                                                                                                    Data aggregation

                                                                                                    Data acquisition

                                                                                                                                                  12
Personalise Customer Proposition
Our ambition is to drive a fully personalised cross-device experience for all users on all devices

     Revenue per                                        Revenue per
                             Conversion                                  Split testing
       booking                                          unique visitor

 Enhanced split test capability drives improvements to revenue per UV
       ‒ Large volumes of traffic required to reach statistical
         significance
       ‒ Supported by continued improvements to agile working
         methodologies
       ‒ Testing hundreds of site variations simultaneously across all
         devices – exponentially more than previously

 Continued improvements to personalisation technology and login
       ‒ 40% growth in logged in users with increased levels of
                                                                         Conversion per device – logged in vs not logged in
         engagement and conversion
       ‒ Probabilistic matching drives virtual login
       ‒ DMP integration ensures better first time personalisation

                                                                                         Logged          Logged               Logged
                                                                                           in              in                   in
                                                                                                                                       13
Leverage Direct & Differentiated Supply
Driving an increasing % of exclusivity presents a huge opportunity
                                                                       Direct contracting - share of monthly arrivals
  Investment made to scale our supply function
        ‒ Scale and disintermediation drives margin growth          90.0%
                                                                    80.0%
                                                                                                                      70%
                                                                    70.0%
  Direct contracting function performs in line with expectations   60.0%
                                                                    50.0%
        ‒ 66%+ of hotels directly contracted, driving >50% of
                                                                    40.0%
           Group revenues                                           30.0%
                                                                    20.0%
                                                                    10.0%
  FY17–FY18 use differentiated supply to drive volume and market
                                                                     0.0%
   share gains

  FY19-FY20 convert differentiated supply position into               Hotel contracting: Incremental margin / volume opportunity
   incremental margin
                                                                                                                                      % H117 sales

                                                                                                                     UK OTA

                                                                                   Volume / Margin Opportunity
                                                                                                                    exclusivity

                                                                            HIGH
                                                                                                                                          22%
                                                                                                                     UK rate
                                                                                                                    exclusivity

                                                                                                                  Standard direct
                                                                                                                     contract             43%

                                                                                                                 3rd party provided       35%
                                                                                                                      long tail
                                                                                                                                                     14
Drive an Efficient Increase in Share
Superior customer proposition delivers increased margins and offline investment strengthens brand

  Efficiencies in online spend allow for increased investment offline        Growing share efficiently
                                                                         Online spend as
                                                                          % of Revenue            50.8%                  50.2%                  46.3%                40.5%
  A multi-channel strategy supported by attributed in house bid
   modelling allows efficient share growth
                                                                             £1.40

  FY17 offline campaign was second national TV campaign                     £1.20
                                                                             £1.00
  Repeat purchase volume and rates continues to increase                    £0.80
                                                                             £0.60
  Planning commenced for FY18 campaigns
                                                                             £0.40
                                                                             £0.20
                                                                             £0.00
                                                                                                 H1 14                   H1 15                 H1 16            H1 17
                                                                                           Revenue per daily UV          Marketing cost per UV inc offline   EBITDA per UV

                                                                              Repeat booking volumes and %                                                           Repeat as % of
                                                                                                                                                                      all bookings

                                                                                              26.9%           30.0%              31.6%            37.4%      40.3%
                                                                           90000
                                                                           80000
                                                                           70000
                                                                           60000
                                                                           50000
                                                                           40000
                                                                           30000
                                                                           20000
                                                                           10000
                                                                               0
                                                                                              H113                H114            H115             H116        H117
                                                                                                                                                                                 15
Drive Operational Leverage
We continue to drive further operational leverage of a lightweight cost base
                                                                         OTB vs Tour Operators £ Fixed / Variable CPB
  OTB fixed and variable cost per booking is well below tour operator
                                                                         250                            7X                8X
   competitors                                                                                         OTB               OTB

                                                                         200
  OTB fixed and variable costs as a % of revenue are reducing through
   operational leverage                                                  150

   ‒ Scalable model supports further leverage of a low fixed cost base
                                                                         100
   ‒ Investment into customer-facing functions in H1 should drive
      greater savings in H2                                               50

                                                                           0
                                                                                     OTB               TUI               TC

                                                                         OTB Fixed / Variable costs as % Revenue H113 to H117
                                                                         25.0%

                                                                         20.0%

                                                                         15.0%

                                                                         10.0%

                                                                          5.0%

                                                                          0.0%
                                                                                  H113       H114      H115       H116         H117
                                                                                                                                      16
Expand Model into New Source Markets
We remain encouraged with the improvement to KPIs being achieved in Sweden

 Scandinavia has a number of characteristics which made it            Branded UVs and share H115 – H117
  attractive for international expansion
                                                                       350000     10.2%           19.4%           30.4%

 FY17 market slow to start but strengthening in recent months
                                                                       300000

                                                                       250000
 Driving improvement in 3 KPIs will determine success in new source
  markets                                                              200000
   Cost per click, conversion and branded share                       150000
   Branded share is key as it reduces cost per click and improves
                                                                       100000
    conversion
                                                                        50000
 Our objective in new source markets remains to deliver a positive         0
  return within 3 full years of launch                                             H115            H116           H117

                                                                       Repeat purchase rate monthly H115 – H117
                                                                        30.00%

                                                                        25.00%

                                                                        20.00%

                                                                        15.00%

                                                                        10.00%

                                                                         5.00%

                                                                         0.00%

                                                                                                                          17
Evaluate acquisition opportunities
Opportunities exist to add significant value through acquisition

                                              Core - UK                                          Expansion

                         Leverage OTB technology to personalise customer
                          proposition                                        As core UK plus:
                               ‒ Drive conversion
                         Leverage OTB direct supply position               ‒ Remove execution risk
                               ‒ Drive revenue growth
    Like for like OTA    Consolidate / remove competition
                                                                            ‒ Acquire trusted brand
                         Rapidly increase traffic and passenger numbers
                               ‒ Volumes support differentiated supply
                         Leverage OTB bidding capability                   ‒ Accelerate international expansion
                               ‒ Increase share of voice
                         Leverage OTB cost base

                         As Like for Like OTA plus:

    Complementary       ‒ Remove execution risk
        OTA
                        ‒ Expand product offering / expertise

                                                                                                                   18
Summary & Outlook
We have delivered a strong H1 performance and reiterate confidence in our full year expectations

   Structural Market
   Growth & Market      Building share of a growing addressable market with increasing efficiency
     Share Growth

     Personalise
      Customer          Improving the throughput of innovation to personalise the customer proposition
     Proposition

      Leverage £
                        Driving increased % of direct and differentiated supply
       Revenue

     Drive Efficient
    Share Growth &      Strengthening OTB branded traffic and repeat purchase rates
   Strengthen Brand

   Drive Operational
  Leverage & Expand     Driving PBT growth in the UK and expanding internationally
    Internationally

                                                                                                          19
Appendix
OTB history
                                                                                                                                                2015
                                                                                                                                                Ebeach.se
                                                                                                                                                launched
                                                                                                                                                IPO

                                                                                                                       2013-14                  2016
                                                                                                                       Investment into          Exclusive flight
 Passenger                                                                                                             offline advertising      programme
 numbers                                                                                                               and direct               launched
                                                                                                                       contracting
1400000                                                                                                                                                            20%
                       Share of online
                       short haul beach                                        2009-11                                2013                           17%
                                                                               Technology team recruited,             2nd round
1200000                                                                        complete platform rebuild              private
                                                                                                                      equity
                                                                                                                                        16%
                                                                2008-10                          End 2011
1000000                                                         Executive and senior             Tech and MI
                                                                management team                  platforms
                               2005-6                           recruited                        relaunched                14%
                               First version
800000                         website, paid
                               search                                                                          13%

              2004                             2007
600000        Excess charter                   250,000
              supply                           passengers                                             9%
              Growing online                   First round
              penetration                      private equity
400000

200000

     0
             FY04      FY05           FY06          FY07          FY08         FY09       FY10        FY11     FY12        FY13          FY14        FY15          FY16
                                                                                                                                                                      21
Business Model
                        ADDRESSABLE MARKET
STRUCTURAL MARKET
                           Short haul beach                                                   OTB share of
GROWTH & MARKET                                                 Online                                               Unique visitors
                          holidays dynamically                                                market traffic
SHARE GROWTH                                                  penetration
                                packaged

PERSONALISE CUSTOMER                                         £ Revenue per
                                                                                                Conversion           Revenue per
PROPOSITION &                                                   booking                                              unique visitor
LEVERAGE £ REVENUE

                                                                                                                       Revenue

DRIVE EFFICIENT SHARE                                                                           Marketing
                                                                                                                       Marketing
GROWTH &                                                    Unique visitors                     spend per
                                                                                                                      investment
STRENGTHEN BRAND                                                                               unique visitor

                                                                                                                       Fixed and
                          OTB’s business model is centred on driving efficient growth in market share while         Variable Costs
                           maintaining and improving both conversion and £ revenue per booking
SCALE DRIVES              Our strategic initiatives are focused on driving the performance of all of these levers
OPERATIONAL LEVERAGE      EBITDA growth is the cumulative effect of improvements in performance of all of the
                           levers individually                                                                           PBT

                                                                                                                                       22
Disruptive retailer of beach package holidays
On the Beach has the product advantages of a tour operator with the model advantages of an OTA
   Tour
 Operator                                                                                           OTA

   HIGH                                       Cost Base                                             LOW

    HIGH                                          Risk                                              LOW

    HIGH                                        Margin                                              LOW

  NARROW
                                                Product                                           BROAD
                                                 Range

 Specialist                                                                                      Generalist
                                                                                                              23
Market - UK
The market is resilient and online penetration is increasing
 Overall short haul beach holiday volumes are resilient and online             Short haul beach online versus offline (UK)
   penetration continues to increase                                            16,000    Short haul beach offline     Short haul beach online
       ‒ Approximately 12m holidaymakers book short haul packages               14,000
          each year and this number is growing steadily
                                                                                12,000
       ‒ In 2004, online penetration in the market was ~10%                     10,000                                                                                2

       ‒ In 2016 just over 50% of holidaymakers booked online                    8,000

                                                                                 6,000
       ‒ Online penetration continues to rise
                                                                                 4,000
 Dynamic packaging offers greater value and flexibility and steals share
   from traditional package                                                      2,000

                                                                                    0
       ‒ Whilst tour operators have a 90%+ share of offline short haul                   2010   2011    2012    2013    2014    2015   2016      2017   2018   2019
          beach, their share of the online space is only 50%
                                                                                                                        4

                                                                            3

                                                                                                                                                                          24
Market - Europe
Similar trends in Europe to the core UK market represent an attractive expansion opportunity for OTB

 Online penetration in Europe is low but growing at a faster rate          2014 Western European package holiday market (€bn)
   than the UK                                                                                  €bn TTV      Online Penetration Rate                 90%
                                                                            20.00
                                                                                                          16.5                                       80%
 Low cost carriers are expanding their fleets                                                                                                       70%
                                                                            15.00
                                                                                                                                                     60%
                                                                                                                 11.4
 The market is dominated by legacy tour operators who have held a                                                                                   50%
                                                                            10.00                 7.7                                  8.0           40%
   stranglehold over seat supply
                                                                                                                                                     30%
                                                                                                                         4.2
                                                                             5.00                                                                    20%
                                                                                                                                               2.3
 The key drivers of success in new source markets will be:                         2.0   1.4                                    1.0                 10%
    Driving non-branded cost per click efficiencies                         0.00                                                                    0%
    Improving non-branded conversion
    Increasing branded share of traffic

 Our objective in Sweden is to deliver a positive return within a finite   Share of European Leisure Package Holiday market 2014
   time period whilst achieving significant share of market

                                                                                                                                       TUI

                                                                                                                                       Thomas
                                                                                                                                       Cook
                                                                                                                                       Kuoni

                                                                                                                                       Other

                                                                                                                                                           25
Competitive Landscape & Barriers to Success
On the Beach sells high margin tour operator style product with a lightweight OTA style fixed cost base

     FOCUS                   EXPERTISE                        AGILITY                       SCALE                         BRAND

UK Short Haul Beach Online - Estimated Market Share                      Tour operator short haul volumes (m pax)

                                                                        10

                                                  TUI                    9
                                                  Thomas Cook            8
                                                  Jet2holidays
                                                                         7
                                                  Cosmos Holidays
                                                                         6
                                                  Olympic Holidays
                                                  On The Beach           5

                                                  Travel Republic        4
                                                  Low Cost Holidays      3
                                                  Love Holidays          2
                                                  Easyjet Holidays
                                JET2                                     1
                                                  Other OTA
                                                                         0
                                                  Other tour operator
                                                                             2008   2009   2010   2011   2012   2013   2014   2015   2016

                                                                                                                                            26
Cash Flow – Flow of funds
On The Beach provides clear and comprehensive consumer protection
                                                               Trust account – funds flow for a £1,200 holiday
 The trust account is designed to ensure all
                                                               Checkout          Booking        Immediately               Holiday                        Return
  customer payments are protected until after                    stage            stage         after booking             build up                        date
  the provision of holiday services
                                                                                                                                                        Customer
                                                                 £600
                                                                 Hotel                                 ATOL Trust Fund (Protected)                       returns
 The trust account is governed by a deed                                                                                                                 from
                                                                                                                                                         holiday
  which determines the inflows and outflows
  from the account
                                                                               Customer
                                                                                 Pays
                                                                  £550          Deposit
                                                                 Flights
 All customer receipts are paid into the trust                                                                       Receive             Receive
                                                  CUSTOMER                      £226.95                                flight               full
  account in full before the holiday departure    £1,214.85*                                                          balance             balance
                                                                                                                      28 days             14 days
                                                                                                                        post               before
                                                                                                                      booking            departure
 These payments are held in the trust                            £50                                                 £332.95             £652.95
                                                                 Coach
  account until the service is provided                         Transfer

                                                                                                  Transfer to           Transfer to
                                                                                                 On the Beach          On the Beach                      Transfer
 On The Beach does not use customer pre-                                                        of flight sales       of flight sales                  to On the           OTB
  payments to fund its business operations                                                          value on              value on                       Beach of          £MPB
                                                                                                  receipt into          receipt into                   balance of
                                                                                                   trust from            trust from                    sales value        £159.85
                                                                                                   customer              customer                        £654.95
                                                                                                    £226.95               £332.95

                                                                                 Airline                                                                Hotel, Bed
                                                                                 paid in                                                                bank and
                                                                                 full by                                                                 ancillary
                                                   SUPPLIER                      On the                                                                  supplier
                                                                                Beach on                                                                   paid
                                                                                booking                                                                  £516.00
                                                                                £539.00

                                                                           * £1,200 holiday for 2 people via low deposit scheme includes 2 bags and assumes a direct debit card.
                                                                                          £4.95 fee each balance payment, so in the example it is paid three times                  27
Cash Flow - Seasonality
 Peak booking trading period between January and June and travelled June and August
     Booked by month                                                       % FY16 Booked by month
      Revenue recognised on a booked basis                              18.0%
                                                                                                    15.5%
                                                                         16.0%
                                                                         14.0%
      The period prior to Christmas is quiet
                                                                         12.0%                              11.1%
                                                                                                                    10.4% 10.0%
                                                                                                                                9.6%
                                                                         10.0%
                                                                                                                                           8.2% 8.1%
      Traffic volumes ramp up immediately following Christmas as         8.0%                                                                             7.2%
          customers start to research for the following summer                   5.8%                                                                              5.6%
                                                                          6.0%          4.3% 4.1%
                                                                          4.0%
     Travelled by month                                                   2.0%
                                                                          0.0%
      Peak departure months are July and August
                                                                                 Oct    Nov Dec      Jan    Feb Mar         Apr May        Jun     Jul     Aug     Sep

     Funds Flow                                                             % FY16 Travelled by month
           Invest in marketing and low deposits to drive bookings but   18.0%                                                                             16.3%
            margin and cash are earned on a travelled basis              16.0%                                                                     15.1%
                                                                                                                                           13.8%
                                                                         14.0%
                                                                                                                                   12.1%                           11.7%
                                                                         12.0%
                                                                                 9.7%
                                                                         10.0%
                                                                          8.0%                                              7.2%

                                                                          6.0%                                       4.8%
                                                                          4.0%          2.4% 2.3%      2.7%
                                                                                                  1.8%
                                                                          2.0%
                                                                          0.0%
                                                                                  Oct   Nov Dec      Jan     Feb Mar        Apr May         Jun     Jul     Aug     Sep

Source:   Company Information                                                                                                                                              28
Cash Flow: Cash Profile
 Facility used to fund low deposits during peak trading periods between January and June
                                                                                                                                         Annual cash cycle sees
                       0.00
                                                                                                                                          investment into working capital
          Millions

                           09/15   10/15   11/15    12/15   01/16   02/16   03/16   04/16   05/16    06/16    07/16    08/16    09/16
                      -2.00
                                                                                                                                          as bookings are achieved in Jan
                                                   Funding of Low Deposits FY16                                                           - June, with cash unwinding
                      -4.00                                                                                                               from the trust as customers
                                                                                                                                          travel
                      -6.00

                      -8.00

                     -10.00
                                                                                                                                         Facility available in FY16 was
                                                                                                                                          £35m, maximum drawdown
                     -12.00                                                                                                               was £13.5m
                     -14.00

                     -16.00

                     -18.00

                     -20.00

                     £25.00
          Millions

                     £20.00
                                                   Bank Balance Profile FY16
                     £15.00

                     £10.00

                      £5.00

                      £0.00
                          10/15    10/15   11/15    12/15   01/16   02/16   03/16   04/16   05/16   06/16    07/16    08/16    09/16

                      -£5.00

                     -£10.00

                     -£15.00

                     -£20.00
Source:          Company Information                                                                                                                                       29
You can also read