European Traded Gas Hubs: the supremacy of TTF - OXFORD ENERGY COMMENT - Oxford Institute for Energy Studies
←
→
Page content transcription
If your browser does not render page correctly, please read the page content below
MAY 2020

              European Traded Gas Hubs:
                        the supremacy of TTF

OXFORD ENERGY COMMENT                Patrick Heather
1. Introduction
The Author has been following the development of the European traded gas hubs over many years and
has already published a number of Papers and Insights on the subject. 1 This Comment will provide a
further update and will look at the results of the analysis of trading data in 2019 for the European traded
gas hubs while also considering the importance of the Dutch TTF hub, not only as a national hub but
also as a European and global pricing benchmark.
2. Setting the scene…
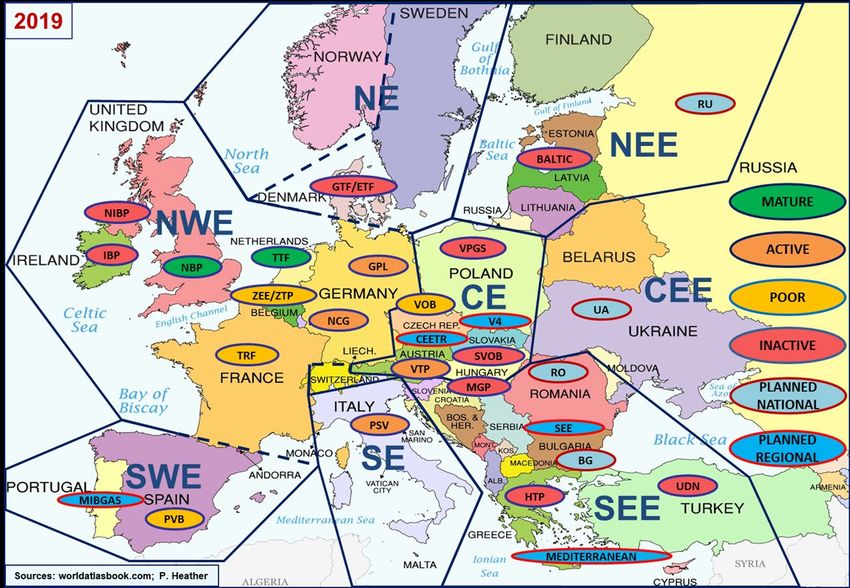
Map 1 shows all the gas hubs that were operational as at the end of 2019. The colour scheme indicates
which hubs are categorised 2 as ‘Mature’, ‘Active’, ‘Poor’ and ‘Inactive’. There are just two Mature hubs,
the British NBP and the Dutch TTF; four Active hubs, the German NCG and GPL, the Austrian VTP and
the Italian PSV; and four Poor hubs, the Belgian ZEE/ZTP, the French TRF, the Spanish PVB and the
Czech VOB; the remaining hubs are all Inactive.
Map 1: European gas regions, markets and hubs: 2019
1
All of which are available to download from the OIES website: https://www.oxfordenergy.org/authors/patrick-heather/
2
As defined by the Author, following his 5 Key Elements analysis; see Heather (2019), Chapter 2.
The contents of this paper are the author’s sole responsibility. They do not necessarily represent the views of
the Oxford Institute for Energy Studies or any of its Members.
2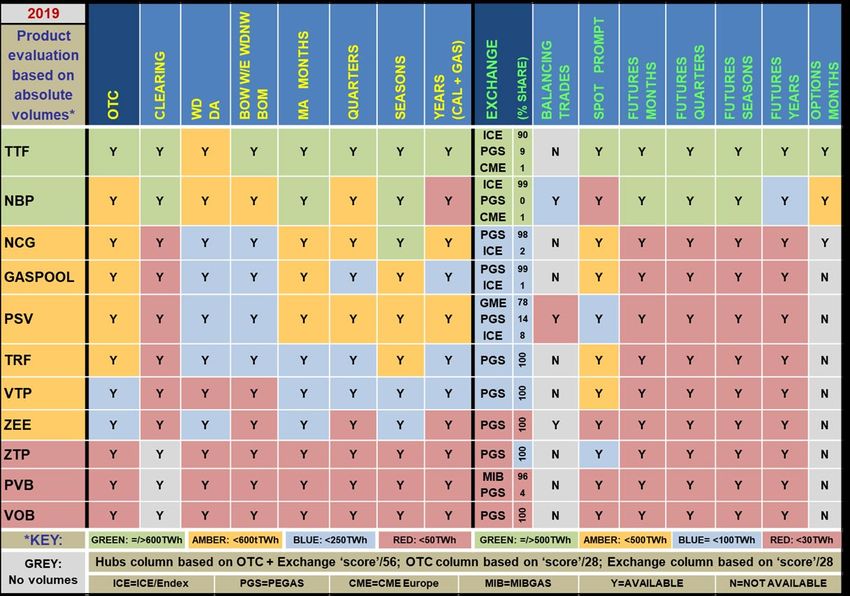
At the end of a decade of increasing trading of gas in Europe, the total traded volumes in 2019, across
all the European traded gas hubs, reached an all-time high 3 but the trend was quite different from hub
to hub. There have also been a number of new hubs starting to trade, 4 albeit in relatively very small
volumes and these are indicated as Inactive on the Map.
The latest results of the main hubs will be summarised in Section 5 below but the focus of this Comment
is on the Dutch TTF. That hub has seen a phenomenal rise in activity since 2014 which –has yet to
show any sign of slowing down – not yet at least. As we will see, it is now by far the most liquid, most
traded hub, with the greatest number of participants of all the European traded gas hubs.
The analysis this year reveals that there are more ‘active’ participants 5 on the TTF than on the NBP or
NCG hubs and significantly more than on all the other hubs. 6 The more ‘active’ participants there are,
the more liquidity there will be in a market, which is especially important in the mid-far curve for risk
management trades.
Table 1: Traded products - 2019

Sources: OTC: LEBA, ICIS; Exchange: ICE, ICE-Endex, PEGAS, CME, GME; MIBGAS; P. Heather
TTF is also the hub on which the greatest number of product types are traded and in the greatest
volumes, another indication of that hub’s maturity and a good indication that it is being used as a risk
management hub. Table 1 shows that in 2019 there were more than 500TWh traded in each of all the
exchange product types, and more than 600TWh traded in each of all the OTC product types, with the
exception of the Within Day and Day Ahead category. That is reflected in the green colour coding in the

3
  Total volumes, including OTC and exchange spot and futures trades: 51,390TWh. Previous high was in 2017: 50,263TWh.
4
  Details of these hubs are given in Heather (2015) and Heather (July 2019).
5
  For an explanation and methodology, see: Heather (July 2019), pp.3-5.
6
  The hub scores in 2019 are shown in the first column of Table 5.

The contents of this paper are the author’s sole responsibility. They do not necessarily represent the views of
the Oxford Institute for Energy Studies or any of its Members.                                                          3
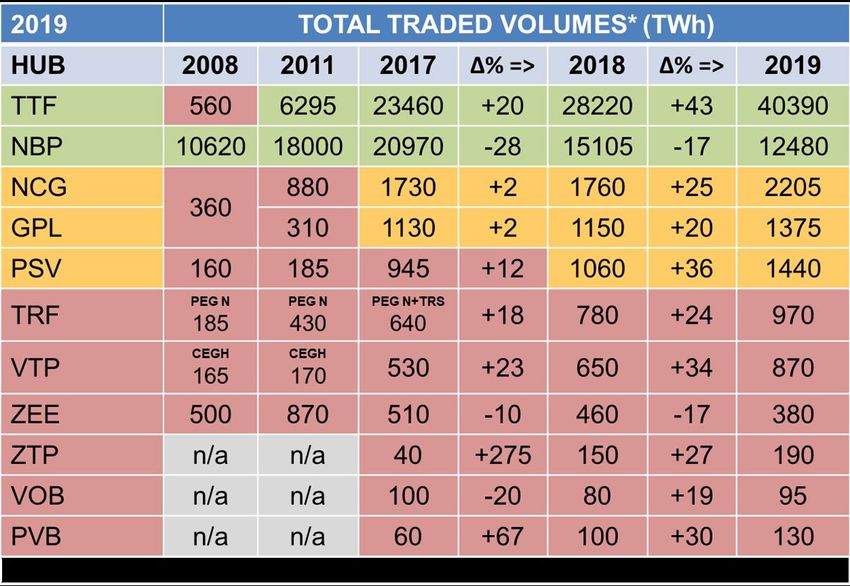
table. The NBP is the only other hub to have a number of products with the green colour coding. 7 The
important point to note here is that there is a high volume of trading occurring on TTF in the mid and far
curve and also in financial options (alone accounting for 5.9% of the total traded volumes).
Indeed, TTF has become the mature risk management hub, not just for the Netherlands but for all of
Europe and beyond, as it now also serves as a pricing hub for some LNG cargoes into north-west
Europe.

3. The rise, and rise, of TTF
The metric that really shows how TTF has grown almost exponentially in recent years is that of the total
volumes traded. Even if some of the other European hubs have continued to develop and to increase
their traded volumes, they can in no way match either the rate of growth or the absolute volumes
recorded by the TTF.
As Table 2 shows, the total traded volumes at TTF increased by over 40% year-on-year to a staggering
40,390TWh, more than three times greater than its nearest rival the British NBP, which traded
12,480TWh, and a massive eleven times greater than the two German hubs combined! TTF’s traded
volumes now account for 79% of the total European traded gas market.
Table 2: Traded volumes - 2019

Sources: 2008: converted from bcm in IEA 2009 Natural Gas Review, p.30;
2011-2019: LEBA, ICIS, ICE, ICE-Endex, EEX, Powernext, PEGAS, CME, CEGH, GME; MIBGAS; P. Heather
In this table, 8 mature hubs are shown in green; the active hubs, with developing depth, liquidity and
transparency in amber; and the poor hubs, which cannot yet be considered as deep, transparent or
liquid, in red.

7
    The NCG does show the OTC ‘Seasons’ category as green, as it had a rise last year in volumes of the first two seasons.
8
    The methodology used in this table is: (Volumes) Green: =/>5000; Amber: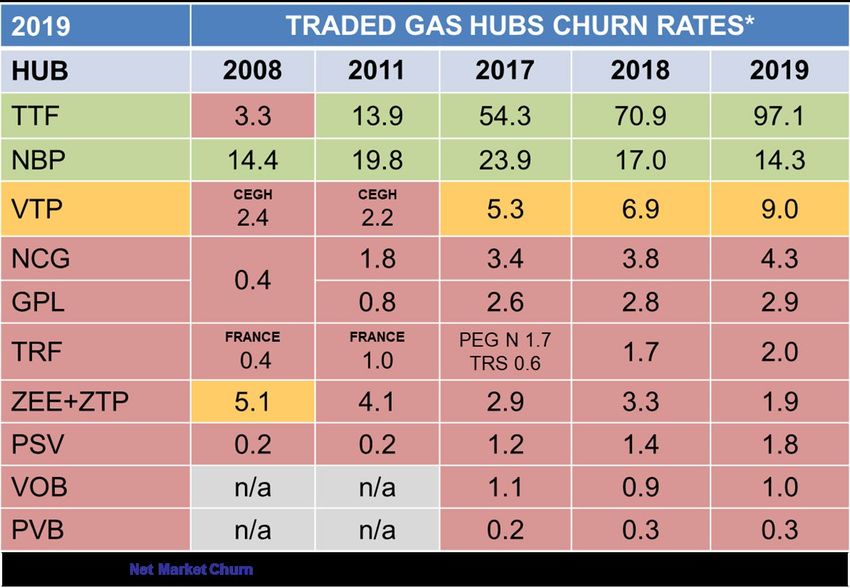
The rise in traded volumes at the TTF, and to a certain extent the decline in volumes at the NBP, is a
result of an increase in hedging and risk management trading (with some of that being transferred from
the NBP), as well as more general portfolio optimisation and speculative trading. In more recent years,
it has further benefitted from an increase in LNG cargoes being priced against TTF and the inherent
hedging and trading around those physical trades. There is a saying in trading circles that ‘trading
begets trading; that liquidity begets liquidity’. This is certainly the case for the TTF, which grew at a
moderate pace in the early part of the decade, growing more strongly from about 2014 and then, since
2017, almost doubling in size. This trend over time is clearly seen in Figure 1 below.
Another important metric is that of the traded gas hubs churn rate. 9 In this one metric all others are,
necessarily, reflected: if there are many participants, trading many different products in large quantities,
then the churn rate is likely to be high. The churn rate is used by traders as a ‘snapshot’ of a market’s
liquidity; some traders will not participate in markets with a churn of less than 10 and many financial
players will only participate when the churn is above 12. In his analyses the Author has determined that
a hub is ‘mature’ when the churn rate is 10 times or more.
Table 3 shows the hubs’ net 10 market churn rates from 2008 to 2019. As with the traded volumes table,
this clearly shows how the TTF churn rate has increased significantly and quickly in the past few years.
In 2019 the TTF net churn reached over 97 times. If, instead, the gross 11 churn is calculated, the TTF
still recorded a very high 44 times.
Table 3: Churn rates - 2019

Sources: 2008: Heather (2010), Table 6, p.19; Komlev presentation 2011; calculated from BP and IEA;
2011-2019: LEBA, ICIS, ICE, ICE-Endex, EEX, Powernext, PEGAS, CME, CEGH, GME; MIBGAS; P. Heather
There are two clear benchmark hubs today, the TTF and NBP; only the Austrian VTP is close (using
this net calculation) to the 10 times threshold for mature markets. The Belgian ZEE, plus ZTP, hubs
continue their slide to the bottom and the remaining hubs are very much struggling.

9
  For an explanation, see: Heather (July 2019), p 11.
10
   The net churn is the total traded volumes at a given hub, divided by its consumption, as defined and used by the EU.
11
   The gross churn is the total traded volumes at a given hub, divided by its physical demand or throughput.

The contents of this paper are the author’s sole responsibility. They do not necessarily represent the views of
the Oxford Institute for Energy Studies or any of its Members.                                                            5
Although the Author has been calculating and publishing the net churn rates since he started to follow
the development of the European traded gas hubs, this was because it’s been the definition used by
the European Commission and as defined in the Gas Target Model. However, in the Author’s opinion,
this calculation can be misleading as the amount of trading effected at a given hub is impacted by
various factors, most importantly the trading of actual physical gas or trading to hedge and risk manage
gas, both destined for consumption in that hub area, but also trading in relation to quantities of gas
destined for export to neighbouring market areas.
For this reason, the Author believes that using a net churn methodology can be appropriate in the early
stages of the development of a hub, as it is initially more focused on internal/national balancing
requirements; however, to judge the growing liquidity and maturity of a hub, as it trades further down
the curve and attracts risk management volumes, the gross churn methodology is more accurate as it
shows a given hub’s ability to be a pricing benchmark beyond its own market area.
If using the gross churn calculation, the TTF result is more than halved (due to the large flows of physical
gas through the hub area onto other neighbouring hubs) but, as already stated, is still a very high 44
times. The NBP result is only marginally lower as the volumes of physical gas exported are relatively
low compared to consumption and stands at 13 times. The biggest ‘loser’ in moving to a gross churn
calculation is the VTP which reduces from 9 times to just 1.7 times. The PSV remains at 1.8 times and
the PVB at 0.3 times but all the other hubs show a lower result. 12
Whichever churn calculation is used, net or gross, TTF is clearly deemed to be a mature hub; indeed,
the real proof that it is now the European benchmark hub is that its churn rate, calculated against the
physical consumption in BeNeLux, FR, DE, AT and CZ 13 is a very respectable 17.9 times - truly a
mature benchmark hub.

4. The decline of NBP
The British NBP reached maturity within just 5 years 14 and was the model upon which the EU based its
vision to transform the European gas market into a single liberalised market. 15 There were already
many varied market participants by the late 1990s, the ICE futures market had over 10% market share
and the churn rate reached a high of 21 times in 2001. Although the traded gas market suffered after
the collapse of Enron and TXU Europe, the churn rate remained above 10 times 16 throughout the
2000’s. The market grew again in the early 2010’s, reaching its all-time peak in 2017, when total traded
volumes stood at 20970TWh and the net churn was 23.9 times.
Figure 1 shows the traded volume development for all the main hubs from 2014 to 2019. The TTF and
NBP lines represent those hubs’ total volumes divided by five in order to scale better on the chart. The
NBP, having had its best volume years and remaining fairly steady from 2014 until 2017, started to fall
away rapidly from Q1-2018, as can be seen in the Figure.
One of the main reasons for this decline, and that of the Belgian ZEE also, is that they are priced in
pence/therm and Continental European traders would prefer to hedge and risk manage in contracts
priced in euros/MWh. Whilst there wasn’t a viable, liquid, euro denominated contract to trade, they
‘made do’ with the liquid, mature, Sterling NBP market. The ZEE market has always been predominantly
traded on spreads against NBP so that the decline of NBP had an immediate and noticeable impact on
the volumes traded at ZEE. Now that TTF has grown to be a mature market, even more liquid than
NBP, much of that hedging and risk management trading has moved away from NBP to the benefit of
TTF.

12
   NCG 2.5; GPL 1.7; TRF 1.6; ZEE+ZTP 0.8; VOB 0.3.
13
   These countries represent the TTF’s close ‘sphere of influence’, although it is also used as a market reference price further
afield, such as in Italy and Spain.
14
   For a full account of the gas market liberalisation in Great Britain, see: Heather (2010).
15
   For an account of the process of transformation in Europe, see: Heather (2012), pp.22-25.
16
   With the exception of 2005, when it was 9.3 times; see: Heather (2010), Table 6, p.19.

The contents of this paper are the author’s sole responsibility. They do not necessarily represent the views of
the Oxford Institute for Energy Studies or any of its Members.                                                                 6
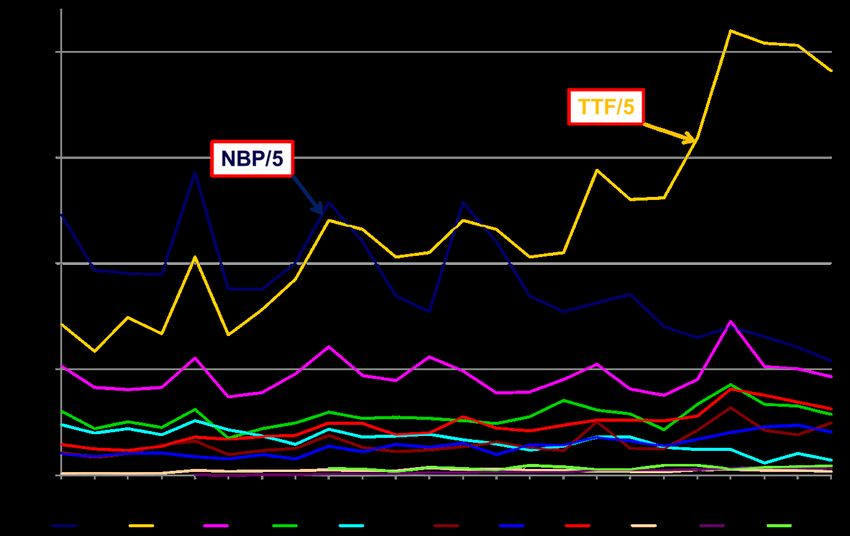
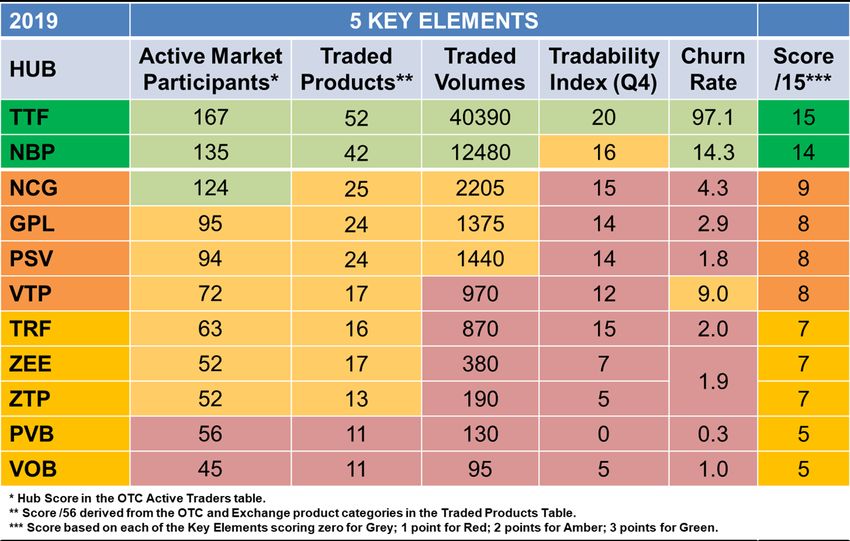
However NBP does remain, for the time being at least, a mature market serving as a pricing hub for the
British Isles and some LNG cargoes landing in Britain.
Figure 1: Traded volume development: 2014–2019

Sources: LEBA; ICIS; ICE ; ICE-Endex ; EEX ; Powernext ; PEGAS; CEGH ; GME; CME; MIBGAS; TGE; P.
Heather

Of the other top tier hubs, the Italian PSV is probably the 'best performer' in terms of traded volumes,
having steadily risen up the rankings since 2014 and now being in 4th place, marginally ahead of the
German Gaspool. Most of the other hubs are only very slowly progressing.

5. A summary of the main traded gas hubs in 2019
Table 4 shows the summary of the 5 Key Elements in 2019 which is used to rank the 11 main traded
gas hubs in Europe. The positions of TTF and NBP have been described above. The combination of
each of the Key Elements and their respective scores are what determine the overall rankings of the
hubs, as can be easily observed by the colour coding, used in the table and in the map.
TTF and NBP are still the only two mature hubs, scoring a maximum 15 and 14 respectively.
Interestingly for the hub that ‘led the way’ in terms of market liberalization, copied to a large extent by
Continental Europe, NBP is now becoming more focused once more on the spot/prompt balancing
needs and on the front months and seasons contracts for hedging purposes, with much less interest
than in previous years on contracts further forward. This has led to there being slightly wider bid/offer
spreads in the mid to far curve products, which in turn has meant that the Tradability Index score has
dropped from a maximum of 20 to 16; it is this that has lost NBP its maximum hub score.
There is then a gap to the next tier of hubs, only just classified as active and scoring 8-9. The two
German hubs have performed rather disappointingly, remaining fairly static over the past 5 years or so.
The ‘new entrant’ last year in this category was the Italian PSV and, in 2019, it consolidated that position
with both higher traded volumes and churn rate. Finally in the active category of hubs is the Austrian
VTP. It is placed here mainly due to having a good net churn rate of 9 times but, as explained at the
end of chapter 3 above, its gross churn rate would only be 1.7, reducing its ranking.

The contents of this paper are the author’s sole responsibility. They do not necessarily represent the views of
the Oxford Institute for Energy Studies or any of its Members.                                                    7
Table 4: Summary of the 5 Key Elements - 2019

The decline of the Belgian ZEE hub is described above (it actually peaked in 2011) and despite the
virtual ZTP hub, which became operational in 2012, helping to sustain the Belgian traded volumes a
little, the two hubs are now ranked 8th and 9th respectively, versus ZEE still being ranked 5th in 2015.
The French hubs were consolidated into one Trading Region (TRF) at the end of 2018 but that has not
had the result of creating the much greater liquidity that had been anticipated; indeed, the French traded
gas market has been very slow to develop and hasn’t even doubled its total traded volumes from 2013 17
to 2019, while the net churn is still at a very low 2 times.
The Spanish PVB is developing quite well since its inception and is now just above the Czech VOB,
despite having the same score.

6. Where does this leave the remaining European traded gas hubs?
The remaining 8 hubs shown as operational but ‘inactive’ on Map 1 are still struggling to develop; they
were described in detail in Heather (2019). 18 Despite most of these hubs being established for 5-15
years, they simply have not ‘got off the ground’
Table 5 shows the position of six of them in 2019 for comparison: the Polish VPGS traded marginally
more year-on-year but the volumes were all on the exchange with no recorded OTC trades at all; the
Danish hubs, GTF/ETF, recorded slightly higher overall volumes coming mainly from the OTC market;
the Hungarian MGP hub saw a five-fold increase in traded volumes, 19 mainly in exchange trading; the
Slovak SVOB hub had a nearly three-fold increase, all in OTC trading only; the Greek (HTP) and Turkish
(UDN) hubs barely traded. The two Irish hubs (IBP and NIBP) traded very limited volumes, all balancing
trades.

17
   The PEGs combined traded a total of 485TWh in 2013.
18
   See: Heather (July 2019), pp.18-22.
19
   Please note that due to a transcription error, Heather (July 2019), Table 7, p.18, shows MGP OTC volumes in MWh; the
correct total for MGP trading in 2018 should read 6.89TWh.

The contents of this paper are the author’s sole responsibility. They do not necessarily represent the views of
the Oxford Institute for Energy Studies or any of its Members.                                                            8
Table 5: Traded volumes: emerging hubs - 2019

Sources: ICIS, PEGAS, TGE, CEEGEX, HUDEX, company websites; P. Heather

6. What are the global pricing benchmarks for gas?
The Author developed a methodology in early 2019 to try and determine the relative churn rates of the
global pricing benchmarks in gas. The chosen contracts were the US Henry Hub (HH), the Dutch TTF,
the British NBP and the Platts JKM. 20 The initial results were published in the Quarterly Gas Review 21
and set out to show the relative liquidity of those chosen benchmarks.
There will always be debate as to which contracts should be used as the numerator and what scope of
data to use as the denominator in the churn calculation. The Author deemed it appropriate to use solely
the HH as the pricing benchmark for the United States, the TTF as the pricing benchmark for North-
West Europe and the JKM for Asian LNG. For this present analysis, he has added the NBP as the
pricing benchmark for the British Isles.
Henry Hub has become the pricing benchmark in North America, with most of the other 32 Market
Centers (or hubs) being priced by differential against it; there are certainly some other hubs that trade
in quantity but generally speaking it is only the HH that is used as the reference price. HH is also used
to price some LNG cargoes destined for South America, Asia and Europe. For the purposes of this
analysis the relevant physical volumes used was US consumption.
TTF has become the pricing benchmark for North-West Europe (excluding the British Isles), although
several other countries across Europe will also use TTF to price contracts/tariffs. TTF is also used to
price some LNG cargoes destined for Europe. For the purposes of this analysis the relevant sphere of
influence for the physical volumes used was the gas consumption in BeNeLux, France, Germany,
Austria and the Czech Republic.
Although not strictly speaking a ‘hub’, the JKM has become the pricing benchmark for LNG cargoes
delivered into Asia, although it has also been used to price LNG cargoes to other parts of the world. For
the purposes of this analysis the relevant physical volumes used were the LNG imports into China,
Japan, South Korea and Taiwan. 22
NBP has been a (North-West) European benchmark hub for over a decade but has lost that mantle to
TTF which, as explained in Chapter 4 above, is mainly due to the different currency. However, it remains
the pricing benchmark for the British Isles and is also used to price some LNG cargoes destined for
Europe.

20
   S&P Platts Global Japan Korea Marker.
21
   See: Heather/Bros (2019), pp.9-11.
22
   As published by JODI: JODI Gas World: http://www.jodidb.org/ReportFolders/reportFolders.aspx

The contents of this paper are the author’s sole responsibility. They do not necessarily represent the views of
the Oxford Institute for Energy Studies or any of its Members.                                                    9
Table 6 shows the results of this global comparison and uses a similar colour coding to the Author’s
European hubs analyses; it shows which benchmarks are illiquid, mature, liquid and very liquid. The
methodology 23 has been slightly refined from last year’s, to allow for the extra categories and to bring
it into line with the European hubs’ methodology;
Table 6: Global Gas Hubs Churn Ratios - 2019

Sources: JODI, Platts, CME, LEBA, ICIS, ICE, ICE-Endex, PEGAS; P. Heather
The results clearly show that HH is the premier global gas benchmark with an impressive churn of over
45 times; there is no doubt that this is a very mature and very liquid gas pricing benchmark.
TTF, when compared to its main sphere of influence, has a very respectable churn of 17.9 times; there
is no doubt that this is a mature and liquid gas pricing benchmark.
NBP, when compared to the consumption across the United Kingdom and the Republic of Ireland, has
a churn of 13.4; this is still a mature gas pricing benchmark.
JKM is effectively still in its infancy as a reference price marker, as the majority of LNG imports into the
four countries making up its sphere of influence were until quite recently subject to oil price formation.
It is only as the long term contracts became increasingly out-of-the-money that a greater volume of spot
cargoes have been trading. These have invariably been priced using the JKM price marker or even
traded as cargoes on the Platts MOC 24 platform. Nevertheless, there is no doubt that this marker price
is gaining support from the LNG industry, with producers, aggregators and buyers using it more each
year.

7. Conclusion
Previous publications by this Author have followed and analysed the development of the European
traded gas hubs. They have shown how the once dominant NBP has started to lose its crown, only to
be superseded by the TTF.

23
   Dark Green/Very Liquid:=/>40; Mid Green/Liquid:15
This Comment has shown how NBP is still a mature and quite liquid gas hub, with many different
participants, but the range of traded products is narrowing and the traded volumes have taken a tumble
since 2017; however, it is clearly still the reference pricing hub for Great Britain, Northern Ireland and
the Republic of Ireland and some LNG cargoes into Europe.
The Belgian hubs, especially the Sterling priced ZEE, have struggled in a competitive market and are
rapidly losing ground in the European rankings, while the German hubs have shown very slow progress
over the decade, especially considering the size of their physical market. Despite a reasonable increase
in 2019, their combined traded volumes were still three and a half times less than those at the NBP.
The French TRF has followed a similar trajectory and again, despite a reasonable increase in traded
volumes in 2019, they are only slightly more than a quarter of those of Germany; TRF is still classified
as a ‘poor’ hub.
On a positive note, the Italian PSV is continuing the strong growth trend started in 2014, albeit from a
low base, and now is ranked equal 4th alongside the German GPL. It is the hub currently showing the
most promise for further development 25 and could in time become the reference hub for southern
Europe. The emerging hubs are serving a purpose to facilitate balancing in their respective countries
but still have very far to go on the path to maturity. 26
The main message though in this Comment is that TTF has seen phenomenal growth in the last three
years, in every metric: TTF is the European hub that has the greatest number of market participants,
trading the widest range of products over the entire curve. It traded by far the largest volumes of all the
hubs in all the product categories and has by far the highest churn rate.
At a global level, TTF and NBP are important benchmarks in their own market areas but they are also
benchmark hubs for their regions and for the pricing of LNG cargoes.
The final conclusion has to be that, in 2019, TTF is now quite simply the supreme traded gas hub in
Europe as well as a global price reference.

25
     See: Heather (March 2019), pp.27-29.
26
     For a full explanation of the path to maturity, see: Heather (2015), Chapter 3.2, pp.6-8.

The contents of this paper are the author’s sole responsibility. They do not necessarily represent the views of
the Oxford Institute for Energy Studies or any of its Members.                                                    11
Bibliography Heather (2010): Heather, Patrick: The Evolution and Functioning of the Traded Gas Market in Britain"; OIES Paper NG44, August 2015: https://doi.org/10.26889/9781907555152 Heather (2012): Heather, Patrick: "Continental European Gas Hubs: are they fit for purpose?"; OIES Paper NG63, June 2012: https://doi.org/10.26889/9781907555510 Heather (2015): Heather, Patrick: “The evolution of European traded gas hubs”; OIES Paper NG104, December 2015: https://doi.org/10.26889/9781784670467 Heather (March 2019): Heather, Patrick: “’A Hub for Europe’: the Iberian promise?”; OIES Paper NG143, March 2019: https://doi.org/10.26889/9781784671327 Heather (July 2019): Heather, Patrick: “European traded gas hubs: a decade of change”; OIES Insight OEI55, July 2019: https://www.oxfordenergy.org/wpcms/wp- content/uploads/2019/07/European-traded-gas-hubs-a-decade-of-change-Insight-55.pdf Heather/Bros (2019): Heather, Patrick and Bros, Thierry: “Quarterly Gas Review 5”: March 2019: https://www.oxfordenergy.org/publications/quarterly-gas-review-issue-5/?v=79cba1185463 The contents of this paper are the author’s sole responsibility. They do not necessarily represent the views of the Oxford Institute for Energy Studies or any of its Members. 12
You can also read