The Hydrogen Analysis of Solid Samples
←
→
Page content transcription
If your browser does not render page correctly, please read the page content below
Carbon/Sulfur, Oxygen/Nitrogen & Hydrogen Analyzer

                                                                               TECHNICAL NOTE 27

The Hydrogen Analysis of Solid Samples
Morinobu Hayashi
Horiba Ltd, Japan

Keywords: hydrogen analysis, solid sample

Abstract                                            order to analyze temperature increase suited to
                                                    the development of various materials. In this
Each year the marketplace sees increasing           paper, we report the basic principle of measure-
demands for the analysis of hydrogen contained      ment, characteristics, and analytical accuracy of
in various sample materials. It is now recognized   this analyzer, an example of analysis of an actu-
that hydrogen analysis is crucial not only in the   al sample using the temperature increase analy-
steel industry but also in the manufacture of       sis function, and the reaction of hydrogen with a
such high purity metals as aluminum, copper,        graphite crucible or Sn flux, as well as the getter
titanium and in the development of new alloys       effect.
and new materials. To meet these demands,
Horiba has developed and marketed two models        2 Properties of Hydrogen in Metal
of a new type of hydrogen analyzer with a flexi-
ble power control function, the EMGA-521 and        Hydrogen in metal samples demonstrates the fol-
the EMGA-621.                                       lowing typical behaviours:

This report discusses the design and principle of   z It easily diffuses even at low temper
measurement of the new hydrogen analyzer,           atures,
using data from actual measurements. Also intro-    z It causes grain boundary corrosion,
duced here is the behavior of the hydrogen con-     z It causes brittle rupture, and
tent of the sample when the flexible power con-     z It causes the properties of non-ferrous
trol function of the analyzer is used and the       metals to deteriorate.
importance of sample pre-treatment in hydrogen
analysis.                                           Though all of these behaviours adverslely effect
                                                    the properties of materials, there have been
1 Introduction                                      reports recently to the effect that increasing the
                                                    content of hydrogen in ceramic or superconduc-
Marketplace needs for analyzing hydrogen in         tive materials alternatively improves their proper-
solid samples are increasing year by year. It       ties. Subsequently, the importance of hydrogen is
would be no exaggeration to say that the atten-     being reviewed.
tion is being focused on hydrogen (H) atomic
number 1 in almost all solid samples from ferrous   The generation of hydrogen from materials can
metals, non-ferrous metals, ceramic materials,      be broken down into three diffuse forms
and superconductive materials. Horiba has devel-
oped the EMGA-521/621 hydrogen analyzer in          1) Generation during cooling to room tempera-
solid samples that incorporates a temperature       ture from the melt phase: diffuse hydrogen,
increase analysis function for not only analyzing   2) Generation in a solid state until it reaches
the total hydrogen content in materials but also    solidus line from room temperature: diffuse
for learning more about the behavior of hydrogen.   hydrogen, and
                                                    3) Generation after melting: residual hydrogen.
Besides analyzing the total hydrogen content,       Of these three forms of hydrogen, the EMGA-
two new mechanisms, a column bypass mecha-          521/621 can measure (2) diffuse hydrogen and
nism and a coexisting gas compensation mecha-       (3) residual hydrogen.
nism have been incorporated in this analyzer in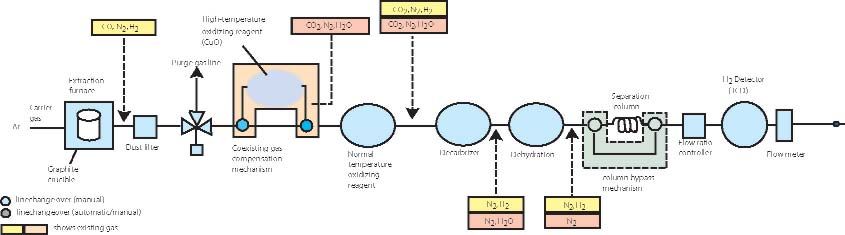
Carbon/Sulfur, Oxygen/Nitrogen & Hydrogen Analyzer
TECHNICAL NOTE 27
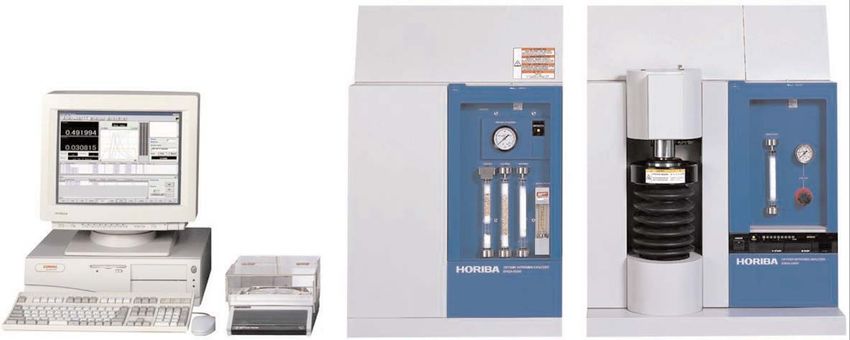
3 Principles of Measurement hydrogen gas (H2) and nitrogen gas (N2), and are
carried together with the inert gas (carrier gas).
This analyzer uses inert gas fusion in impulse fur- On the other hand, as thermal conductivity detec-
nace-column separation-thermal conductivity tors detect the specific heat of gas, there is no gas
detection that conforms to JIS Z 2614. Current selectivity. For this reason, after oxidization to car-
flowing in a graphite crucible causes Joule heat bon dioxide (CO2) by a gas selective oxidant, CO is
(Q=12R) to be generated, and this heat causes the adsorbed in a decarburizer, and water content is
sample to be heated and fused in inert gas (in this adsorbed by a dehydrator. The resulting hydrogen
example argon (Ar) was used). and nitrogen are separated in a separation column,
and measured at a thermal conductivity detector.
The oxide in the sample reacts with the graphite
crucible, and is extracted as carbon monoxide (CO), Figure 1 shows an overview of the analyzer. Figure
and the hydrogen and nitrogen are extracted as 2 shows the gas flow. Table 1 shows the main spec-
ifications.
Figure 1: Model EMGA-621 hydrogen analyzer for analysis of hydrogenconcentration in solids
Figure 2: Gas flow in the EMGA-621 2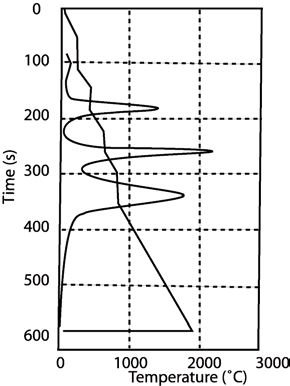
Carbon/Sulfur, Oxygen/Nitrogen & Hydrogen Analyzer

                                                                                              TECHNICAL NOTE 27

Table 1: EMGA-521 and EMGA-621 Specifications

Product Name                   Hydrogen analyzer
Model                          EMGA 521/621
Principle                      Inert gas fusion in impulse furnace-column separation-thermal conductivity
                               detection
Applications                   Hydrogen in ferrous and non ferrous metals, semiconductors and electron-
                               ic materials
Range                          O to 0.02wt% (O to 200wtppm)
                               Range may be expanded to O to 100% -by reducing the sample amount.
Sensitivity (minimum           0.000001wt%. (0.01wtppm)
reading)                       Select either wt% or W\ppm at installation.
Accuracy (repeatability)       sn-1 = O.04wtppm or CV=1 % whichever is larger
                               wit hydrogen reference gas
Sample Required                1,0g for regular analysis (for ferrous metals)
Weight Compensation            0.00001 to 99.999999 g
Input Range                    Automatic input from optional electronic balance or manual input
Analysis time                  About 100 sec from gas extraction to measurement
Display Devices                1) Analysis results: CRT and printer, (2) Message: CRT (3) Preset condi-
                               tions: CRT and printer
Analysis Conditions            1) Extraction conditions:
                               Furnace control: Electrical power control
                               Wattage setting
                               Temperature setting
                               2) Integration conditions:
                               Preset time integration or integration up to reach comparator level,
                               whichever is shorter
                               (3) Graphite crucible
                               Large or small one can be used
Calibration                    ( 1 ) I .point or multi-point calibration using standard sample or gas, (2)
                               Approximation by least squares method, (3) Gas calibration function, (4)
                               Calibration mode compensation function, (5) Calibration mode memory
                               (manual input, 5 calibration modes), (6) Calibration data, discard function,
                               (7) Measurement data copy function, (8) Graphic output of calibration
                               results function
Data Storage                   Pre-programmed sample data up to 100
                               Analysis results up 10 100

4. Description of Main Features                         amount of adsorption is a function for temperature
                                                        only. Also, as adsorption is accompanied by heat
                                                        generation at all times, the separation capability
4.1 Hydrogen/Nitrogen Separation Column                 improves as the temperature becomes lower. Figure
                                                        3 shows the relationship between column tempera-
The hydrogen/nitrogen separation column used on         ture and the separation capability. From this figure, it
this analyzer is filled with synthetic zeolite.         can be seen that the separation capability of the col-
Generally, the separation capability increases as the   umn improves as the temperature becomes lower. At
particle diameter of the filler decreases, however      this analyzer, an electronic cooler is used to maintain
pressure increases. The amount of adsorption (V) of     the column temperature at about 20°C. This
the filler is expressed as V=f(P,T) where T is tem-     reduces pressure loss, and moreover improves the
perature and P is gas concentration (partial pres-      separation capability for nitrogen.                        3
sure). When gas concentration is constant, the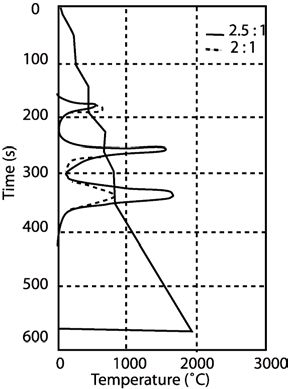
Carbon/Sulfur, Oxygen/Nitrogen & Hydrogen Analyzer

                                                                                              TECHNICAL NOTE 27

                                                        hydrogen) by the flux. Table 2 shows the measure-
                                                        ment results. Though the getter effect caused by
                                                        generation of CH4 and flux is recognized slightly, if
                                                        we assume that a sample which contains 1 ppm
                                                        concentration hydrogen was analyzed, it can then
                                                        be judged that the influence would be equivalent to
                                                        about 0.001 ppm and is within a range that can be
                                                        ignored in practice.

                                                        Table 2: Effects on measurements using graphite
                                                        crucible and Sn flux

                                                        Measurement conditions
                                                        Crucible        Room temp.    2000 °C        2000°C
                                                        temp
                                                        Sn flux         Without       With           With
                                                        Measured result
                                                        Mean value      159.9         157.9          159.0
Figure 3: Column temperature vs. N2/H2 separa-
                                                        (ppm)
tion column                                             Standard        0.099         0.057          0.141
                                                        deviation (ppm)
4.2 Carrier Gas                                         Repeatability 0.062           0.036          0.088
                                                        (%)
Argon (Ar) is used as the carrier gas for this ana-
lyzer. Nitrogen gas is considered to be ideal as a
carrier gas for eliminating the effect of nitrogen      5 Temperature Increase Analysis
contained in a sample. Also, there is no need to sep-
arate capability gases in a column. However, when
                                                        Function
heating and out-gassing graphite crucibles in nitro-    An optional temperature increase analysis function
gen gas at high temperatures in excess of 3,000°C       is available in order to find out more about the
for the analysis of high melting point materials, the   behavior of hydrogen. The temperature increase
hydrogen gas that is generated from the graphite        analysis function is a function for gradually increas-
crucible reacts with nitrogen, the carrier gas          ing the power applied to the graphite crucible to
Ammonia (NH4) and hydrogen cyanide (HCN) are            slow its temperature.
generated. HCN is extremely poisonous for the
human body. This is the reason why Ar is used           The temperature increase analysis function enables
instead of N2.                                          hydrogen of differing extraction to be classified and
                                                        quantified. The analyzer is also provided with a
                                                        hold function for holding the extraction temperature
4.3 Graphite Crucible
                                                        when the extraction peak has been detected in the
                                                        temperature increase process.
Even when Ar is used as the carrier gas, the
graphite crucible and hydrogen are considered to        There are three hold functions, which can be freely
react at about 2000°C and release methane (CH4).        selected by the operator.
The influence of CH4 was confirmed by holding           (1) Auto: Extraction peak is automatically distin-
graphite crucibles at room temperature and at           guished, and temperature is held at extraction tem-
2000°C and dosing hydrogen. Also, tin (Sn) is used      perature.
as the flux for lowering the melting point of the       (2) Manual: The operator judges the extraction
sample, reducing the generation of hydrogen and         peak, and the temperature is held at the desired
reducing corrosion of the sample on the crucible.       temperature.                                             4
We also confirmed the getter effect (adsorption of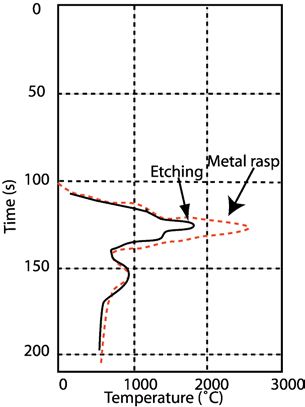
Carbon/Sulfur, Oxygen/Nitrogen & Hydrogen Analyzer

                                                                                               TECHNICAL NOTE 27

(3) Memory: Hold conditions are stored to memory,          reagent, is oxidized and converted to water, and
and extraction is carried out at the same tempera-         adsorbed by the dehydrator.
ture increase conditions.
                                                           During temperature increase analysis, all extracted
The following two new technologies have been               gases are measured via the regular gas flow, the
developed in order to effectively demonstrate this         high-temperature oxidizing reagent flow is then
temperature increase analysis function.                    switched to where hydrogen is removed, and the
                                                           resulting extracted gases are measured. The tem-
5.1 Column-bypass Mechanism                                perature increase data of hydrogen can be obtained
                                                           by subtracting these two measurement results.
The column-bypass mechanism has been developed
                                                           Figure 4 shows the results of analyzing a steel sam-
to shorten the extraction gas time lag, which is a         ple.
problem during temperature increase analysis.
During fixed temperature analysis, the extraction
peaks of hydrogen and nitrogen are extracted via an
H2/N2 separation column. However, during temper-
ature increase analysis, if hydrogen and nitrogen are
passed through a column, they will be continuous-
ly separated, and gas generated at the initial stages
of temperature increase will mix with gas generat-
ed in the latter stages thus making it difficult to dis-
tinguish their extraction peaks. For this reason, we
linked the entrance and exit of the column so that
extracted gas could be directly introduced to a ther-
mal conductivity detector during temperature
increase analysis. This is the column- bypass mech-
anism.
                                                           (a) Heating by the column bypass method
Though this mechanism operates automatically dur-
ing temperature increase analysis, it is also provid-
ed with a switch to set the bypass to manual. This
function can also be used to measure samples
whose hydrogen content is very low, such as cop-
per, in which there is no need to separate H2 and
N2 with a separation column.

5.2 Coexisting-gas Compensation
Mechanism

During temperature increases such as mentioned
above, all gas components extracted from the sam-
ple must be measured separately from gas compo-
nents other than hydrogen as the column-bypass
mechanism is used. The “coexisting-gas compensa-
tion mechanism” was developed for this purpose.            (b) Heating by parallel use of both the column
                                                           bypass method and the coexisting gas compensa-
In a regular gas flow, CO is selectively oxidized to       tion method.
CO2 using a room-temperature oxidizing reagent.                                                                   5
However, in the coexisting-gas compensation flow,          Figure 4(a) and (b): Procedure for analyzing tem-
                                                           perature increase
the flow is switched to the high-temperature oxi-
dizing reagent side manually by a cock. The extrac-
tion gas, flown from the high-temperature oxidizing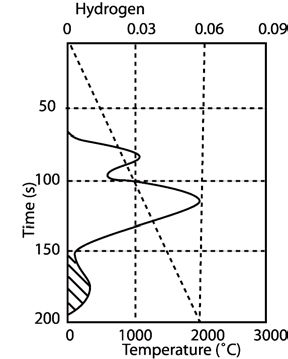
Carbon/Sulfur, Oxygen/Nitrogen & Hydrogen Analyzer

                                                                                              TECHNICAL NOTE 27

                                                         7 Handling of Samples and
                                                         Analytical Accuracy

                                                         7.1 Pre-treatment and storage atmosphere

                                                         Pre-treatment of samples is important when analyz-
                                                         ing trace amounts in samples. In particular, when
                                                         analyzing hydrogen, quite different analytical values
                                                         may be displayed depending on the surface condi-
                                                         tion of the sample. Figure 5 shows the differences
                                                         between two samples treated by two abrasing
                                                         methods: chemical etching and abrasing by a metal
                                                         rasp. The peak of the sample abrased by the rasp is
                                                         higher. From this we can suppose that the influence
                                                         of the water adsorption of sample surface is large
                                                         in the case of the sample abrased by the rasp as
(c) Results after processing the extraction profile      surface area is larger than that of the sample
                                                         abrased by the chemical etching.
Figure 4(c): Procedure for analyzing temperature
increase                                                 Table 4 shows the results of analyzing a previously
                                                         de-hydrogenized Cu sample after storing for six
6 Measurement Accuracy of                                days in seven atmospheres. It can be understood
Detection System                                         from the results that a difference occurs to the stor-
                                                         age atmosphere.
Before analyzing the actual sample we confirmed
the measurement accuracy of the detection system
in this analyzer. Hydrogen gas of a known concen-
tration was dosed and evaluated by an EMGA-621
provided with an automatic voltage regulator.
Measurement was carried out for a total of 4 times
over two days, once in the morning and once in the
afternoon, and 10 mean values (X) and the standard
deviations (sn-1) were calculated for each of the
measurements. From the results, as shown in Table
3 we can judge that there was very little fluctuation
in mean values, and that a quantitative limit (5 sn-1)
was at about 0.01 ppm

Table 3: Analytical accuracy using hydrogen gas
dosing
         1st Day    1st Day   2nd Day 2nd Day
         a.m.       p.m.      a.m.      p.m.
                                                         Figure 5: Effect of polishing method on extraction
Mean                                                     profile
value     0.941       0.941       0.938     0.944
ppm
Standard
Deviation 0.0024      0.0020      0.0012    0.0009
ppm
                                                                                                                  6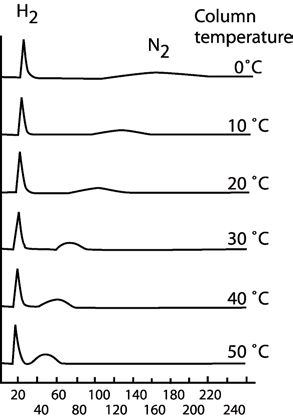
Carbon/Sulfur, Oxygen/Nitrogen & Hydrogen Analyzer

                                                                                              TECHNICAL NOTE 27

Table 4: The effect of the sample storage environ-      used for set-up in-house both of which are austen-
ment on analysis of hydrogen concentration              ite stainless steel having stable concentrations.
                                                        With JSS GS-1 c is a bar shaped sample and judged
Storage                Hydrogen
                                                        to be almost free of an oxidized layer on its surface,
atmosphere             concentration (ppm)
                                                        and was analyzed after carrying out only degreas-
Argon gas           0.000±0.002                         ing. On the other hand, the Horiba’s set-up sample
Dry air             0.005±0.006                         was thorougly abrased with the metal rasp (care
Petroleum benzine 0.008±0.003                           was taken to prevent heat being applied to the sam-
Acetic Acid         0.000±0.003                         ple) as an oxidized layer was confirmed on its sur-
Ethanol             0.008±0.004                         face and the sample was degreased.
Wet air             0.008±0.005
Water               0.011±0.018                         Bar-shaped copper (Cu) and aluminum (Al) are com-
Storage term: 6 days                                    mercial products, and have a purity of 99.9% or
                                                        more. As surface treatment, Cu was treated with
7.2 Analysis of actual sample                           acid, while Al was treated with alkali. Also, in order
                                                        to improve repeatability , it is preferable to maintain
Table 5 shows the results of confirming repeatabili-    the weights of the samples as constant as possible.
ty using various samples. Temperature JSS GS-1c
in the table is a set-up sample from the Iron and
Steel Institute of Japan for analyzing gas in steel,
and the Horiba’s set-up sample is a steel sample

Table 5: Results for various types of samples

Sample                JSS GS-1c                 Set-up                 Cu                       Al
                      (Fe)                      sample (Fe)

Measuring Condition
Sample weight       About 1.0g                  About 1.0g           About 1.4 g            About 1.0g
Pre-treatment       None                        None                 Acid cleaning          Acid cleaning
condition
Flux                Sn: 1.0g                    Sn: 1.0g             None                   None
Extraction          About 2000°C                About 2000°C         About 2000°C           About 2000°C
Temperature
Extraction          75s                         75s                  70s                    70s
time
Measured Results n=10
Mean value (ppm)    1.611                       5.611                0.241                  0.394
Standard
deviation (ppm)     0.050                       0.047                0.017                  0.028

                                                                                                                  7
Carbon/Sulfur, Oxygen/Nitrogen & Hydrogen Analyzer
TECHNICAL NOTE 27
7.3 Handling of Samples the for calcium percentage of calcium hydride has
increased.
The following points regarding the handling of sam-
ples must be taken in order to analyze hydrogen in As mentioned above, temperature increase analysis
solid samples with high accuracy. In particular, sam- is extremely important in learning about the behav-
ple pre-treatment has an important meaning for ior of hydrogen.
trace hydrogen samples.
(1) Samples must be abrased carefully so as to pre-
vent heat being applied to the sample when there is
an oxidized layer on the sample.
(2) Chemical etching must be carried out at the
same time for each sample.
(3) After pre-treating the surface, analyze the sam-
ple as quickly as possible.
(4) Water must be shut out from the storage
atmosphere.
(5) Weight must be as constant as possible.
(6) Prevent heat from being applied to the samples
when drying the samples taken from the solution.
8 Temperature Increase Analysis
Figure 6: Extraction profile for titabium hydride
This section introduces temperature increase analy-
sis, an important feature of this analyzer, using the
analysis results of an actual sample. Samples used
were titanium hydride (TiH2) and calcium hydride
(CaH2), hydrogen compounds and both commercial
products. The temperature increase conditions were
5°C/s, and the peak hold in the Auto mode was
applied.
Figure 6 shows the extraction profile of titanium
hydride. The peak hold temperatures were 600°C
and 810°C. Figure 7 shows the extraction profile of
calcium hydride, and indicates an extraction profile
different to that of titanium hydride. The peak hold
temperatures were 400°C, 700°C, and 900°C.
Figure 8 shows the extraction profile when titanium
hydride and calcium hydride were mixed at a pro-
portion of 1:2.5 and temperature increase was car-
ried out. The peak hold temperatures were 280°C,
Figure 7: Extraction profile for calcium hydride
450°C, 650°C, and 820°C.
If we compare Figures 6, 7, and 8, the peaks of
280°C, 450°C, and 820°C seem to be hydrogen
extracted from calcium hydride, and the peak of
650°C seems to be the peak from titanium hydride.
Figure 9 shows the extraction profile of the mixed
sample of titanium hydride and calcium hydride at a 8
proportion of 1:2.5, in which an increased ratio of
calcium hydride is mixed with titanium hydride,
overlaid with the extraction profile of Figure 8. It
apperas that the peak of 820°C has increased asCarbon/Sulfur, Oxygen/Nitrogen & Hydrogen Analyzer
TECHNICAL NOTE 27
9 Conclusion
The removal of absorption on the sample surface is
very important for analyzing hydrogen in solid sam-
ples with high accuracy. Stable data can be
obtained by reliably pre-treating samples. Also,
adding a temperature increase analysis function
allows the thermal behavior of hydrogen to be
revealed with ease. We consider that the need for
hydrogen analysis will increase even more in the
future accompanying the development of new
materials, so we expect that the temperature
increase analysis function of this analyzer will be
very useful. A future theme is the analysis of trace
hydrogen (0.1 ppm or less) in light alloys (in partic-
ular, AI).
Figure 8: Extraction of profile for a 1:2 amalgam
of titanium hydride and calcium hydride
Reference
1) Kurima Kobayashi, Takahiko lriyama, Nobuyoshi
Imaoka and Takao Fukuda:
HydrogensignaJ 3.0000 Rare Earth. No.19, 31-43
(1991)
2)Tominaga Keii “Kyuchaku” (Kyoritsu Shuppan
Tokyo)26-32 (1970)
3) Tsugio Kojima, Naofumi Oi and Fujio Morishita:
“Gasukuromatogurafu ho”
(Kyoritsu Shuppan, Tokyo. 36-39 (1985)
4) Masaaki Yokoyama et al.: Tokyo Conference on
Analytical Instrumentation,
presentation subject. 53-54 (1991)
Figure 9: Extraction profiles for two different
amalgams of titanium hydride and calcium hydride
In the USA: In France: In Japan:
Jobin Yvon Inc. Jobin Yvon S.A.S. Horiba Ltd.
3880 Park Avenue 16-18, rue du Canal 2 Miyanohigashi, Kisshoin
Edison, NJ 08820 91165 Longjumeau Cedex Minami-ku, Kyoto 601-8510
Tel: 1-732-494-8660 Tel: (33) 1/64 54 13 00 TEL: (81) 75 313 8121 9
Fax: 1-732-494-8796 Fax: (33) 1/69 09 90 88 FAX: (81) 75 321 5725
E-mail: info@jobinyvon.com www.horiba.com
Germany: (49) 89/46 23 17-0 China: (86) 10/6836 6542
Italy: (39) 2/57 60 56 90 Spain: (34) 91/724 16 57
U.K.: (44) 20/82 04 81 42 Other Countries: Contact JY
1-866-JobinYvon S.A.S.
www.jobinyvon.comYou can also read