Grocery price benchmarking - Woolworths New Zealand Limited 4 February 2021 Project team: Commerce Commission
←
→
Page content transcription
If your browser does not render page correctly, please read the page content below
Grocery price benchmarking
Woolworths New Zealand Limited
4 February 2021

Project team:

James Mellsop

Will Taylor

Barbara Kaleff

Kate Eyre
CONFIDENTIALITY
Our clients’ industries are extremely competitive, and the maintenance of confidentiality with respect
to our clients’ plans and data is critical. NERA Economic Consulting rigorously applies internal
confidentiality practices to protect the confidentiality of all client information.

Similarly, our industry is very competitive. We view our approaches and insights as proprietary and
therefore look to our clients to protect our interests in our proposals, presentations, methodologies,
and analytical techniques. Under no circumstances should this material be shared with any third party
without the prior written consent of NERA Economic Consulting.

© NERA Economic Consulting

© NERA Economic Consulting
Contents

Contents
1.         Introduction ................................................................................................ 1

2.         Data source ................................................................................................. 1

3.         Conversion to a common currency .......................................................... 2

4.         Comparability ............................................................................................. 2

5.         Results ........................................................................................................ 3
5.1.       Base case ................................................................................................................ 3
5.2.       Sensitivity testing ..................................................................................................... 8

Appendix A.             Products included in analyses ................................................... 11

© NERA Economic Consulting
Introduction

1.            Introduction
1. We have been asked by Woolworths New Zealand Limited ("WWNZ") to compare grocery prices
   in New Zealand to those in comparator countries.
2. This type of international benchmarking is difficult for a variety of reasons, including:
       A. The prices are surveyed in different currencies;
       B. Consumers have different incomes, buying habits and preferences in different countries;
       C. Product “quality” and other product characteristics may vary across countries; and
       D. Taxes and other government interventions might affect prices differentially across countries.
3. However, there are sources of data and techniques that can be used to benchmark prices, if
   implemented and interpreted carefully (although multiple different factors, such as those outlined
   above, mean that benchmarking of prices does not necessarily enable any comparisons or
   conclusions to be drawn in relation to the extent of competition).
4. Sections 2 through 4 describe our methodology for this analysis, while Section 5 sets out our
   results. More technical details on methodology are included in footnotes.

2.            Data source
5. The Economist Intelligence Unit (“EIU”) surveys the price of certain grocery products twice per
   year across numerous cities for its CityData tool. NERA has subscribed to the EIU’s CityData
   database. A condition of this subscription is inclusion of the following EIU disclaimer:
       All information contained herein is provided for reference only, and is not intended to provide professional
       advice and shall not be relied upon in that regard. The Economist Intelligence Unit, NA, Inc. and its
       affiliates do not make any warranty or representation as to the accuracy, completeness or reliability of any
       of the information contained herein.

6. The EIU data covers grocery products in 140 cities. For our analysis, we have excluded cities in
   non-OECD countries, which leaves us with 67 cities. 1
7. The EIU data covers 89 products from what it categorises as “supermarkets” (being
   “supermarkets or equivalent high-volume outlets”) and “mid-priced stores” (being “mid-priced
   stores or equivalent middle-market retail outlets”). However, not all of these products are
   common across all OECD city-years. We limit our analysis to products common across the cities
   we analyse in the year we analyse them, as we describe in more detail below.
8. We initially focussed our analysis on the “supermarket” category. However, in response to a set
   of clarifying questions, we were informed by the EIU representative on 3 February 2021 that:
       A. PAK'nSAVE stores were surveyed under the supermarket category; and
       B. Countdown, New World and Farro Fresh stores were surveyed under the mid-priced store
          category.
9. Accordingly, we have now also applied our methodology to the mid-priced store category and to a
   blend (“average”) of both categories, as we explain further below.
10. To date we have analysed the EIU data for 2019 and 2020, although we do have access to more
    historic data.

1   We note that the Commission has also used OECD countries as comparators for benchmarking exercises in the past. See,
    for example, NZCC, International Price Comparison for Retail Mobile Telecommunications Services 2013, March 2014, p
    4.

© NERA Economic Consulting                                                                                             1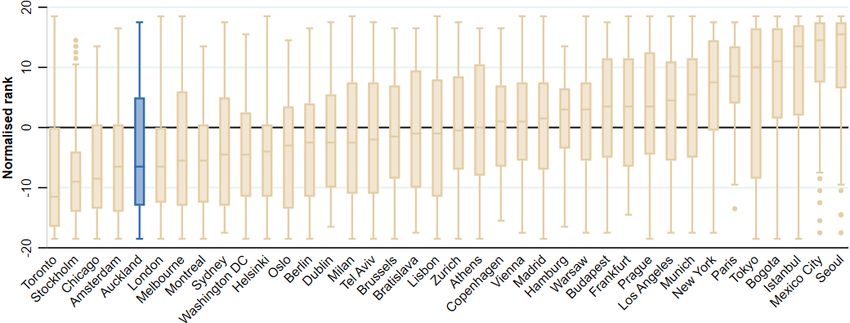
Conversion to a common currency
3. Conversion to a common currency
11. When carrying out international price benchmarking, the Commerce Commission (“NZCC”) has
converted local currency prices into a common currency using:
A. “Purchasing power parity” (“PPP”) for “non-tradable” products; and
B. A 10-year average market exchange rate for “tradable products”. 2
12. We note that Statistics NZ defines the “supermarket and grocery stores” industry as non-tradable. 3
Accordingly, we use PPP to convert all prices into international dollars. These are sourced from
the OECD. 4
4. Comparability
13. Typically for international benchmarking a specific product or basket of products is identified and
priced in each country (for example, fixed broadband or a bundle of broadband and a mobile
phone plan).
14. Because of different preferences and income, the typical consumer grocery basket is likely to vary
across countries. Even within a country, consumer heterogeneity may make it difficult to define
what is “typical”. We do not know what these typical (or other) baskets are. This raises a
material risk of the price comparison results being skewed by irrelevant prices.
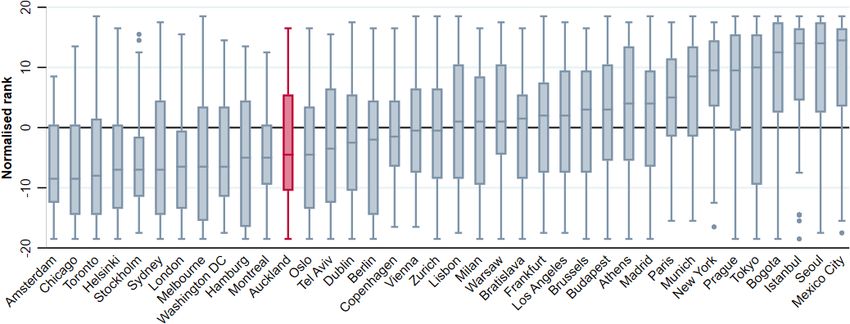
15. To manage this risk, we use a ranking mechanism. 5
A. For each product, prices are ranked by city from lowest to highest, with the median rank
normalised to zero (for example, if there are 29 cities in the dataset, they would be ranked for
the relevant product from -14 for the lowest price to 14 for the highest price). 6
i. We do this for the supermarket and mid-price store category datasets separately. For the
“average” analysis, we use an unweighted average price for each city-item between the
supermarket and mid-priced store price data.
B. We then plot the distribution of rankings across all products for each city in “box and
whisker” diagrams. 7 For example, a city that has the lowest price for every product would
always have a rank of -14, therefore resulting in a distribution of a single point at -14 on the
y-axis.
2 See, for example, NZCC, Final pricing review determination for Chorus’ unbundled copper local loop service, [2015]
NZCC 37, p 417. The NZCC has also used a blend of these rates when the relevant products consist of non-tradable and
tradable components.
3 Statistics NZ, The tradable sector and its relevance to New Zealand’s GDP, 3 July 2013, p 28.
4 We have used the most recent rate calculation available, which is for 2019. We note that the NZCC has used PPP
exchange rates from the OECD in past exercises. See, for example, NZCC, International Price Comparison for Retail
Mobile Telecommunications Services 2013, March 2014, p 3. We have applied the OECD “PPP rates for GDP” in our
figures, but note that we have also applied the “PPP for private consumption” rates as a sensitivity check and find very
similar results. Available at https://stats.oecd.org/Index.aspx?datasetcode=SNA_TABLE4, accessed 29 January 2021.
5 Our analysis was undertaken in Stata and then cross-checked in R.
6 In some instances (less than one percent of city-products in the “metro” figures only), two cities in the same country
resulted in the same product price (and therefore would tie for a rank for a given product). In these cases, we sorted the
results alphabetically such that City A would receive a rank deeming the price “lower” than City B for that product.
7 A box and whisker plot is a statistical tool that shows the distribution of data, meaning the minimum represented by the end
of one whisker (line protruding from box), 25th percentile at one end of the box, median (i.e. 50th percentile) represented by
a line in the centre, 75th percentile at the other end of the box, and maximum of the distribution at the end of the opposite
whisker. Outliers are excluded from the plot itself (determined as more than 1.5x the interquartile range, or in other words
the space between the box edges, in either direction) but instead represented by dots outside the plot.
© NERA Economic Consulting 2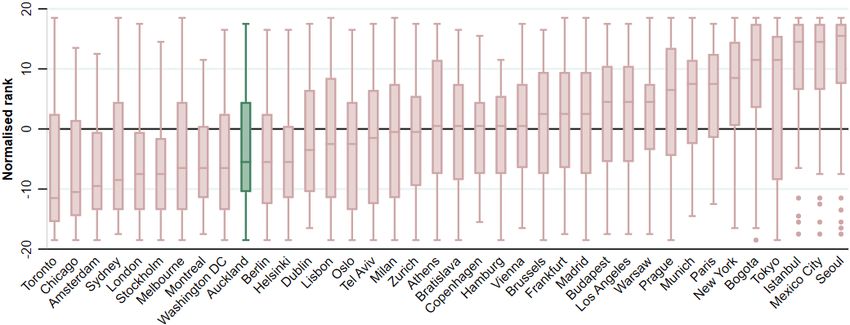
Results

     C. This ranking approach smooths extreme results stemming from large variations in prices,
        therefore mitigating our inability to control for specific consumer preferences/baskets.
     D. The rankings are not weighted in any way.
     E. From an interpretative point of view, the boxes should be seen as the central range of prices
        within the set of products for the different cities. The “boxes” are bounded by the 25th and
        75th percentiles, with the median being marked by the line within each box.

5.         Results
5.1.       Base case
16. The EIU data is divided between:
     A. Cities in respect of which the sampled prices were from a “metro” area; and
     B. Cities in respect of which the sampled prices were from a “non-metro” area.
17. Even though we have sought clarification from the EIU, the precise metro/non-metro delineation
    remains unclear to us.
18. Accordingly, we have analysed the metro and non-metro datasets separately. The number of
    products common across all cities within each segment are:
     A. 62 products for the 38 metro cities; and
     B. 69 products for the 29 non-metro cities.
19. We list these products in the appendix to this report and the results in the following box and
    whisker figures.

© NERA Economic Consulting                                                                                3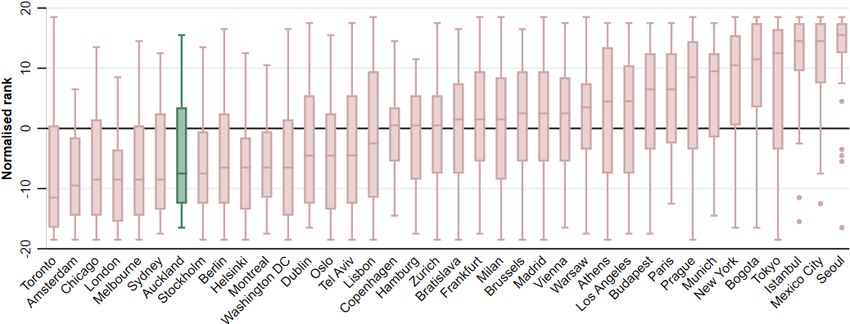
Results
Figure 5.1
Distribution of supermarket product price ranks in PPP for available OECD cities 8
By cities with prices collected in the metro area, 2020
Source: NERA analysis of EIU CityData.
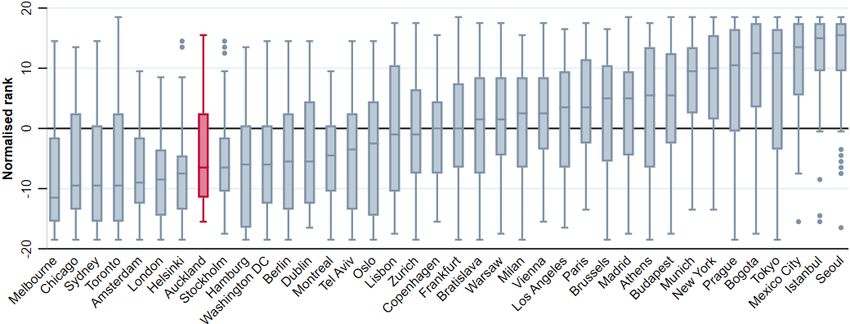
Figure 5.2
Distribution of mid-price store product price ranks in PPP for available OECD cities8
By cities with prices collected in the metro area, 2020
Source: NERA analysis of EIU CityData.
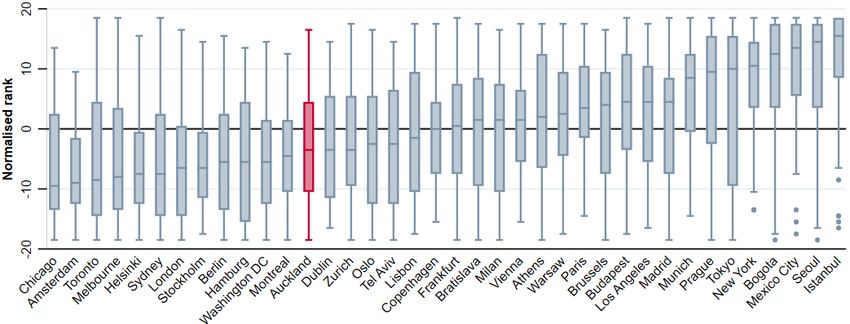
Figure 5.3
Distribution of average product price ranks in PPP for available OECD cities8
By cities with prices collected in the metro area, 2020
Source: NERA analysis of EIU CityData.
8 EIU Disclaimer: All information contained herein is provided for reference only, and is not intended to provide
professional advice and shall not be relied upon in that regard. The Economist Intelligence Unit, NA, Inc. and its affiliates
do not make any warranty or representation as to the accuracy, completeness or reliability of any of the information
contained herein.
© NERA Economic Consulting 4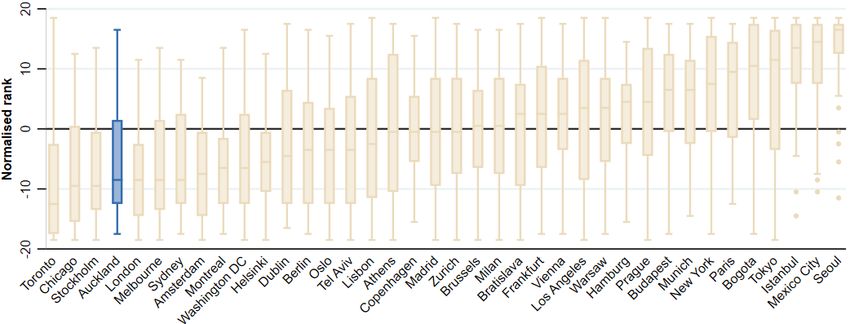
Results

                                                          Figure 5.4
           Distribution of supermarket product price ranks in PPP for available OECD cities 9
                       By cities with prices collected in the non-metro area, 2020

Source: NERA analysis of EIU CityData.
                                                          Figure 5.5
         Distribution of mid-price store product price ranks in PPP for available OECD cities9
                      By cities with prices collected in the non-metro area, 2020

Source: NERA analysis of EIU CityData.
                                                          Figure 5.6
              Distribution of average product price ranks in PPP for available OECD cities9
                        By cities with prices collected in the non-metro area, 2020

Source: NERA analysis of EIU CityData.

9   EIU Disclaimer: All information contained herein is provided for reference only, and is not intended to provide
    professional advice and shall not be relied upon in that regard. The Economist Intelligence Unit, NA, Inc. and its affiliates
    do not make any warranty or representation as to the accuracy, completeness or reliability of any of the information
    contained herein.

© NERA Economic Consulting                                                                                                      5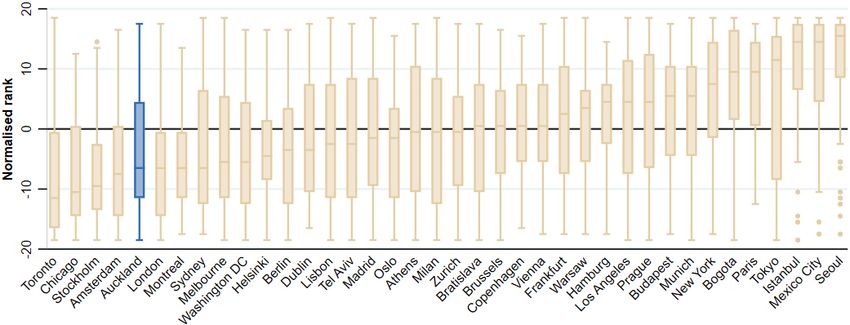
Results

                                                       Figure 5.7
         Distribution of supermarket product price ranks in PPP for available OECD cities 10
                        By cities with prices collected in the metro area, 2019

Source: NERA analysis of EIU CityData.
                                                       Figure 5.8
       Distribution of mid-price store product price ranks in PPP for available OECD cities10
                       By cities with prices collected in the metro area, 2019

Source: NERA analysis of EIU CityData.
                                                       Figure 5.9
            Distribution of average product price ranks in PPP for available OECD cities10
                        By cities with prices collected in the metro area, 2019

Source: NERA analysis of EIU CityData.

10EIU Disclaimer: All information contained herein is provided for reference only, and is not intended to provide
 professional advice and shall not be relied upon in that regard. The Economist Intelligence Unit, NA, Inc. and its affiliates
 do not make any warranty or representation as to the accuracy, completeness or reliability of any of the information
 contained herein.

© NERA Economic Consulting                                                                                                   6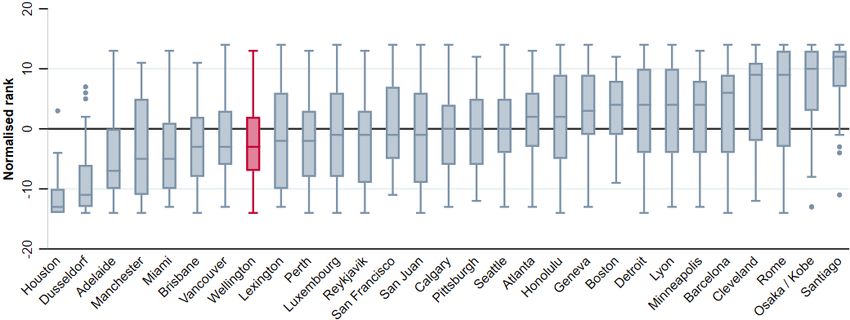
Results

                                                       Figure 5.10
         Distribution of supermarket product price ranks in PPP for available OECD cities 11
                      By cities with prices collected in the non-metro area, 2019

Source: NERA analysis of EIU CityData.
                                                       Figure 5.11
       Distribution of mid-price store product price ranks in PPP for available OECD cities11
                     By cities with prices collected in the non-metro area, 2019

Source: NERA analysis of EIU CityData.
                                                       Figure 5.12
            Distribution of average product price ranks in PPP for available OECD cities11
                      By cities with prices collected in the non-metro area, 2019

Source: NERA analysis of EIU CityData.

11EIU Disclaimer: All information contained herein is provided for reference only, and is not intended to provide
 professional advice and shall not be relied upon in that regard. The Economist Intelligence Unit, NA, Inc. and its affiliates
 do not make any warranty or representation as to the accuracy, completeness or reliability of any of the information
 contained herein.

© NERA Economic Consulting                                                                                                   7
Results
5.2. Sensitivity testing
20. The dataset analysed above includes alcohol and tobacco. Because these products are often
especially taxed, there is a risk their inclusion would distort the results. Furthermore, the NZCC’s
Preliminary Issues Paper (“PIP”) proposes to exclude these categories from the market study. 12
21. Accordingly, we also analyse a dataset that excludes alcohol and tobacco products. We have also
excluded electric toasters, frying pans, batteries, light bulbs, aspirin and cough medicine on the
basis the NZCC proposes to exclude these from the scope of the market study. 13 The 2020 results
are set out in the following figures.
12 NZCC, Market study into the retail grocery sector: Preliminary issues paper, 10 December 2020, p 9.
13NZCC, Market study into the retail grocery sector: Preliminary issues paper, 10 December 2020, p 9. See also, Stats NZ,
“Consumers price index review: 2020 – basket item list” at https://www.stats.govt.nz/methods/consumers-price-index-
review-2020.
© NERA Economic Consulting 8Results
Figure 5.13
Distribution of supermarket product price ranks in PPP for available OECD cities 14
Excl. products outside PIP scope, cities with prices collected in the metro area, 2020
Source: NERA analysis of EIU CityData.
Figure 5.14
Distribution of mid-price store product price ranks in PPP for available OECD cities14
Excl. products outside PIP scope, cities with prices collected in the metro area, 2020
Source: NERA analysis of EIU CityData.
Figure 5.15
Distribution of average product price ranks in PPP for available OECD cities14
Excl. products outside PIP scope, cities with prices collected in the metro area, 2020
Source: NERA analysis of EIU CityData.
14EIU Disclaimer: All information contained herein is provided for reference only, and is not intended to provide
professional advice and shall not be relied upon in that regard. The Economist Intelligence Unit, NA, Inc. and its affiliates
do not make any warranty or representation as to the accuracy, completeness or reliability of any of the information
contained herein.
© NERA Economic Consulting 9Results
Figure 5.16
Distribution of supermarket product price ranks in PPP for available OECD cities 15
Excl. products outside PIP scope, cities with prices collected in the non-metro area, 2020
Source: NERA analysis of EIU CityData.
Figure 5.17
Distribution of mid-price store product price ranks in PPP for available OECD cities15
Excl. products outside PIP scope, cities with prices collected in the non-metro area, 2020
Source: NERA analysis of EIU CityData.
Figure 5.18
Distribution of average product price ranks in PPP for available OECD cities15
Excl. products outside PIP scope, cities with prices collected in the non-metro area, 2020
Source: NERA analysis of EIU CityData.
15EIU Disclaimer: All information contained herein is provided for reference only, and is not intended to provide
professional advice and shall not be relied upon in that regard. The Economist Intelligence Unit, NA, Inc. and its affiliates
do not make any warranty or representation as to the accuracy, completeness or reliability of any of the information
contained herein.
© NERA Economic Consulting 10Appendix A
Appendix A. Products included in analyses
The products for which there is a price available for each OECD city are listed in Table A.1 below.
All unshaded items are available for both metro and non-metro cities, while items shaded in blue are
only included in the non-metro analyses (meaning that these products are unavailable for some metro
cities).
Items shaded in orange are excluded in Figure 5.13 through Figure 5.18, as these are considered
outside the scope of the PIP.
Table A.1
List of products in analyses
Apples (1 kg) Eggs (12) Peaches, canned (500 g)
Aspirins (100 tablets) Electric toaster (for two slices) Peanut or corn oil (1 l)
Bacon (1 kg) Facial tissues (box of 100) Peas, canned (250 g)
Bananas (1 kg) Flour, white (1 kg) Pork: chops (1 kg)
Batteries (two, size D/LR20) Fresh fish (1 kg) Potatoes (2 kg)
Beef: filet mignon (1 kg) Frying pan (Teflon or good equivalent) Razor blades (five pieces)
Beef: ground or minced (1 kg) Ground coffee (500 g) Shampoo & conditioner in one (400 ml)
Beef: roast (1 kg) Ham: whole (1 kg) Sliced pineapples, canned (500 g)
Beef: steak, entrecote (1 kg) Hand lotion (125 ml) Soap (100 g)
Beef: stewing, shoulder (1 kg) Insect-killer spray (330 g) Spaghetti (1 kg)
Beer, local brand (1 l) Instant coffee (125 g) Sugar, white (1 kg)
Beer, top quality (330 ml) Laundry detergent (3 l) Tea bags (25 bags)
Butter, 500 g Lemons (1 kg) Toilet tissue (two rolls)
Carrots (1 kg) Lettuce (one) Tomatoes (1 kg)
Cheese, imported (500 g) Light bulbs - LED (two, 8-10 watts) Tomatoes, canned (250 g)
Chicken: fresh (1 kg) Margarine, 500g Tonic water (200 ml)
Cigarettes, Marlboro (pack of 20) Milk, pasteurised (1 l) Toothpaste with fluoride (120 g)
Cigarettes, local brand (pack of 20) Mineral water (1 l) White bread, 1 kg
Coca-Cola (1 l) Mushrooms (1 kg) White rice, 1 kg
Cocoa (250 g) Olive oil (1 l) Wine, common table (750 ml)
Cornflakes (375 g) Onions (1 kg) Wine, fine quality (750 ml)
Dishwashing liquid (750 ml) Oranges (1 kg) Wine, superior quality (750 ml)
Drinking chocolate (500 g) Packaged juice (1 l) Yoghurt, natural (150 g)
© NERA Economic Consulting 11Qualifications, assumptions, and limiting conditions This report is for the exclusive use of the NERA Economic Consulting client named herein. This report is not intended for general circulation or publication, nor is it to be reproduced, quoted, or distributed for any purpose without the prior written permission of NERA Economic Consulting. There are no third‑party beneficiaries with respect to this report, and NERA Economic Consulting does not accept any liability to any third party. Information furnished by others, upon which all or portions of this report are based, is believed to be reliable but has not been independently verified, unless otherwise expressly indicated. Public information and industry and statistical data are from sources we deem to be reliable; however, we make no representation as to the accuracy or completeness of such information. The findings contained in this report may contain predictions based on current data and historical trends. Any such predictions are subject to inherent risks and uncertainties. NERA Economic Consulting accepts no responsibility for actual results or future events. The opinions expressed in this report are valid only for the purpose stated herein and as of the date of this report. No obligation is assumed to revise this report to reflect changes, events, or conditions, which occur subsequent to the date hereof. All decisions in connection with the implementation or use of advice or recommendations contained in this report are the sole responsibility of the client. This report does not represent investment advice nor does it provide an opinion regarding the fairness of any transaction to any and all parties. In addition, this report does not represent legal, medical, accounting, safety, or other specialized advice. For any such advice, NERA Economic Consulting recommends seeking and obtaining advice from a qualified professional. © NERA Economic Consulting 12
NERA Economic Consulting
Level 11
15 Customs Street West
Auckland 1010
New Zealand
www.nera.com
You can also read