FINSCOPE SOUTH AFRICA SMALL BUSINESS SURVEY 2010 - FINMARK TRUST
←
→
Page content transcription
If your browser does not render page correctly, please read the page content below
FinScope South Africa Small Business Survey 2010

                 Introduction
                 Small businesses have been identified as key in driving South Africa’s economic growth. Broadly, the South African
                 government’s strategy is to:
                 ■ curb unemployment through job creation
                 ■ alleviate poverty, and
                 ■ redistribute wealth

                 Despite government’s efforts to increase support to the small business sector, the SMME Business Confidence Index,
                 a survey of SMME perceptions, has suggested that these initiatives have not had the intended impact.

                 In order to develop effective interventions, it is important to first have a comprehensive understanding of the small
                 business sector, the specific challenges small business owners face and the capacity they have to deal with these
                 challenges. Any intervention strategy should take into account that a ‘one size fits all’ approach will not be effective.
                 Interventions should be targeted, and in order to achieve this, reliable and accurate information is needed to identify
                 the specific challenges affecting specific small business sub-sectors.

                 This information is not available in many developing countries. To address this need, FinMark Trust developed the
                 FinScope Small Business Survey. FinMark Trust is a not-for-profit independent trust established in South Africa in
                 2002, with core funding from the UK’s Department for International Development (DFID). FinMark Trust’s purpose
                 is to make financial markets work for the poor by promoting financial inclusion and regional financial integration.
                 FinMark Trust uses evidence-based information in its engagement with the public and private sectors across Africa, to
                 bring about systemic change in making markets work for unserved and underserved consumers.

                 The FinScope small business survey has the following objectives:
                 ■ To describe the size and scope of the small business sector
                 ■ To segment the small business market into homogenous market segments and to identify the development and
                    financial needs of the different market segments in order to stimulate segment-related development and financial
                    product innovation
                 ■ To serve as a baseline against which the impact of interventions can be assessed over time

                 In pursuit of the FinMark Trust purpose to ‘make financial markets work for the poor’, the FinScope Small Business
                 Survey has the following specific financial inclusion objectives:
                 ■ To determine levels of financial access (formal and informal) for the small business sector
                 ■ To describe the landscape of financial access for the small business sector i.e. type and extent of financial product
                     (bank and non-bank) utilisation
                 ■ To identify the barriers to financial access for the small business sector

The syndicate members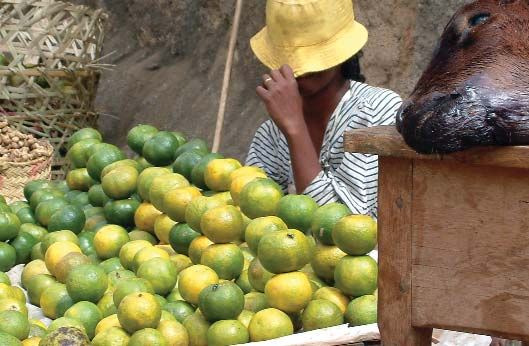
FinScope South Africa Small Business Survey 2010
The FinScope survey approach
In implementing FinScope surveys, FinMark Trust collaborates with a wide range of stakeholders, from both the public and private
sectors. This approach is mainly followed to facilitate stakeholder buy-in and support for the survey, and also to ensure that the
information gathered addresses relevant issues.
For the purposes of the implementation of the FinScope South Africa Small Business Survey 2010, a syndicate approach was
followed. Syndicate member participation entailed:
■ Financial contribution towards the costs of implementation
■ Input into the survey instrument design
■ Contextual interpretation of the survey findings
Geographical distribution Survey methodology
■ Universe = business owners in South Africa, 16 years and older, with less than 200
3% 23%
employees
■ 5676 face-to-face interviews conducted
7%
■ Sample representative at national, urban-rural, and provincial levels
8% 15% ■ Sampling methodology entailed random sampling at three levels:
o Primary sampling unit – enumerator areas (EA) – 1000 selected using a probability
8%
proportioned to size (PPS) approach
14%
10% o Secondary sampling unit – households within selected EAs with members
13%
qualifying in terms of selection criteria (business owners, 16 years and older,
employing less than 200 people)
■ 23% Gauteng ■ 8% Western Cape ■ Respondent selected at random from qualifying household members in selected
■ 15% Eastern Cape ■ 8% Free State households
■ 14% KwaZulu Natal ■ 7% Mpumalanga
■ 13% North West ■ 3% Northern Cape ■ On average, six interviews were conducted per EA
■ 10% Limpopo ■ Sample data weighted back at provincial level to population aged 16 years and older
Small business landscape in South Africa
■ 5 979 510 small businesses in South Africa
■ 5 579 767 small business owners, 16 years and older, in South Africa (one in six
Age distribution individuals, aged 16 years and older, generate an income through small business
activity)
■ Seventeen percent of small business owners have registered businesses
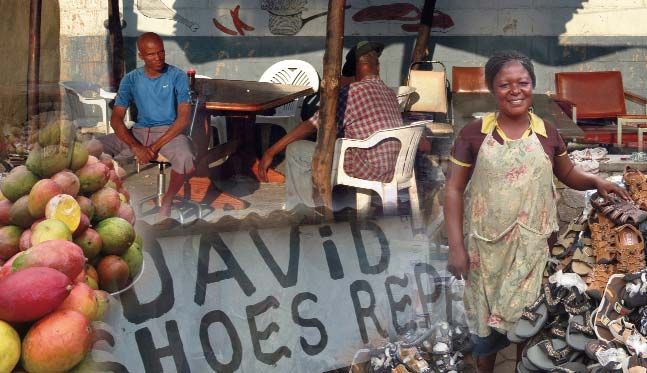
■ Seventy nine percent of small business owners are traders (sell products)
10% 11% o Of these, 62% sell their products in the same form they bought it (they do not
add any value)
22%
o A further 16.5% are dependent on nature, in that they grow what they sell, rear
28%
livestock/poultry for sale, sell by-products of animals, or sell what they collect from
nature
29%
■ Twenty one percent of small business owners are service providers. Of these, five
percent render professional services (e.g. accountants, doctors, lawyers, etc.)
■ Of the population 16 years and older, small business owners comprise 31% in the
■ 11% 16 – 24 years ■ 28% 45 – 59 years North West Province; 23% in the Free State province and 20% in the Northern Cape
■ 22% 25 – 34 years ■ 10% 60+ years province. Although most small business owners reside in Gauteng in contrast to the
■ 29% 35 – 44 years
small provinces, only 17% of the population aged 16 years and older in Gauteng are
small business owners
Making financial
                                                                                                                     markets work for
                                                                                                                     the poor
 Profile of the small business owner
 ■    Females, are more likely to be small business owners than males
 ■    For 67% of small business owners, the small businesses they own are their sole source of income
 ■    Two-thirds of small business owners have not completed secondary school education
 ■    One in two small business owners started the business either because they could not find jobs or because they lost their
      jobs
 ■    Eighty two percent of small business owners in South Africa started their businesses on their own

            Gender distribution                                                    Race distribution                                     Education level distribution

                                                                                                                                                              2%
                                                                                        5% 4%
                                                                                                                                                         7%
                                                                                   8%                                                                                    23%
                                           42%                                                                                                  25%
               58%

                                                                                                84%                                                              43%

      ■    Female             ■           Male                   ■    Black                     ■     Coloured                  ■   Primary School or less           ■    Apprenticeship/Diploma
                                                                 ■    White                     ■     Asian/Indian              ■   Some high school                 ■    University Degree
                                                                                                                                ■   Matric

 Challenges faced by small business owners
 When starting up

 ■    Thirty nine percent of small business owners cite money-related matters as the main obstacles they faced when starting up
      their businesses; 34% cite business strategy issues as their main obstacles (determining and finding what to sell, finding their
      target market, dealing with competitors, etc.)

          Money-related (39%)                                 Strategy-related (34%)                                             Infrastructure and Equipment (17%)

                              %                                                                       %                                                              %

          Sourcing money                              22                      Too many competitors                   13                                Equipment                              6

                                                 15                           Not enough customers                        15          Transport e.g. moving stock                         5
                 Cash flow

                                      3                                What product/service to sell              7             Finding business premises or space                         5
Being owed money/debtors
                                      2                         Who to sell to i.e. which customers              7                     Connecting water services               2

          Financial records
                                      2                    Raising awareness on products/services           4                               Connecting electricity             2

Banks did not want to help        1                                Problems with stock/goods sold           4
FinScope South Africa Small Business Survey 2010

                 Obstacles to growth
                               %
          Space to operate                                       16
 Access to/cost of finance                                  14
               Competition                                 13
           Crime and theft                             7
            Transportation                     4                           Growing the business
                 Electricity               3
        Business licensing                 3                               ■   The diversity of small businesses most likely explains the wide-ranging
Weather/natural disasters                  3                                   nature of obstacles to growth cited by small business owners
    Harassment by officials            2
Customs/trade regulations              2
       Skills and education            2
            Access to land         1
                Corruption         1
        Lack of customers          1
                     Other         1
               Don’t know                          5
             None/nothing                                             19

Access to financial services
The FinScope survey uses the Financial Access Strand to compare access to financial services across countries. In constructing
the Financial Access Strand, it is assumed that every individual will fall into one of three broad segments:

■     Formally served/included – individuals who have/use financial products provided by formal financial institutions (i.e. financial
      institutions regulated by an act of law)
      o Banked – individuals who have/use financial products provided by commercial banks
      o Other formal – individuals who have/use financial products provided by formal financial institutions which are not
          commercial banks (e.g. insurance companies, microfinance institutions, credit-providing retail stores)
■     Informally served/included – individuals who have/use financial products which are not provided by a formal financial institution
      (e.g. savings with a savings group, credit from a private moneylender, burial society membership)
■     Financially unserved/excluded – individuals who do not have/use financial products – neither formal nor informal. These
      individuals typically save by keeping money at home, and borrow only from friends and family

In terms of the FinScope Small Business survey, small business owners are categorised in the Financial Access Strand segments
according to their use of financial products for business purposes.

South African small business owner Access Strand 2010
                                                                                          ■
                                                                                58.2% of small business owners are financially included
                                                                                i.e. use financial products (either formal or informal) for
                                                                                business purposes
                46.9              4.6 6.7            41.8
                                                                            ■ 51.5% of small business owners are formally included
                                                                                i.e. use formal financial products for business purposes
                                                                                o 46.9% use bank products
■    Banked ■ Other formal ■ Informally served ■ Financially unserved           o 22% use formal insurance products
                                                                                o 8% use formal credit products
■     6.7% of small business owners do not use formal financial products for business purposes but rely on private money lenders,
      burial societies, savings clubs/stokvels, and stores for credit and savings
■     41.8% of small business owners do not use formal or informal products for business purposes, but rely solely on family and
      friends for borrowing, and saving money at home
Making financial
                                                                                                                      markets work for
                                                                                                                      the poor
Comparing the small business owner access strand across provinces

             Eastern Cape                         44.2                                5.8          8.0                                42.1

               Free State                 34.1                         7.7     3.4                                           54.8

                 Gauteng                                        62.2                                               3.3 3.7                    30.9

            KwaZulu Natal                  37.6                               9.2            10.1                                     43.1

                 Limpopo                    37.8                        1.1            18.3                                           42.7

             Mpumalanga                          42.1                           3.3       7.9                                       46.7

            Northern Cape                           47.1                                        10.5        1.3                        41.2

               North West                                51.2                                     1.4                                 46.6
                                                                                                 .8
            Western Cape                           45.1                               4.5       5.4                                  45.0

                    Total                          46.9                                   4.6         6.7                             41.8

                            0%      10%          20%            30%      40%                50%              60%         70%           80%           90%   100%

                            ■ Banked ■ Other formal ■ Informal ■ Not served

■ Small business owners from Gauteng are significantly more likely to be financially served (69.2%) than small business owners
  from other provinces
  o Small business owners from Gauteng are most likely to be formally served (65.5%)
  o Small business owners from Gauteng are most likely to be banked (62.2%)
■ Small business owners from the Free State province are more likely to be financially excluded (54.8%) than small business
  owners from other provinces
  o Formal financial inclusion is the lowest amongst small business owners residing in the Free State Province (41.8%)
  o Small business owners from the Free State (34.1%), KwaZulu Natal (37.6%) and Limpopo (37.8%) provinces are least
     likely to be banked
■ The role of non-bank formal financial institutions in extending formal financial inclusion for small business owners is most
  pronounced in the Northern Cape and KwaZulu Natal provinces and least pronounced in Limpopo and the North West
  provinces
■ There is a significant difference between Limpopo and other provinces in terms of the role of the informal financial sector in
  extending financial services to small business owners

Male and female small business owner access strand

                    Male                                 52.1                                     3.4 5.2                              39.2

                  Female                         43.1                               5.5         7.7                                  43.7

                    Total                          46.9                                   4.6       6.7                               41.8

                            0%      10%          20%            30%      40%                50%              60%         70%           80%           90%   100%

                            ■ Banked ■ Other formal ■ Informal ■ Not served

■ Female small business owners are significantly more likely to be financially excluded (43.7% of female business owners vs.
  39.2% of male business owners)
■ Female small business owners are significantly less likely to be banked (43.1% females banked vs. 52.1% males banked)
■ There is a significant difference between male and female small business owners in terms of their reliance on non-bank formal
  financial institutions and the informal financial sector to meet their financial needs; female small business owners are more
  likely to rely on these
FinScope South Africa Small Business Survey 2010

In terms of banking:                                                                             Drivers of bank choice
■ There is a significant difference between urban and rural areas in
    terms of the bank status of small business owners                                                                   %
                                                                             Used previously/personal bank accounts                                     38
    o In urban areas one in two small business owners are banked for
                                                                                     Recommended by friend/family                                  25
        business purposes whilst in rural areas two in five are banked
    o Convenience seems to be the most significant driver of bank                                       Convenience                           17

        choice for those small business owners who are banked for                 The best rates on savings/interest                         15
        business purposes                                                                                 Advertising                    13
■ Thirty eight percent of small business owners who are banked for                                                                  7
                                                                                                   Products/services
    business purposes tend to choose the banks they use for their
                                                                                                       Bank charges                 6
    personal banking (banks they have experience with)
■ In addition, 17% choose their bank based on convenience of location       Recommended by another small business               4

■ Small business owners who are not banked appear not to see the                            Friend/Family works there           4

    value of having a bank account for business purposes                         Recommended by business partner                3
■ One in two of those not banked perceive their income from the                        The best credit rates/interest       1
    business as insufficient to justify having a bank account for their                                        Other        1
    business
                                                                                                          Don’t know                    11
■ For 31.6% of unbanked small business owners, their reason for not
    being banked is that they do not have a regular, consistent income

Small business owner Landscape of Access
The FinScope approach uses the Landscape of Access to compare usage of financial products across entities.
The Landscape of Access serves as an indicator to describe:
■ Transactional: the proportion of small business owners with a secure mechanism through which funds can be deposited,
  transmitted and withdrawn to meet regular transactional needs
■ Savings: the proportion of small business owners with a means of accumulating money, whether on a contractual or
  discretionary basis
■ Credit: the proportion of small business owners with funds/services having been provided in advance against a committed
  repayment stream
■ Insurance: the proportion of small business owners with a product/products covering a defined risk event in return for a
  premium (includes life, burial, health and short-term insurance)

                                    National               Transactional
                                                              60
                                                                     45.4
                                                              50
                                                              40
                                                              30
                                                              20
                                                              10
                                                                                     52.9
                                     Insurance    21.9        0                         Savings

                                                                   8.6

                                                               Credit
Making financial
                                                                                    markets work for
                                                                                    the poor
■ Product usage is transactional and savings oriented
■ In most provinces, the informal sector does not play a significant role in increasing the financial inclusion levels
■ In the provinces with larger proportions of rural populations namely Limpopo, Mpumalanga, Free State, KwaZulu-Natal and
  Eastern Cape, the role of the informal sector in increasing financial inclusion levels is more significant. This however, seems to
  be mainly in terms of providing small business owners with alternative savings products/mechanisms
■ In general, the usage of credit products by small business owners is low with Gauteng and Western Cape small business
  owners more likely to use credit products than small business owners in other provinces
■ In terms of the usage of insurance products, small business owners in Northern Cape and Gauteng are more likely to have
  insurance for business purposes than small business owners in other provinces, whilst in Limpopo and Mpumalanga small
  business owners are significantly less likely to have insurance

Access to credit and start-up finance
■ Ten percent of small business owners have/use credit products
  o Nine percent of small business owners have/use formal credit products
  o One percent of small business owners do not have formal credit products, but make use of the informal sector for credit
     borrowing from money lenders (mashonisas), burial societies and/or savings clubs
■ One in two small business owners who borrow money for the use in the business, borrow from family and friends
■ Most small business owners claim not to borrow for business purposes, with the most significant reasons being attitudinal:
  o Thirty six percent claim not to believe in borrowing money
  o Thirty five percent regard borrowing as too risky

Source of start-up funding
■ Sixty five percent of small business owners did not borrow money to start their business
■ Most business owners who did borrow money to start their businesses, did so from family and friends

             Own money sources (65%)                                          Loans/money from others (37%)

                                               %                                                               %
                                   Savings                     35              Friends/family (excl. spouse)                23

                                     Salary                8                                Spouse/partner             10

                   Retrenchment package                    7                              Business partner         2

                         Government grant                  7                                  Personal loan        1

                       Money from another              5                                     Business loan         1

                     Pension or retirement         3

                            Stokvel payout             4

                                Inheritance        2

              Sold assets e.g car, jewellery   1
Perceived business risks
■ Traders – theft of stock
  o Those who grow or rear what they sell, sell by-products of animals, or collect something from nature to sell, perceive natural disasters
       as an additional major risk facing their businesses (floods, drought, diseases, etc.)
■ Service providers – although theft of stock is regarded as a major risk, additional perceived risks centre around the business owner’s
  ability to provide the service. Unlike trading businesses where the business can continue in the absence of the business owner, this is
  not the case for service related small businesses, where the skill required to render the service rests with the business owner
■ Coping mechanisms for perceived business risks:
  o Less than one in ten of small business owners are insured against the specific risks they face
  o One in four use (or would use) personal savings or sell assets to cover their losses
  o One in ten borrow (or would borrow) money to cover their losses
  o One in two either do not know what they would do, or have nothing in place to cover their losses

Employment opportunities
■   Two in three business owners operate their own businesses and do not have any employees
■   Thirty two percent of small business owners provide between one and ten employment opportunities per small business
■   One percent of small business owners provide more than ten business opportunities per small business
■   Service-related small businesses are more likely to provide employment opportunities than other small businesses
■   Apart from the 5,6 million small business owners, small businesses in South Africa provide an additional estimated 6 million employment
    opportunities

                                                                                             Awareness of support organisations
Support
                                                                                                                                %
■ Small business owners in general are not aware of support organizations that they                   Umsobomvo Youth Fund/                                 10
  could turn to                                                                            National Youth Development Agency        1
                                                                                                                                                        9
  o Seventy six percent of small business owners were unable to name any                                          The banks             2
     organisation that gives help and/or advice to small businesses                                                    SARS
                                                                                                                                                    5
                                                                                                                                    1
  o Ninety four percent of small business owners have never used any support                                                                    4
                                                                                                                       SEDA
     organisations                                                                                                                  1
                                                                                                                                                4
■ Ten percent of small business owners are aware of the National Youth                                              NAFCOC
  Development Agency as a source of support, whilst nine percent identify banks                  Khula Enterprise Finance Ltd
                                                                                                                                            3
  as a source of support. In terms of making use of these organizations however,                                                            3
                                                                                                                       SABS
  only one percent of small businesses owners have turned to the National Youth
                                                                                                                                        2
  Development Agency for support whilst two percent have turned to banks                                              SETAs
                                                                                                                                        2
                                                                                                                      The dti
Key findings                                                                                               Business Partners
                                                                                                                                        2

■ Small businesses create an estimated additional six million employment                                    Business Trust
                                                                                                                           2

  opportunities                                                                                                            2
■ Females are more likely to own businesses but less likely to be financially served      Eskom Small Business Foundation

  than males
■ Although small business owners face a number of risks, most are not insured, opting to use savings and the selling of assets in the event
  of a loss
■ Small business owners claim not to borrow for business purposes citing reasons such as lack of belief in borrowing money and regarding
  borrowing as too risky
■ There is a higher prevalence of small business owners in the North West, Free State and Northern Cape provinces than in Gauteng

                             For more information on FinScope South Africa Small Business Survey 2010, including a detailed report on
                             the findings, please contact:
                             Irma Grundling                                           Trevor Kaseke
                             irmag@finmark.org.za                                     trevork@finmark.org.za
                             Tel +27 11 315 9197 | Fax +27 86 518 3579                www.finmarktrust.org.za | www.finscopeafrica.com
You can also read