DATA INTERPOLATION BASED ON CONTEXTUAL ANALYSIS FOR GENERATING TOMOGRAPHIC IMAGES IN CONCRETE SPECIMEN
←
→
Page content transcription
If your browser does not render page correctly, please read the page content below
International Conferences Computer Graphics, Visualization, Computer Vision and Image Processing 2020;
                                               Big Data Analytics, Data Mining and Computational Intelligence 2020;
                                                                  and Theory and Practice in Modern Computing 2020

   DATA INTERPOLATION BASED ON CONTEXTUAL
 ANALYSIS FOR GENERATING TOMOGRAPHIC IMAGES
             IN CONCRETE SPECIMEN

                  Roger Manuel Quispe Urure , Marco Antonio Garcia de Carvalho,
            Marinara Andrade Nascimento Moura and Gisleiva Cristina dos Santos Ferreira
                                     School of Technology, University of Campinas
                                                 Limeira - SP - Brazil

ABSTRACT
In the Construction area, inspections of concrete structure could be carried out using non-destructive tests, such as
ultrasonic tomography. Usually, images generated by this technique are improved by means of spatial interpolation data.
This research proposes the use of a new spatial interpolation technique in order to generating tomographic images of
concrete. This approach was originally used on wood tomographic images and is based on contextual analysis according
to the location of the point to be interpolated. Also, it is considered the influence zone of each route obtained in the
concrete ultrasonic test. The ultrasonic tests were performed in cylindrical specimens with and without PVC tubes,
simulating voids in concrete. The achieved result of our analysis are compared to the ground truth images and those
obtained by Inverse Distance Weighting, using accuracy metric and image processing operations. The results indicated
high accuracy values (greater than 90%), i.e, the spatial interpolation technique (method) is promising in identifying the
presence of voids in concrete elements.

KEYWORDS
Concrete, Data interpolation, Ultrasonic Tomography, Thresholding

1. INTRODUCTION
The performance and safety of concrete constructions depend on periodic monitoring and inspections of the
structural elements. The standards present at Brazilian Association of Technical Standards (ABNT, 2019)
establish ultrasonic tests to evaluate the concrete used in building structural system. These kind of tests does
not affect the integrity of the structures and allows identifying non-visible anomalies, for instance.
    Ultrasonic test has been widely used in concrete inspection, to evaluate the quality and degradation state
of these structures by the identification of heterogeneities, defects or cracks (Hola et al. 2015, Lluveras
Núñez et al, 2017). The ultrasonic tomography images in particular, has shown great importance in the
evaluation of cementitious materials by using different techniques for images generation (Haach and Ramirez
2016, Beniwal et al. 2016). Some author also presents the advantages of using interpolation for generation
and reconstruction of images (Fan et al, 2017; Moura et al, 2020).
    This paper describes a new spatial interpolation technique to generate tomographic images of concrete.
    The proposed technique is based on a strategy adopted for wood inspection by ultrasound [Strobel 2017].
Considers an elliptical model for the propagation of the ultrasonic pulse and is based on contextual analysis
of the point to be interpolated.
    This article is organized as follows: Section 1 presents the introduction, objectives and organization of the
text, in section 2, describing the related works, explaining the differential of the proposal in relation to
existence, in section 3 explaining the steps of the methodology for contextual analysis, in section 4,
describing a sample, explained or tried, and how the results will be applied and finally in section 5,
highlighting the performance of the method and the final considerations of the work.

                                                                                                                       55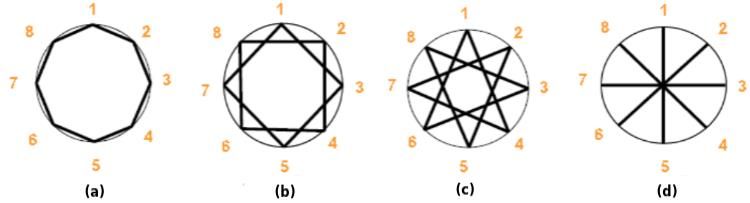
ISBN: 978-989-8704-21-4 © 2020

2. MAIN CONCEPTS AND RELATED WORKS
This section provides main concepts on ultrasonic tomography on concrete, as well as, presents the related
research's. At the end of this section we highlight the main contributions of our work.

2.1 Fundamental Concept
Non-destructive tests are techniques used to inspect materials without damaging them. The ultrasonic test
consists of determining the time that the ultrasonic wave takes to pass through a certain material. The
equipment has a piezoelectric crystal that converts the signal into mechanical vibration. The electrical signal
is emitted by the generator and is received by the receiver obtaining the TOF (Time of Flight) in
microseconds as shown in Figure 1 adapted from Cavalcanti (2010)

                                         Figure 1. Ultrasound Equipment
    In the ultrasonic reconstruction of a homogeneous material, the mechanical waves propagate in straight
lines between the transducers. On the other hand, in a concrete specimen, the mechanical waves may deviate
from an internal void, resulting in lower TOF [Perlin and de Andrade Pinto 2019].
    These changes in TOF values are represented on the ultrasonic tomographic image. The tomographic
ultrasonic technique provides methods of sampling a larger number of points, rather than a single point, with
an automated way of data collection and processing [Koulountzios et al. 2019]. Thus, the voids are
represented through an image.

2.2 Related Works
The interpolation method is widely used to predict data. A spatial interpolation can predict the values of the
unknown points by processing the surrounding variables with meaningful values within the same region
(Feng et al. 2014). This is often used when the measured data needs to be transformed from discrete points to
a continuous data surface (Cheng & Kou ,2019).
    Khairi et al (2019) reconstructed a tomographic image based on the integral values obtained by an image
reconstruction algorithm. To optimize the tomographic image, an artificial neural network is used, mainly
because it is considered as a tool that handles both uncertain and complex systems.
    Feng et al (2014) used a proposed interpolation method to reconstruct a tomographic image from stress
wave TOF data. They considered that every point in the cross section of a tree trunk was related to other
points and the adjacent points were more closely related than distant points. Their results showed a good
match between tomographic images and the true physical conditions of the samples.
    Du et al. (2015) used the wave tomography method using interpolation to detect internal defects in
wooden logs. Strobel (2017) implemented an improvement in the method of (Du et al, 2015) adding a speed
compensation method and significantly improving the results.
    Although the use of interpolation for generation and reconstruction of images is still not widely discussed,
several studies presents the advantage of the method applied to concrete. (Fan et al, 2017), used the
maximum likelihood expectation maximization algorithm and ultrasonic TOF data to reconstruct concrete
images. TOF data interpolation and normalization were proposed and validated for image reconstruction
system. In Moura et al (2020), the interpolation technique was used to estimate the acoustic velocity, of
ultrasonic tests, at the unmeasured test points of a concrete beam. The Inverse Distance Weighting Algorithm

56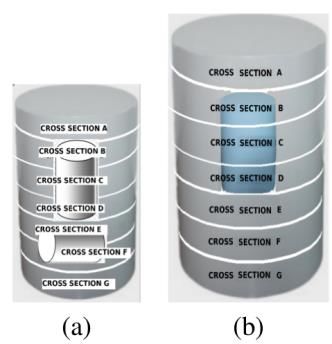
International Conferences Computer Graphics, Visualization, Computer Vision and Image Processing 2020;
Big Data Analytics, Data Mining and Computational Intelligence 2020;
and Theory and Practice in Modern Computing 2020
was proposed to generate the tomographic images. The resulting images indicated the presence of internal
flaws in concrete.
The methodology used in Du et al (2015) and Strobel (2017) was applied to wooden logs. In this work,
we propose an adaptation of the methodology used by the authors, replacing the main material used. Thus,
we intend to verify if the same methodology can be applied to concrete, using cylindrical specimens.
The key contributions of our work are the following:
We conduct the whole process, from the generation of the concrete samples to the quantitative
analysis of the images generated by the interpolation.
In the interpolation process, we adapt and use a method originally applied in tomographic wood
analysis.
Our results and analysis are evaluated in a quantitative way, based on image processing and
classification measures techniques.
3. PROPOSED APPROACH
In this section, we describe our approach employed to improve and analyze tomographic images generated by
ultrasonic test. It consists of three main steps, illustrated in Figure 2 and described through the remainder of
this section.
In order to organize the discussion, these steps are grouped in three major topics, i.e., (a) ultrasonic test;
(b) Data interpolation using contextual analysis; (c) quantitative tomographic analysis.
Figure 2. Proposed approach
3.1 Ultrasonic Test
The ultrasonic test was performed according to the Brazilian Standard NBR 8802 (ABNT, 2019) standard
detailed in section 2.1. The samples used have the dimensions: 20x10cm and 30x15cm. Also, we generate 2
specimens with defect, simulating voids in concrete, and 2 without defect, illustrated in Figure 3. The
dimensions of the PVC tubes that simulate the concreting voids are shown in Table 1.
Table 1. PVC pipes dimensions
Figure 3. PVC pipes location
The arrangement adopted to compute the TOF was the direct measurement, according to the cross section
of the sample, with eight points distributed equally on the surface of the specimen. This configuration
produces an arrangement known as a diffraction grid.
57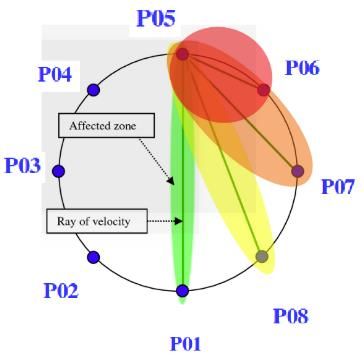
ISBN: 978-989-8704-21-4 © 2020

3.2 Data Interpolation by Means of Contextual Analysis of Concrete Specimen
This work applies and adapts an existing technique in the area of wood inspection by ultrasonic test. We
consider the concept of affected zones in the image interpolation step, where for each measurement route an
elliptical zone is associated (Zeng et al, 2013). This is illustrated in Figure 4.

                                    Figure 4. Routes and its elliptical influence zones
    To define the types of measurement routes, we rely on work of Lin et al (2008). Four types of routes were
defined for a diffraction grid with eight measurement points as shown in Figure 5. Finally, an ellipse of
variable eccentricity is associated to each route, according its length.

 Figure 5. The four types of routes in a diffraction grid with 8 measured points: (a), (b):Analysis of the context near the
                      concrete surface: (c), (d):Contextual analysis of the central region of concrete
    The proposed approach consists on computing the interpolated points based on the contextual analysis of
they locations, divided in two categories: (i) analysis of the context near represented by routes Figures 5(a),
5(b); (ii), Contextual analysis of the central represented by Figures 5(c), 5(d).
    In the first category, analyzing the context near to the concrete edge, the technique consider all possible
routes and selects only the three ellipses whose center is closest to the point to be interpolated. These routes
are considered the most representatives. In this way, only those routes that will emphasize a possible
deterioration and discarding outliers. In the contextual analysis of the central region, it is considered different
ellipse eccentricity in order to evaluate the influence of the route, and corresponding velocity of ultrasonic
pulse, in the point to be interpolated.

3.3 Quantitative Evaluation
Usually, the efficiency of an interpolation technique is assessed by means of a visual comparative analysis of
the images generated before and after the process. Additionally, the experts know-how are considered.
    Strobel (2017) evaluates the results of an interpolation technique on wood logs using quantitative
evaluation. The method consists on compare two images, a model and the segmented image, using a
classification model, i.e., by means of a confusion matrix.
    In this paper we propose a method of quantitative evaluation, where images are seen as a classification
model evaluated by means of metrics, resulting in a confusing matrix.

58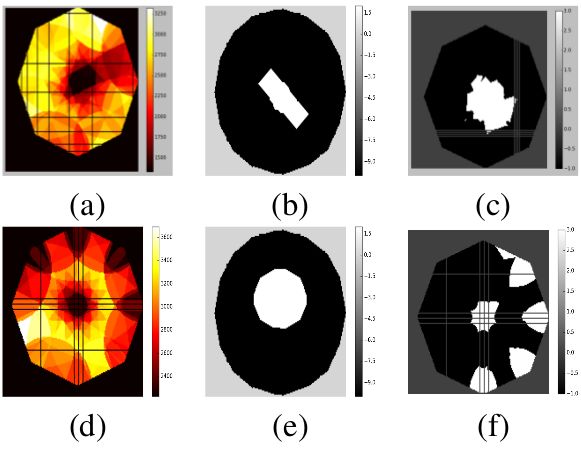
International Conferences Computer Graphics, Visualization, Computer Vision and Image Processing 2020;
Big Data Analytics, Data Mining and Computational Intelligence 2020;
and Theory and Practice in Modern Computing 2020
According to each samples and its dimensions, with or without voids, we build a model image with three
colors: white, black and gray, i.e., the ROI (Region of Interest), the background and the interpolated regions,
respectively. The segmented image was obtained by means of threshold operation defined by Equation 1.
Where g(x,y) and f(x,y) are the segmented and interpolated images and T is the value defined to divide
two distinct regions into two levels of gray, white and black, respectively. Finally, the accuracy is computed
according to Equation 2, where (TP, TN) is true positive and negative and (FN, FP) is false negative and
positive.
4. EXPERIMENTS AND RESULTS
In this section we first introduce some specific aspects related to the experiments and then we present the
results obtained the efficiency of the proposed approach. We compared our approach with the Inverse
Distance Weighting (IDW) method, used in the same context (Moura et al, 2020).
Initially, the materials were selected, created and the samples characterized before the ultrasonic test.
Such procedures follow standard recommendations and were made in Laboratory of the University of
Campinas. In order to perform measurements during the ultrasonic test we divide and label each specimen in
seven cross sections according to the illustrated in Figure 6. From each cross section is possible to obtain a
model image, known as ground truth, and use them to compare with the segmented image. We work with 12
samples in total, where six are of type 20x10cm (with and without PVC tubes) and six of type 30x15cm (with
and without PVC tubes).
In essence, the implemented experiments consisted on interpolating the concrete samples, after the
ultrasonic tomography, using the proposed method. The results of TOF obtained by the ultrasonic equipment
are in microseconds.
Figure 6. Concrete voids: specimens used in this work and its seven cross sections: (a)20 x 10cm; (b)30 x 15cm
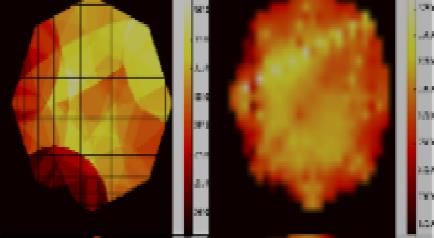
This procedure was repeated for all samples and the average accuracy was computed. In Figure 7 shows
the resulting interpolated images obtained from the contextual analysis and IDW algorithms, respectively, for
20x10cm specimen. Each cross section is compared in sequential order as shown in the Figure 7. In this
figure, the black regions indicate the presence of voids in concrete.
59ISBN: 978-989-8704-21-4 © 2020
(a) (e)
(b) (f)
(c) (g)
(d)
Figure 7. Interpolated resulting images of the 20x10cm specimen: (a),(b),...(g) cross-section, proposed method (left) and
IDW technique (right)
The results obtained to the cross section B of samples 20x10cm and 30x15cm are shown in Figure 8. Note
that the Thresholding operation is very dependent on the threshold that defines the void region on concrete,
as we can see in Figure 8(f).
Figure 8. Resulting images of cross section B (a) Sample 20x10cm interpolated by the proposed method; (b) Sample
20x10cm model image; (c) Sample 20x10cm segmented image; (d) Sample 30x15cm interpolated by the proposed
method; (e) Sample 30x15cm model image; (f) Sample 30x15cm segmented image
The Table 2 shows the analysis of the proposed method based on accuracy metric. This performance is
computed using all cross sections of each specimen, compared to they corresponding ground truth. We
compare our results with the IDW technique for both samples, 20x10cm and 30x15cm. The best performance
for each cross section is highlighted in bold.
60International Conferences Computer Graphics, Visualization, Computer Vision and Image Processing 2020;
Big Data Analytics, Data Mining and Computational Intelligence 2020;
and Theory and Practice in Modern Computing 2020
Table 2. Performance of the proposed method using accuracy metric for the sample 30x15cm and 20x10cm
As we can observe in Table 2, in the case of 20x10cm sample, our proposed approach generates better
results when compared to IDW method. In the case of 30x15cm sample, our results are slightly lower than
those obtained by the IDW method. The best IDW results correspond exactly to the regions where the PVC
pipe is located, as illustrated in Figure 8(d). This may be associated with the segmentation method adopted
and needs to be further investigated.
5. CONCLUSION
In this paper we presented a new approach to interpolate points in concrete tomographic images using
ultrasonic test. The method uses contextual analysis, according to the point location to be interpolated and the
relevant routes of the ultrasonic pulses that cross the concrete sample. We applied our method in 12 concrete
samples, with two different sizes and configurations (with and without voids simulated by PVC tubes). The
initial results indicated that our approach provides enough information and more suitable images to identify
voids, when compared to ground truth images and evaluated by accuracy metric. Also, in most of cases, the
contextual analysis interpolation was superior to the IDW technique.
Future work includes the use of a more accurate equipment to acquire data in ultrasonic tests, as well as to
improve the variety and number of samples in dataset. In addition, we intend to generate a 3D tomographic
image from the combination of all cross sections that make up the specimen.
ACKNOWLEDGEMENT
The authors would like to thank the Laboratories of Soils and Materials of the University of Campinas,
Brazil. Part of this research was supported by São Paulo Research Foundation (FAPESP), grant
2018/185204.
REFERENCES
ABNT (2019). Nbr 8802: Test method for pulse velocity through Concrete. ABNT – Brazilian Association of Technical
Standards. Rio de Janeiro, Brazil.
Beniwal, S., Ghosh, D., & Ganguli, A. (2016). Ultrasonic imaging of concrete using scattered elastic wave modes.
Ndt & E International, 82, pp 26-35.
Cavalcanti, R. S. (2010). Tests of ultrasonic waves and artificial neural networks in the evaluation of the compressive
strength of concrete (in Portuguese). Master thesis, Universidade Católica de Pernambuco.
Cheng, D., & Kou, K. I. (2019). FFT multichannel interpolation and application to image super-resolution.
Signal Processing, 162, pp 21-34.
Du, X., Li, S., Li, G., Feng, H., & Chen, S. (2015). Stress wave tomography of wood internal defects using ellipse-based
spatial interpolation and velocity compensation. BioResources, 10(3), pp 3948-3962.
61ISBN: 978-989-8704-21-4 © 2020
Fan, H., Zhu, H., Zhao, X., Zhang, J., Wu, D., & Han, Q. (2017). Ultrasonic image reconstruction based on maximum
likelihood expectation maximization for concrete structural information. Computers & Electrical Engineering, 62,
pp 293-301.
Feng, H., Li, G., Fu, S., & Wang, X. (2014). Tomographic image reconstruction using an interpolation method for tree
decay detection. BioResources, 9(2), pp 3248-3263.
Haach, V. G., & Ramirez, F. C. (2016). Qualitative assessment of concrete by ultrasound tomography. Construction and
Building Materials, 119, pp 61-70.
Hola, J., Bień, J., & Schabowicz, K. (2015). Non-destructive and semi-destructive diagnostics of concrete structures in
assessment of their durability. Bulletin of the Polish Academy of Sciences Technical Sciences, 63(1), pp 87-96.
Khairi, M. T. M., Ibrahim, S., Yunus, M. A. M., Faramarzi, M., Sean, G. P., Pusppanathan, J., & Abid, A. (2019).
Ultrasound computed tomography for material inspection: Principles, design and applications. Measurement, 146,
pp 490-523.
Koulountzios, P., Rymarczyk, T., & Soleimani, M. (2019). A Quantitative Ultrasonic Travel-Time Tomography to
Investigate Liquid Elaborations in Industrial Processes. Sensors, 19(23), pp 5117.
Lin, C. J., Kao, Y. C., Lin, T. T., Tsai, M. J., Wang, S. Y., Lin, L. D., ... & Chan, M. H. (2008). Application of an
ultrasonic tomographic technique for detecting defects in standing trees. International Biodeterioration
& Biodegradation, 62(4), pp 434-441.
Lluveras Núñez, D., Molero-Armenta, M. Á., Izquierdo, M. Á. G., Hernández, M. G., & Anaya Velayos, J. J. (2017).
Ultrasound transmission tomography for detecting and measuring cylindrical objects embedded in concrete. Sensors,
17(5), pp 1085.
Moura, M. A. N., Carvalho, M. A. G., and Ferreira, G. C. S. (2020). Influence of measuring points in ultrasonic tests on
th etomographic image quality of concrete. In International Conference in Central Europe on Computer Graphics,
Visualization and Computer Vision (WSCG). Plzeň, Czech Republic, pp. 1–8.
Perlin, L. P., & de Andrade Pinto, R. C. (2019). Use of network theory to improve the ultrasonic tomography in concrete.
Ultrasonics, 96, pp 185-195.
Strobel, J. R. A. (2017). Associated Ellipse Based Interpolation Method Contextual Analysis of Routes for Generation of
Ultrasonic Tomography in Wood Logs, (in Portuguese). Master thesis, UNICAMP.
Zeng, L., Lin, J., Hua, J., & Shi, W. (2013). Interference resisting design for guided wave tomography. Smart materials
and structures, 22(5), 055017.
62You can also read