Emissivity-Free Thermometer Using Principal Component Analysis and Its Application
←
→
Page content transcription
If your browser does not render page correctly, please read the page content below
JFE TECHNICAL REPORT
                                                                                                                      No. 26 (Mar. 2021)

Emissivity-Free Thermometer Using Principal
Component Analysis and Its Application
KEMMOCHI Mitsutoshi*1  OSHIGE Takahiko*2  TSUDA Kazuro*3

Abstract:                                                                ment in sections where the strip travels in a horizontal
    Various heating processes are used in a steel works.                 or vertical path. In environments where emissivity is
However, emissivity compensation is still one of the most                not an issue, general-purpose radiation thermometers
difficult problems when radiation thermometers are                       are used after first setting emissivity, but accurate strip
applied to temperature measurements of heated sheets in                  temperature measurement is not possible in environ-
steel manufacturing processes. JFE Steel proposes a new                  ments such as annealing furnaces, etc. where emissivity
technique using spectral information of radiation from                   deviation occurs. Because there are also many other
targets and principal component analysis (PCA). Tem-                     steel manufacturing processes where accurate tempera-
peratures are calculated from the principal component                    ture measurement is impossible due to emissivity devia-
which is predetermined so that its scores change with                    tion, development of a radiation temperature measure-
temperature and are minimally affected by the deviation                  ment technology which is not affected by emissivity
of spectral emissivity. The developed thermometer was                    deviation had been desired.
installed at an annealing furnace in the stainless steel                     Against this background, JFE Steel proposed and
manufacturing process. As a result, it was found that the                developed a new measurement method to realize accu-
standard deviation and the maximum error of the devel-                   rate temperature measurement in environments with
oped radiation thermometer from the values measured                      emissivity deviation 3). As a feature of the new method,
by thermocouples were less than those of an ordinal sin-                 the light radiated from the measurement target is mea-
gle-wave thermometer.                                                    sured, and a multivariate analysis technique such as
                                                                         principal component analysis (PCA) is applied to the
                                                                         spectral radiation acquired by spectrally dispersing the
1. Introduction
                                                                         radiated light. Concretely, a spectral component which
    Because temperature is one of the critical parame-                   is minimally affected by emissivity deviation is obtained
ters which determine the properties of steel products,                   in advance by multivariate analysis, and the tempera-
temperature measurements are performed at various                        ture is then calculated from the score of that spectral
points in steel manufacturing processes. As temperature                  component, which is included in the radiation spectrum
measurement technologies for steel strips in the cold                    of the measurement target, by using a predetermined
rolling and coating processes, thermometer rolls 1)                      calibration curve. The spectral component which is
using the assumption that temperature of the roll and                    minimally affected by emissivity deviation is obtained
the steel strip are the same, and multiple reflection type               by using a vector with a condition orthogonal (inner
radiation thermometers 2), which utilize the wedge                       product; that is, the product sum of the wavelength
between the roll and strip, are used in measurements at                  components is zero) to the deviation of spectral emis-
points where the strip in wound around a roll. How-                      sivity, which has been evaluated in advance by PCA,
ever, these technologies cannot be applied to measure-                   etc.

†                                                                                  *2
    Originally published in JFE GIHO No. 45 (Feb. 2020), p. 8−13                        General Manager,
                                                                                        Sensing System & Analysis Technology Center,
                                                                                        Sensing & Process Solution Division,
                                                                                        JFE Techno-Research

              *1                                                                   *3
                   Senior Researcher Deputy Manager,                                    Staff General Manager,
                   Cyber-Physical System Research & Development Dept.,                  Data Science Project Dept.,
                   Steel Res. Lab.,                                                     JFE Steel
                   JFE Steel

                                                                                                                                      9
Copyright © 2021 JFE Steel Corporation. All Rights Reserved.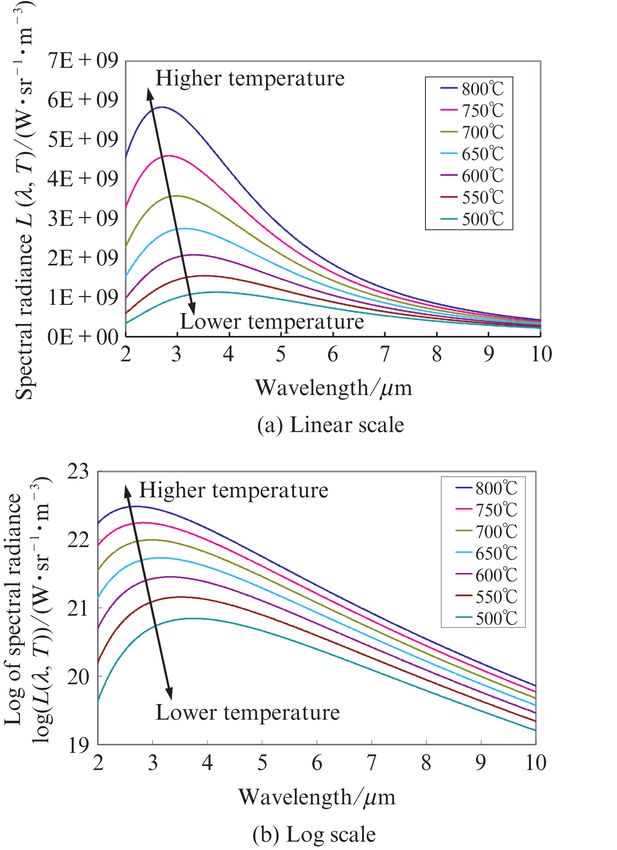
Emissivity-Free Thermometer Using Principal Component Analysis and Its Application
This paper describes the principle of the new mea- (λ , T) can be estimated by using the fact that the form
surement method (hereinafter, spectral principal com- of log g (λ ) is different from that form.
ponent thermometer) and reports an example of its In Eq. (3), it is supposed that ε 0 (λ ), for example, is
application to an actual production line. the average spectrum of variable emissivity, and g (λ ) is
the deviation from that average value. Therefore, if it is
assumed that ε 0 (λ ) 1, it is also possible that all emis-
2. Issues of Radiation Temperature
sivity deviations may be included in g (λ ). However, if
Measurements and Features of Developed the average spectrum of emissivity is used as ε 0 (λ ), the
Technology features of the spectra of emissivity deviations can be
The measured spectrum L (λ , T) obtained with grasped more accurately, and the true form of LB (λ , T)
radiation thermometers that measure the conventional can be estimated.
radiation temperature T (K) is the product obtained by When using the conventional radiation temperature,
multiplying the spectral radiance (energy) LB (λ , T) of an appropriate wavelength was selected corresponding
a blackbody by emissivity ε (λ ), as shown in Eq. (1). to the measurement target and temperature, but in this
study, a wider wavelength region was actually mea-
L ( λ , T ) = ε ( λ ) ⋅ L B ( λ , T ) ������� (1) sured, and the spectral shape was obtained by spectros-
copy. PCA was studied as a technique that focuses on
where, λ is wavelength and LB (λ , T) is Planck’s law this spectral form. The following chapter presents a
given by Eq. (2). detailed explanation of the application of PCA.
2c 1 1
L B ( λ ,T ) = 3. Application of Principal Component Analysis
λ5 c2 ������ (2)
exp − 1 to Radiation Thermometry 3)
λT
where, c1, c2 are physical constants. 3.1 Principal Component Analysis
In the case of the conventional radiation tempera- First, PCA will be explained 4).
ture measurement, the temperature is obtained by solv- As an example, consider a distribution map of the
ing the equation in (1) on the assumption, for example, height and weight of the members of a certain group,
that ε (λ ) is constant in the case of a single-wave ther- as shown in Fig. 1. Because it can generally be said that
mometer, and that ε (λ 1) = ε (λ 2) for the emissivity of taller persons also weigh more, this distribution map
measured wavelengths λ 1 and λ 2 in a double-wave ther- has a positive slope of the distribution. The diagonal
mometer. However, temperature error may occur line rising to the right inserted in the figure passes
because these hypotheses are not strictly materialized. through the center of this distribution and is, as it were,
In this paper, radiation temperature (λ , T) is a measure of “body size.” PCA is a technique for sta-
described in a divided form, in that emissivity ε (λ ) is tistically deriving a representation of the essential
expressed by an assumed value of emissivity ε 0 (λ ), interpretation of this combined data of height and
which is posited in advance, and the variable compo- weight (2-dimensional) by a 1-dimensional scale, in this
nent of emissivity, which can change depending on case, “body size.” Although the example in Fig. 1 con-
operating conditions or other factors, is expressed by a cerns 2-dimensional data, this technique has the effect
multiplier g (λ ): of reducing dimensionality as the original number of
dimensions of the data becomes larger.
L ( λ , T ) ≡ ε 0 ( λ ) ⋅ g ( λ ) ⋅ L B ( λ , T ) ����� (3)
If both sides of Eq. (3) are deformed by taking their
logarithms, Eq. (4) is obtained.
( )
log L B ( λ , T ) = log L ( λ , T ) ε 0 ( λ ) − log g ( λ )
������������������ (4)
Although there is a possibility that the log LB (λ , T)
calculated by the right side of Eq. (4) may include error
originating from g (λ ), the form that log LB (λ , T) can
take is inherently determined as shown by Eq. (4). Fig. 1 Distribution map of the weight and the height and
Therefore, it was thought that the true form of log LB principal components
10 JFE TECHNICAL REPORT No. 26 (Mar. 2021)
Emissivity-Free Thermometer Using Principal Component Analysis and Its Application

 Fig. 2 Schematic of n-dimensional description of spectral
         radiation and its principal components

   Expressed mathematically, the “body size” in this
example is the 1st principal component, and the next
essential information following this 1st principal com-
ponent, which is orthogonal to the 1st principal compo-
nent, is the 2nd principal component. In physical terms,
the 2nd principal component in Fig. 1 is a scale called
the “obesity index.”

   3.2 Application of Principal Component
       Analysis to Radiation Spectrum                                        Fig. 3   Spectral radiance from black body

    In the example in Fig. 1, the original 2-dimensional
information (height and weight) is reduced to 1-dimen-             the essential spectral information (spectral component)
sional information, i.e., “body weight,” by PCA. If this           of the initial 7 items of spectral information for the
information processing technique for extracting the                blackbody radiation energy.
essence is applied to the spectral waveform in tempera-                In order to verify that this low-dimensional princi-
ture estimation, the essential changes in the radiation            pal component information is in fact the essential spec-
spectrum accompanying temperature changes can be                   tral information (spectral component) of the initial 7
extracted from the information of a number n of wave-              items of spectral information, the initial spectral radia-
lengths. In this case, as shown in Fig. 2, the wavelength          tion for the 7 temperature levels was recomposed from
information (spectrum) for a wavelength n is expressed             the spectral component. Figure 4 shows the degree of
as one point in an n-dimensional space having the same             fit obtained by recomposition of the spectral radiation.
number of dimensions as the number n of measured                   Here, recomposition means a product sum calculation,
wavelengths. For example, assuming that spectral radia-            that is, a linear operation, in which the base vector is
tion data of n wavelengths are given for 7 temperatures,           multiplied by a constant factor, and in case of multiple
7 points are given in the n-dimensional space. Consid-             base vectors, the base vectors multiplied by the con-
ering the spread of the distribution of these 7 points in          stant factor are added together. The coefficient of this
the n-dimensional space, the direction with the largest            process is called a score, and is obtained by calculating
spread is defined as the direction of the 1st principal            the inner product of the initial waveforms and their
component. This is the most essential information for              respective base vectors (integrated by totaling for each
differentiating the above-mentioned 7 points, that is,             wavelength).
for differentiating temperatures.                                      The degree of fit after recomposition changes
    Next, let us try actually applying PCA to spectral             depending on the degree of correspondence of the low-
radiance data. PCA is applied to the result (Fig. 3(b))            dimensional base vector information to the initial 7
of performing a log operation on the spectral radiance             optical spectra. Fig. 4(a) shows the result of recompo-
of a blackbody L B (λ , T) obtained by measuring a                 sition by only the 1 st principal component, and
blackbody furnace with temperatures of 7 levels from               Fig. 4(b) shows the result of recomposition including
500˚C to 800˚C shown in Fig. 3(a) and, for example,                the 2nd principal component. It can be understood that
the 1st and 2nd principal components are obtained. This            all 7 optical spectra are recomposed extremely well if
low-dimensional principal component information is                 the 2 nd principal component is also used. In other

JFE TECHNICAL REPORT No. 26 (Mar. 2021)                                                                                  11
Emissivity-Free Thermometer Using Principal Component Analysis and Its Application

                                                                     Fig. 5 Schematic concept of new thermometry technique
                                                                             using principal components

                                                                   known in advance, and a PCA of that emissivity devia-
                                                                   tion data is carried out to obtain the principal compo-
                                                                   nents of that emissivity deviation. Here, the obtained
                                                                   principal component of emissivity deviation expresses
                                                                   the statistical behavior of the emissivity deviation of
                                                                   the measurement target. Conversely, it can be said that
                                                                   the vectors orthogonal to the principal component vec-
                                                                   tor of emissivity deviation are all virtually unaffected
                                                                   by emissivity deviation.
                                                                       Therefore, the essential information of reaction
 Fig. 4 Recomposition of spectral radiation using principal
                                                                   energy can be extracted, virtually unaffected by emis-
         components
                                                                   sivity deviation, by performing a PCA of spectral radi-
                                                                   ance, under the restriction that it must be orthogonal
words, this means that it is not necessary to express              to the principal component of emissivity deviation. As
each optical spectrum by wavelength information for n              the concrete procedure, after removing the principal
points, i.e., the coordinates for n dimensions, but rather,        component of emissivity deviation from the spectral
if two base vectors are decided in advance, this can be            radiance spectrum in advance, PCA is conducted by
expressed simply by the two points of information                  the normal method. If a normal PCA can be con-
(scalar quantity) of two coefficients (scores) for its lin-        ducted, the principal components that are obtained
ear sum. To put it yet another way, it can be said that            will, in all cases, be orthogonal to the principal compo-
n-dimensional data were compressed to 2-dimensional                nent of emissivity deviation.
data. Although the number of dimensions is greatly                     Accordingly, a temperature measurement method
reduced by the process, it is important that the spectral          which is minimally affected by emissivity deviation can
radiation is recomposed by the essential spectral wave-            be realized by focusing on the principal component of
form, that is, the “base vector.”                                  the radiation energy orthogonal to the principal com-
    Using this fact, the following considers a method              ponent of emissivity deviation, and using the spectral
that is minimally affected by external disturbances, i.e.,         radiance spectrum and the score of its principal com-
emissivity deviation, as described previously.                     ponent.
                                                                       This will be explained using Fig. 5. Planck’s law is
      3.3 Proposal of Spectral Principal Component                 expressed as one curved line in an n-dimensional space,
          Radiation Thermometer Unaffected by                      as shown in Fig. 5. If the measured spectrum L (λ , T)
          Emissivity Deviation                                     and the emissivity spectrum ε 0 (λ ) are obtained accu-
   Section 3.2 described the basic concept of PCA of               rately, L (λ , T) / ε 0 (λ ) should be positioned on that
optical spectrum data. The following further considers             curve. However, in reality, the results will be measured
a method for applying PCA in order to avoid the effect             at positions that deviate from the curve due to the devi-
of emissivity deviation of the measurement target. In              ation g (λ ) of emissivity, resulting in temperature error.
the above Eq. (2), it is assumed that the behavior of the          Thus, if the principal component of emissivity devia-
emissivity deviation g (λ ) of the measurement target is           tion g (λ ) is obtained ( in Fig. 5) temperature mea-

12                                                                               JFE TECHNICAL REPORT No. 26 (Mar. 2021)
Emissivity-Free Thermometer Using Principal Component Analysis and Its Application
surement that is minimally affected by emissivity devia-
tion will become possible as the number of principal
components of spectral radiance ( in Fig. 5) orthogo-
nal to the principal component of g included in the
measured data becomes larger.
4. Example of Application to Actual Equipment
4.1 Measurement of Strip Temperature in
Annealing and Pickling Line for Stainless
Steel Fig. 6 Configuration of developed thermometer
The annealing and pickling line for stainless steel is
a line which performs annealing and pickling of cold-
rolled stainless steel strips. Although control of the
strip temperature is important for building quality into
products, accurate measurement of the strip tempera-
ture with conventional radiation thermometers was not
possible due to the emissivity deviation caused by
growth of an oxide film on the strip surfaces during
annealing.
Therefore, in the past, annealing cycle design (design
of the furnace temperature pattern) was performed by
using the strip temperature estimated by a heat trans-
mission model calculation. For this reason, the allow-
able range of strip thickness changes and changes in
the furnace temperature pattern were set conservatively,
because there was a high possibility that the strip tem- Fig. 7 Actual equipment of manufacturing line
perature would exceed the allowable range in the tran-
sient state during changes in the strip thickness or fur-
nace temperature pattern. In cases where the strip is a system which scans one dimension as the width
temperature exceeded this allowable range, material direction of the steel strip and measures wavelength
quality defects were avoided by passing dummy strips, information in the other dimension. The information
but the decrease in productivity due to use of dummy for the width direction is averaged, and only one point
strips was an problem. is output as spectral radiation.
To solve this problem, the authors studied applica- With the contact-type thermometer, the strip tem-
tion of the spectral principal component thermometer perature is measured by intermittently pressing a ther-
to the stainless steel annealing and pickling line. The mocouple against the steel strip. This thermometer is
effectiveness of this technology was verified by simula- used to acquire data for determining the principal
tions, sample tests and actual equipment tests, and the component which is to be used, and also in periodic
thermometer was installed as actual equipment 3, 5–7). calibrations.
The actual temperature measurement procedure is
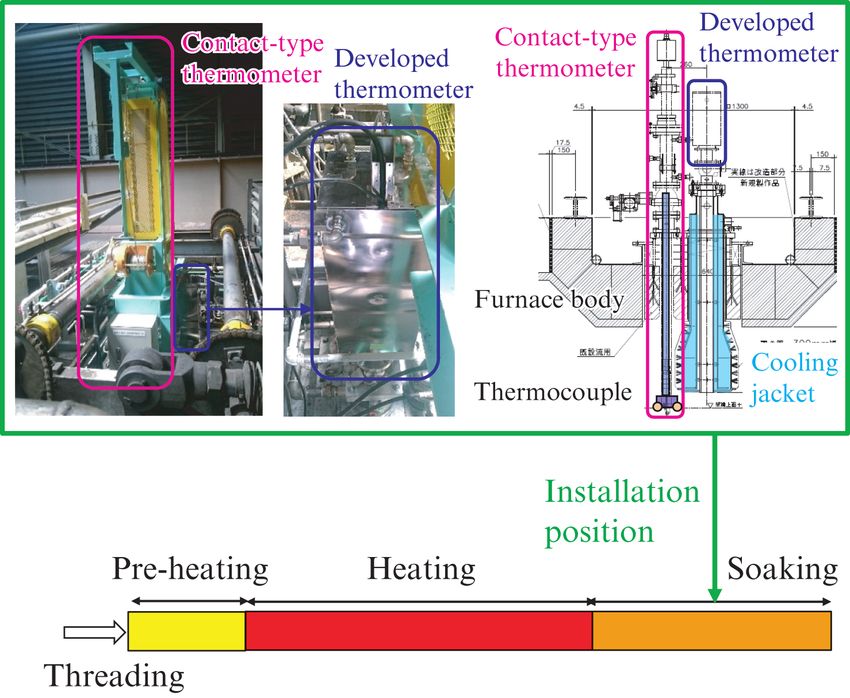
4.2 Equipment Outline 8) as follows: First, the spectral radiation of a blackbody
The spectral principal component thermometer and furnace corresponding to multiple temperatures is
a contact-type thermometer were installed at the exist measured off-line in advance. Next, as much data as
side of the heating zone of the annealing furnace. The possible on the temperatures and their corresponding
configuration of the spectral principal component spectral radiation is acquired by using the contact-type
thermometer and the outline of the equipment are thermometer, and the average emissivity, emissivity
shown in Fig. 6 and Fig. 7, respectively. The hardware deviation and their principal components are calculated
of the spectral principal component thermometer com- from the acquired data. Following this, a second princi-
prises mainly a CCD camera, spectrometer and lens. pal component analysis of the spectral radiation of the
The spectrometer contains slit and prism-grating-prism blackbody furnace is conducted, this time excluding
dispersive elements, and spectral diffraction is done by the principal component of emissivity deviation. The
passing light through these elements. The CCD camera principal components to be used in temperature mea-
JFE TECHNICAL REPORT No. 26 (Mar. 2021) 13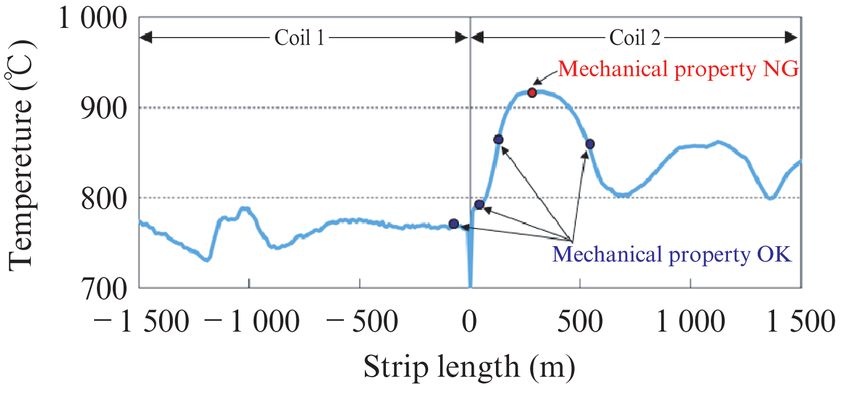
Emissivity-Free Thermometer Using Principal Component Analysis and Its Application

                                                                      Fig. 9 Change of annealing conditions in test of developed
                                                                              thermometer

Fig. 8 Comparison of temperatures measured by developed
        and conventional thermometers
                                                                     temperature and material property test results. Control
                                                                     standards were set through this series of experiments,
                                                                     and quality control by the actual strip temperature has
surements are decided, and a calibration curve is pre-               now become possible, even during cycle changes.
pared based on the relationship between the principal
component scores and temperatures. This procedure
                                                                     5. Conclusion
enables continuous measurement of the strip tempera-
ture by the spectral principal component thermometer.                    A new temperature measurement technique using
                                                                     spectral radiance and multivariate analysis, which is
      4.3 Results                                                    minimally affected by emissivity deviation, was pro-
    Data were collected using the contact-type ther-                 posed. The developed thermometer was installed in the
mometer, and the principal components to be used                     annealing furnace of a stainless steel annealing and
were adjusted based on those data. A calibration curve               pickling line, and the results confirmed that maximum
was prepared using only the wavelength of 0.9 μ m and                error and standard deviation were both smaller than
the measured temperature values calculated using the                 with the conventional single-wave radiation thermome-
principal components, and the measured values                        ter. In the future, development of this technology to
obtained with a conventional single-wave thermometer                 other steel manufacturing processes is planned.
and the developed spectral principal component ther-
mometer were compared. In this comparison, the emis-                 References
sivity of the conventional thermometer was set to mini-               1) Seriu, H.; Mashino, Y.; Nakajima, Y.; Ogawa, H. Strip tempera-
mize error, and measured values of the developed                         ture measurement by measuring roll for continuous annealing
thermometer were calculated in the same manner. The                      line. Tetsu-to-hagane. 1993, vol. 79, no. 7, p. 765–771.
                                                                      2) Yamada, T.; Makabe, E.; Harada, N.; Imai, K. Development of
results of this comparison are shown in Fig. 8.                          radiation thermometry using multiple reflection. Nippon Kokan
Although the maximum error of the spectral principal                     Technical Report. 1984, no. 103, p. 92–100.
component thermometer was 18.6˚C with a standard                      3) Oshige, T.; Tsuda, K. New technique for emissivity free tempera-
                                                                         ture measurement applying multivariate analysis to spectral radi-
deviation σ = 7.2˚C, the maximum error and standard                      ation. T.SICE. 2017, vol. 53, no. 7, p. 377–384.
deviation of the conventional single-wave radiation                   4) Okuno, T.; Haga, T.; Yajima, K.; Okuno, C.; Hashimoto, S.;
thermometer were 31.6˚C and σ = 13.1˚C, respectively.                    Furukawa, Y. Multivariate statistical analysis (second series). 8th
                                                                         ed., Nikkagiren-Shuppan Co. Ltd., 1976, 299 p.
Thus, this experiment demonstrated that the maximum                   5) Oshige, T.; Tsuda, K. New technique for temperature measure-
error of the spectral principal component thermometer                    ment using spectral radiation and multivariate analysis. Proceed-
is far smaller than that of the conventional single-wave                 ings of 33th SICE Sensing Forum. 2016.
                                                                      6) Oshige, T. New technique for emissivity free temperature mea-
thermometer.                                                             surement applying multivariate analysis to spectral radiation - Its
    Based on these results, the spectral principal com-                  basic characteristics -. Proceedings of 34th SICE Sensing Forum.
ponent thermometer was applied in the standard man-                      2017.
                                                                      7) Oshige, T.; Asakura, S.; Isobe, T.; Koshihara, T. Temperature
ufacturing process. Figure 9 shows the results of the                    measurement technique using hyperspectral camera and multi-
strip temperature and mechanical property tests during                   variate analysis and its application to steel manufacturing pro-
a certain annealing cycle change. Following the mate-                    cesses. TEMPMEKO2016. 2016, P4.11.
                                                                      8) Kemmochi, M.; Oshige, T.; Hirota, S.; Hatano, N. Emissivity-
rial change, the result of the mechanical property test                  free thermometer using hyperspectral camera and multivariate
was failure in the portion where the temperature                         analysis and its application to steel manufacturing processes.
increased, confirming the relationship between the strip                 Proceedings of SPIE vol. 11028, Optical Sensors 2019. 2019.

14                                                                                     JFE TECHNICAL REPORT No. 26 (Mar. 2021)
                                              Copyright © 2021 JFE Steel Corporation. All Rights Reserved. Unauthorized reproduction prohibited.
You can also read