BRIDGE MEASURING CIRCUITS IN THE STRAIN GAUGE SENSOR CONFIGURATION
←
→
Page content transcription
If your browser does not render page correctly, please read the page content below
FACTA UNIVERSITATIS
Series: Mechanical Engineering Vol. 11, No 1, 2013, pp. 75 - 84
BRIDGE MEASURING CIRCUITS IN THE STRAIN GAUGE
SENSOR CONFIGURATION
UDC 621.317.39
Jelena Manojlović, Predrag Janković
University of Niš, Faculty of Mechanical Engineering, Serbia
Abstract. In engineering sciences student education, electrical measurement of mechanical
quantities can often be found. It is also widely used in engineering applications force
measurements, particularly in machine tools. Load sensors, which are frequently used in
mechanical engineering research, use strain gauges, bonded to a metal beam, to measure
bidirectional force. The applied force induces extremely small changes in the resistance of
strain gauges. In order to measure strain with a bonded resistance strain gauge, they must be
connected to an electrical bridge measuring circuit. Strain gauge transducers usually employ
four strain gauge elements, electrically connected to form a Wheatstone bridge circuit. The
aim of this paper is to present the strain gauge conjunction with various measuring circuits,
especially in Wheatstone bridge configuration. Also, the model for student education in the
field of electrical measurement will be presented.
Key Words: Measurements, Strain Gauge Sensor, Measuring Circuits,
Wheatstone Bridge, Student Education
1. INTRODUCTION
The study of material properties under the working conditions is very important in en-
gineering research since the mechanical properties of materials are influenced by stress
application. Stress in a material cannot be measured directly. Therefore, in the stress
analysis, the measured strain is combined with the other properties of the material so as to
calculate the stress for a given load. In order to understand the behavior of used materials,
it is very important to know the stress, as well as the strain, and their influence on de-
signed machine part [1]. Based on various mechanical, optical, acoustic and electrical
phenomena, there are numerous methods for measuring strain or deformation.
Received December 20, 2012
Acknowledgements. This paper is part of the technological project TR35034 at the University of Nis, Faculty
of Mechanical Engineering, and is supported by Ministry of Education, Science and Technological Development of
the Republic of Serbia.
Corresponding author: Jelena Manojlović
University of Niš, Faculty of Mechanical Engineering, Aleksandra Medvedeva 14, 18000 Niš, Serbia
E-mail: jmanojlo@gmail.com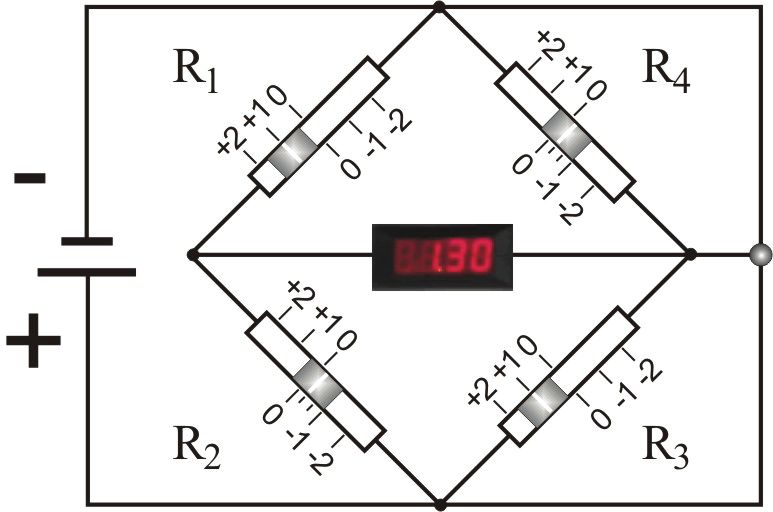
76 J. MANOJLOVIĆ, P. JANKOVIĆ
An extensometer, developed in the 1800s, like the other initial devices for strain
measurement, was mechanical in nature. This mechanical device is applied in materials
testing, as well as the scientific research, to measure changes in the length of an object
[2]. There are several optical methods for strain measurement [3]. Some of them use the
interference fringes [4], photostress [5] or photoelasticity [6]. Defined as a sensor, whose
resistance varies with applied force, the most frequent method of measuring strain, in-
volving the mechanical engineering and electrical engineering, is a strain gauge (SG) [7].
It converts force, pressure, tension, weight, etc., into a change in electrical resistance. But,
measuring a very small resistance change in a strain gauge (mΩ) with an ohmmeter is
usually difficult. Therefore, the Wheatstone bridge, with strain gauges in one or more of
the four arms of the bridge, is widely used in practice [8].
The history of SG manufacturing is very long. This device is applied in many fields,
from the material testing applications, to numerous areas in experimental measurement
technology. The main area of the strain gauges application is an experimental stress
analysis [7], such as its use in civil engineering. Considering the fact that the distribution
of strain on the tension zone is not uniform, the load-testing of highway bridges is nowa-
days a very important procedure. What is described here is the design and testing of a
simple and accurate transducer for strain measurement of one particular bridge. [9].
There are different types of SG, different in construction and technical specification,
applied in medicine, such as models for determining force and load curves in dental and
oral medicine [10], used to evaluate stresses in implant-supported prostheses, in vivo and
in vitro, under static and/or dynamic loads [11]. Force platforms are widely used in bio-
mechanical estimation of human movement, especially in walk analysis [12]. Within the
last decade, much experimentation on skeletal muscle has been undertaken, and one of the
developed methods was based on a novel capacitive strain gauge (CSG) [13]. All the
above-mentioned applications speak in favor of a wide use of strain gauges.
In this paper we discuss applying a strain gauge, together with a Wheatstone bridge, to
measure (i.e. calculate) force or load. In addition to several electrical circuits, used in
strain measurements, the principles of the Wheatstone bridge circuit and the strain gauge
are explained. The model designed for laboratory use, with a description of the experi-
ment used in student education, has been described.
2 THEORY
Strain and stress definition: The results of an external force application to a station-
ary object are stress and strain. If we consider a wire fixed to the top (Fig. 1), with origi-
nal cross-sectional area of the wire (A), and original wire length (L), due to applied force
(F), the wire stretches vertically. Stress (called an axial stress) is defined as the mate-
rial's internal resistance.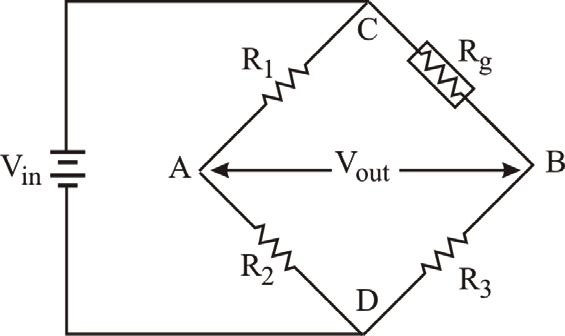
Bridge Measuring Circuits in the Strain Gauge Sensor Configuration 77
a) b)
Fig. 1 The wire before (a) and after force application (b)
F
(1)
A
With the applied force, the wire length increases (L), the cross-sectional area
decreases (Fig. 1), and the deformation that occurs, defines axial strain :
L
(2)
L
There are tensile strain (elongation) with sign (+), or compressive strain (contraction)
with sign (-). Compressed in one direction, a material usually tends to expand in the other
two directions, perpendicular to the direction of compression. This phenomenon, called
the Poisson effect, is characterized by the Poisson ratio (for most metals around 0.3).
The relationship between stress and strain, for elastic materials, can be described by
Hooke's law:
E (3)
where E is Young's modulus, also called the modulus of elasticity. We will consider only
the elastic stress region [1].
The same wire (Fig. 1) of length L, cross-section area A and resistivity of the wire
material has electrical resistance R:
L
R (4)
A
The fact that the resistance of a conductor changes when the conductor is exposed to
strain is essential for the strain gauges application. With strain, the electrical resistance of
wire will change, and the wire (Fig. 1.b), according to the equation (4), has higher
resistance because it is longer and thinner. In real application, the strain gauge resistance
will change not only due to deformation of the surface to which the sensor is attached, but
also because of the influence of some other parameters, such as temperature or material
properties [14].
The relationship between strain and resistance variation is almost linear, and the
constant of proportionality is known as the "sensitivity factor":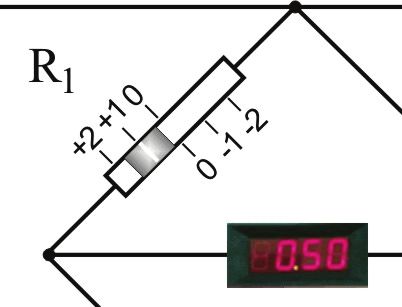
78 J. MANOJLOVIĆ, P. JANKOVIĆ
R R R R R
G or G (5)
L L R
where: G sensitivity factor, R initial resistance, R change in resistance, L initial
length, L change in length. A typical value for G, known as the ‘gauge factor', is
around 2 for commercially available strain gauges [1]. Since in practice resistance change
R is very small, and ratio R/R for typical 120 strain gauges can be between 10-3 and
10-6 [1], it is very difficult to use ohmmeter for direct, precise measurement of such a
small resistance change. Therefore, there is a need to design an electronic circuit to
measure the change in resistance, preferably to the resistance itself. The most widely used
electric circuit, with the ability to accurately detect small changes in resistance, is the
Wheatstone bridge.
Bridges used for strain measurements
Beside the Whetstone bridge, there are some other electric circuits, the measuring
bridges, with the ability to detect very low resistance.
Kelvin double bridge or Thomson bridge or Four–wire Ohm circuit. This bridge
is a modification of the Wheatstone bridge circuit, used to measure resistance in the range
from 1Ω to 0.00001Ω. With this bridge, it is possible to overcome the limitations of the
Wheatstone bridge in determining very low values of resistance, taking into account the
effect of contact resistances, and the resistances of the wires, used to connect the elements
in the electric circuit, which is usually neglected. The operation of the Kelvin bridge is
similar to the Wheatstone, except for the presence of additional resistors and the
configuration of the bridge are arranged to essentially reduce measurement errors. The
change in absolute value of gauge resistance to compute strain can be measured very
accurately, using a four-wire ohms measurement technique with high digital multimeter
(Fig. 2).
Fig. 2 Four wire Ohm circuit Fig. 3 Schematic view of Chevrone bridge
The Chevron bridge. For strain measurements on rotating machines, the Chevron
bridge (Fig. 3) can be applied.
These two bridges are described in more details in the literature [14].
The Wheatstone bridge. The Wheatstone bridge (WB) (Fig. 4) is one of the most
sensitive and precise methods, with the ability to measure small changes in resistance,
which makes it frequently used nowadays for strain measurements [8,14]. In a simple
Wheatstone bridge circuit, input voltage (Vin) is applied across the bridge with four
resistors, while in the middle of the bridge (between points A and B) output voltage (Vout)
is measured. When Rg is the resistance of the strain gauge and R1, R2 and R3 are theBridge Measuring Circuits in the Strain Gauge Sensor Configuration 79
resistors in the bridge, this bridge configuration is called a quarter-bridge (Fig. 4). In
general, if we define n as the number of active gauges in the WB, n=1 for a quarter
bridge, n=2 for a half bridge and n=4 for a full bridge.
Fig. 4 The Wheatstone bridge circuit
Considering the strain gauge, Rg, as the only variable resistor, due to a change in
strain on the surface of the sample to which it is attached [14], after the circuit analysis,
the relation between the output and the input voltage is given by the equation:
R3 R2
Vout Vin (6)
Rg R3 R2 R1
When Rg/R3=R1/R2, output voltage is Vout=0 and the bridge is called balanced. When
the gauge change their resistance to R1+R1, R2+R2, R3+R3, R4+R4, the relation
between input and output voltage of four-gauge system, frequently applied to strain-gauge
transducers, is as follows:
1 R1 R2 R3 R4
Vout Vin (7)
4 R1 R2 R3 R4
This result, according to equation (5), indicates that the output voltage only depends
on the gauge factor and strain.
For a quarter and a half bridge the relations for Vout are described in details in the
literature [15].
In the classic Wheatstone bridge configuration, three out of four resistors are with
fixed resistance value, while one is variable. The variable resistor is the sensing element
(transducer), and it allows its resistance to change due to a change in an external factor,
such as stress, pressure, or temperature [15].
The aim of this work is the development and use of the model for force measuring
bridge, on the basis of resistance elements. The model we have made should be suitable
for the laboratory applications, especially in the measuring of mechanical quantities by
electrical means.
3. MATERIALS AND METHODS
The Wheatstone bridge model described in this paper consists of four variable
resistance elements (R1 to R4), representing a strain gauges. Strain gauges are resistant80 J. MANOJLOVIĆ, P. JANKOVIĆ
measuring elements, bounded (i.e. glued) to the elastic measuring element, which is
loaded by force. Force application causes the deformation of the elastic element, as well
as the simultaneous change of strain gauges dimensions. The deformation of the strain
gauges leads to an increase or decrease in their resistance, compared to nominal. This
characteristic of strain gauges, in our example, is provided by variable potentiometers
(resistors).
The electrical connection
In order to build the model, linear slider resistors with maximum resistance of 1kΩ,
power of 0.3 W and the highest allowed input current of 0.35 A. have been used. On the
model, shown in Fig. 5a, the initial position of the slider of the potentiometer on the scale
is marked with zero (0). It is a position corresponding to unloaded state, when the
resistance of strain gauges is equal to their nominal value. In this example, all the four
resistors have in initial position resistance of 400 Ω. Depending on the direction of the
external loads (forces), there may be either the contraction or the elongation of the strain
gauges, which respectively leads to a decrease or increase of their resistance. Marks on
the scale, next to resistors, indicate increase (+1 and +2) or decrease (1 and 2) of
resistance. It is chosen that each mark on the scale corresponds to an equal change in
resistance of ΔR = 100 Ω.
The resistors are connected in a Wheatstone bridge. Bridge input voltage (Vin) of 8 V
is provided by a standard 220 V adapter to 12/24 V, using voltage stabilizer 7808CT and
7805CT. The output voltage is measured with a digital voltmeter. In order to facilitate the
balancing of the bridge in unloaded (initial) state, parallel with resistors R3 and R4, another
variable resistor is connected. Its maximum resistance is 10 kΩ and its fine adjustment is
possible by 15-turn gear drive. Block diagram of the system is shown in Fig. 5b.
a) b)
Fig. 5 Model of the Wheatstone bridge and the corresponding block diagram
From equation (Eq. 6), in the case that all the elements in the Wheatstone bridge have
the same resistance, it follows that the value of the output voltage is equal to zero (Vout =
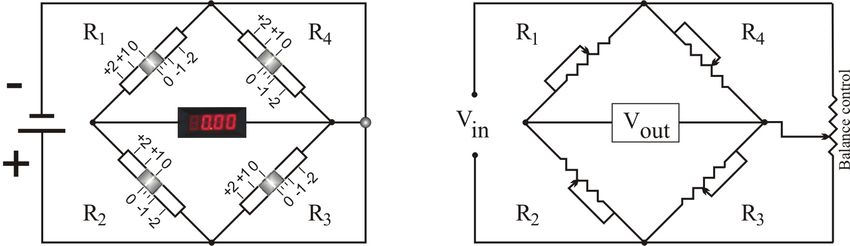
0). A change in the resistance, for example, R1, produces an imbalance of the bridge, that
is, the appearance of the output voltage. The result of bringing resistors R1 in a position
+1 on the scale, is the increase of its resistance to ΔR1 = 100 Ω, and the appearance of the
corresponding output voltage (Fig. 6).Bridge Measuring Circuits in the Strain Gauge Sensor Configuration 81
Vout 1 R1 Vout 1 100
, ,
Vin 4 R1 8V 4 400
(8)
Vout 1 1 1 8V
Vout 0.5V
8V 4 4 16 16
Fig. 6 Increase of resistance R1 and the appearance of the corresponding output voltage
On the other hand, reducing the value of resistance R1 (for example position 1 on
scale) will lead to the appearance of output voltage Vout = 0.5V.
Gauge factor
Strain gauges are used in situations where we want to determine strain (ε) on element
loaded by force. The corresponding value of deformation leads to changes in the
resistance of strain gages. In order to define the strain by the resistance change, the
sensitivity factor (gage factor G) of the strain gauge material must be determined.
In industrial measuring strain gages, the sensitivity factor is predetermined and known.
For example, for the strain gauges made of constantan, the gauge factor is G = 2.
However, in our model, the value of G is unknown and must be calculated.
On the model, one mark on the scale corresponds to the change of resistance
ΔR=100Ω. Suppose that the change is caused by strain ε = 0.1. Taking the previous
assumption into account, the gauge factor can be determined by the calculation below:
R 100 1 1 10
G , G 0.1, G G 2.5 (9)
R 400 4 10 4
Use of the model in the case of tensile forces
Under the influence of the mechanical forces on some element, the resistance that
opposes the effect of external load, occurs in the material. This resistance is called stress.
The stress values cannot be measured, but can be calculated from the strain. The
procedure of using measured deformation to determine the stress in the material, that is,
the force acting on the element, will be presented in the example of uniaxial stress state.
Consider a rod loaded with tensile forces (Fig. 7).
Fig. 7 Rod loaded with tensile forces Fig. 8. Bridge configuration for uniaxial tensile load82 J. MANOJLOVIĆ, P. JANKOVIĆ
Tensile force F leads to elongation of the rod in the direction of the load. At the same
time, normal stress appears in rod material (σ). This stress is proportional to the tensile
force and the cross-sectional area:
F
(10)
A
where: F tensile force and A cross sectional area
To measure the value of tensile strain, and reject possible bending strain, four active
strain gages are bounded on the surface of the rod (two in the direction, and two
perpendicular to the direction of the force). They are electrically connected to form a full
Wheatstone bridge, as shown in Fig. 8.
From the equation 7, according to equation (5) it follows:
G
Vout (1 2 3 4 ) Vin (11)
4
For configuration displayed in Fig. 8, where two strain gauges (R1 and R3) are
elongated, and the other two (R2 and R4) compressed, there follow deformation values:
1 3 , 2 4 (12)
where: ε local deformation (strain) in the direction of the force, µ coefficient of lateral
contraction (Poisson ratio); for steel μ = 0.3.
Substituting the above values, equation (11) takes the form:
Vout G G
[ ( ) ( )] 2.6 (13)
Vin 4 4
The above equation allows calculation of strain value based on both known and
measured electrical quantities:
Vout 4 1
(14)
Vin G 2.6
Using strain-stress relationship (Eq. 3), the stress value can be determined, i.e. force
acting on the rod. For a known value of the strain, material type (E Young's modulus)
and cross-sectional area, force can be calculated by the formula:
F V 4 1
E F A E A E out (15)
A Vin G 2.6
Assume, for example, that an unknown force (F) causes the rod elongation of ε = 0.1.
Under the load and according to the Wheatstone bridge configuration in Fig. 8, the
following layout is set on the model: resistances R1 and R3 are higher (position +1), while
the value of resistance R2 and R4 are smaller (position - 0.3), compared to nominal
(unloaded condition).
In the case of such given load condition, bridge output (Vout) value can be read (Fig. 9).Bridge Measuring Circuits in the Strain Gauge Sensor Configuration 83
Fig. 9 The value of the output voltage for given load condition
Substituting the values in equation (15) for A = a2 = (10 mm)2 = 100 mm2, E = 2,1105 N/mm2,
G = 2,5, Vin = 8 V, Vout = 1,3 V, it follows:
N 1.3V 4 1
F 100mm 2 2.1 105 , F 2.1 104 N 21kN
mm 2 8V 2.5 2.6
By specifying the type of loading and layout of active strain gauges, this example
helps us to determine the value of mechanical force.
4. CONCLUSION
Strain gauge measurement techniques touch upon two specialist areas: mechanical
engineering and electrical engineering. For many materials tests, it is particularly
important to know the stress which occurs in the material. It allows us to draw important
conclusions about the structural stability, regardless of its previous shape and size.
The objectives of this work are to gain practical experience with resistance strain-
measurements techniques and to learn about the Wheatstone bridge, as well as how it is
used in strain measurements. The idea behind this is to help students understand strain
and stress better. For this purpose, a very simple model able to measure electrical pa-
rameters in the electric circuit with the acceptable accuracy is made in order to calculate
the non-electrical quantities such as force. The presented model is a learning tool, applied
in the laboratory for measurements.
REFERENCES
1. Cimbala, J. M., 2011, Stress, strain and strain gauges, Penn State University, USA
2. Liu, D. J., 1993, A mechanical extensometer for high-temperature tensile testing of ceramics, Journal of Testing and
Evaluation, Vol. 21, Issue 5.
3. Khoo, Khoo Sze Wei, 2011, Development of an optical strain measurement method, Master thesis,
University Teknologi Petronas
4. Adam, B. H., 2012, The design and construction of an interferometer for the measurement of strain in thin metal
films, Houghton Colledge, Houghton, USA.
5. Vishay Precision Group., 2011, Micro -measurements, Introduction to stress analysis by the photostress method.
6. James, W.P, and Doyle, F., 1989, Manual on experimental stress analysis, Society for Experimental Mechanics.84 J. MANOJLOVIĆ, P. JANKOVIĆ
7. Hoffmann, K., 1989, An Introduction to Measurements using Strain Gauges, Hottinger Baldwin Messtechnik
GmbH, Darmstadt, Germany
8. Hoffmann, K., 2001, Applying the Wheatstone bridge circuit, HBM Company
9. Skelton, J. R., 2006, A transducer for measuring tensile strains in concrete bridge girders, Experimental Mechanics,
46, pp. 325-332.
10. G. Hottinger Baldwin Messtechnik, Strain gauges and accessories.
11. Oliveira de Vasconcellos, 2011, Effect of axial loads on implant-supported partial fixed prostheses by strain gauge
analysis, J Appl Oral Sci 19 (6)., pp. 610-615.
12. Chockalingam, N., 2002, Do strain gauge force platforms need in situ correction?, Gait and Posture 16,
pp. 233-237.
13. Cooper, P.G. at. all, 1999, In situ measurements of skeletal muscle power output using new capacitive strain gauge,
Mediacl & Biological Engineering & Computing, vol.37.
14. H. Packard, Practical strain gauge measurements, Application note 290-1
15. Wheatstone Bridge Participant Guide, University New Mexico
MERNI MOSTOVI KOD SENZORA NA BAZI MERNIH TRAKA
Električno merenje mehaničkih veličina je često u podučavanju studenata inženjerstva. Ono se široko
primenjuje kod merenja sile, posebno pri radu alatnih mašina. Senzori sile koriste merne trake povezane
na elastični merni element za merenje spoljašnjeg opterećenjea - sile. Primenjena sila proizvodi male
promene u otpornosti mernih traka. U cilju merenja deformacije otporne merne trake, moraju biti vezane
u električno kolo. Pretvrarači na bazi mernih traka obično koriste četiri merne trake vezane u električno
kolo pri čemu formiraju Vitstonov most. Cilj ovog rada je da opiše vezu između mernih traka u različitim
mernim kolima, a posebno konfiguraciju Vitstonovog mosta. Takođe će biti predstavljen model u
obrazovanju studenata u oblasti merenja mehaničkih veličina električnim putem.
Ključne reči: merenje, merne trake, merna kola, Vitstonov most, obrazovanjeYou can also read