Turbidity An interesting parameter - Brief Overview, Measurement Tips & Tricks FROM WATER TO WINE - Xylem Analytics
←
→
Page content transcription
If your browser does not render page correctly, please read the page content below
Susanne Gollor
                                            Senior Product Manager

Turbidity
An interesting parameter
Brief Overview, Measurement Tips & Tricks

FROM WATER TO WINE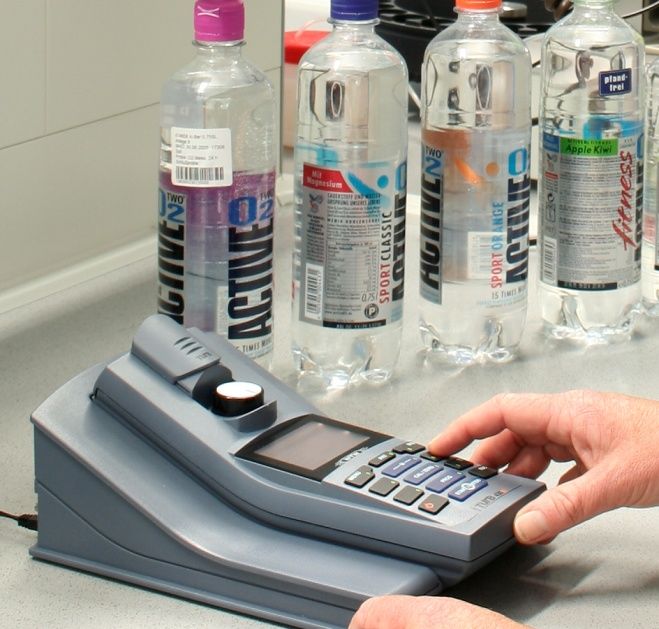
Turbidity – Driven by Application

    • Drinking Water Applications

        •   Indicator for water purity
        •   Quality Control of ponds, reservoirs and water works
        •   Control of (over) use
        •   Drinking water in Food & Beverage industries
        •   Reference measurements for process instrumentation

    • Waste Water Applications
        Reference measurements for process instrumentation

    • Industrial Process Control, Production, QC of incoming goods
        •   Filter loads: avoiding breakage of filter
        •   QC of fuel quality: income control in motor development, …
        •   Food & Beverage: production like juice, washing water of process…
        •   Commercial Fish-farming
        •   Cell culture growth, fermenter
        •   ………..

    • Environmental monitoring: Surface Water Bodies

2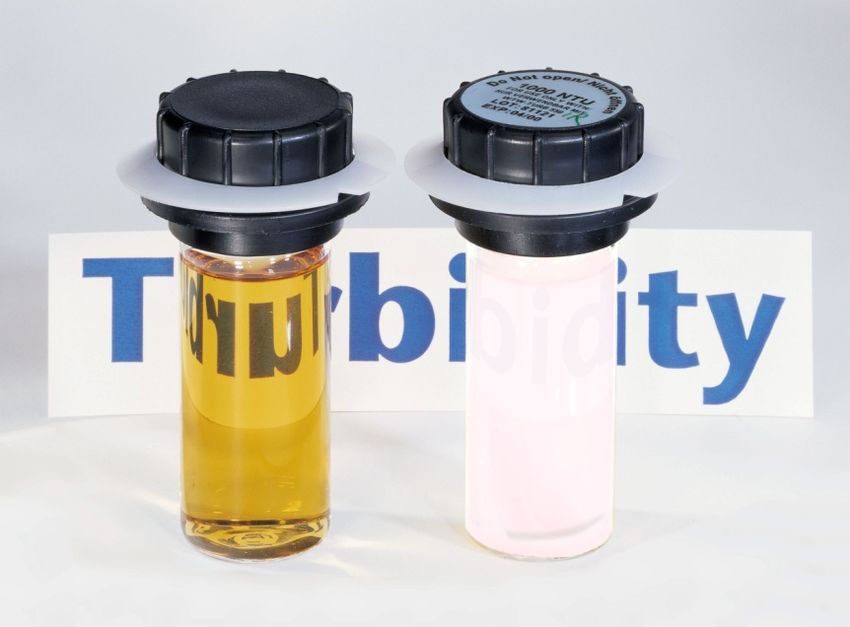
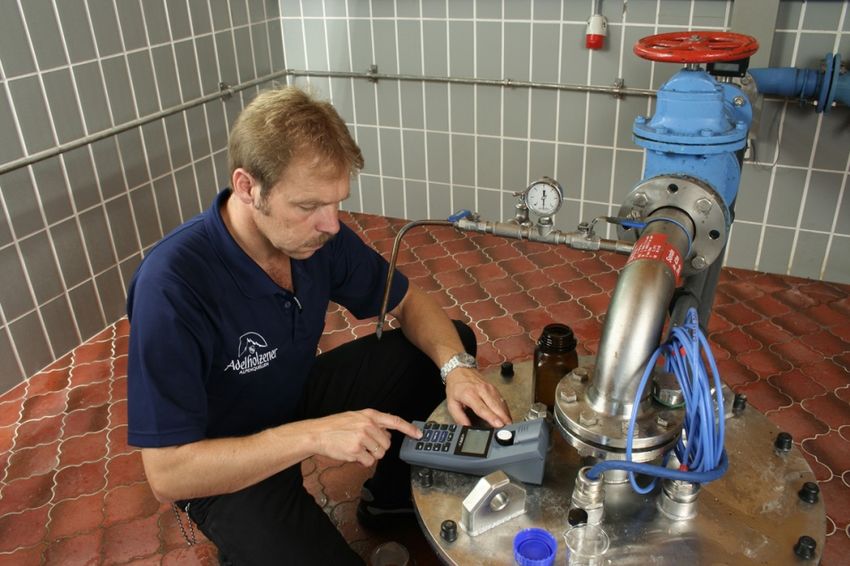
Measuring Principles
    Standard methods & application driven

3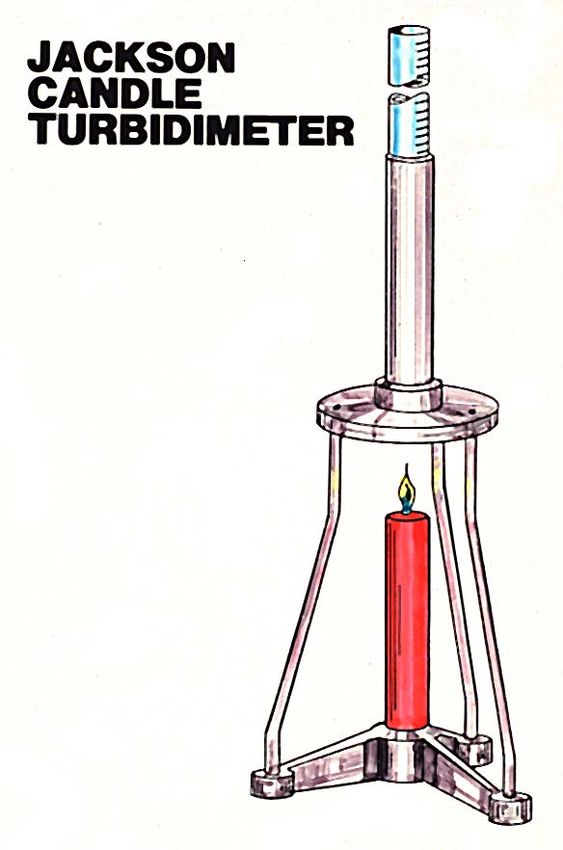
Principles of Turbidity Measurement
Turbidity is an optical impression!

Thus, turbiditiy is not reflecting a clearly defined measure like e.g. electrochemical or photometric
parameters, but is an effect caused by scattering and absorbance of light instead:
• Solid particles cause light scattering, depending on size, shape and colour

• Angles of light scattering are varying with size and particle count:
  forward, sideward and backscattering.

• Attenuation of light is increasing by multiple scattering and absorbance with growing particle count
  (= higher turbidity) => Scattering intensity is non-linear within the complete range

     Scattering effects are dependent on particle size: green is a small,   The more particles the more multiple
     orange is a big paricle                                                scattering between particles occur
4
Principles of Turbidity Measurement
What do scattering effects mean for readings and reproducibility?

Imagine a piece of paper in the light: being exposed full formate or from the side

                              Lamp

•   Particles are not stable and therefore are changing their orientation in the solution
•   With changing orientation of an unevenly shaped particle in the light, the scattering effect will be varying:

This results for the measurement in:
•   „Oscillating“ readings arround an average value
•   Higher tolerances / variability of the system, measurement range dependent
•   Resolution decreases with higher measurement range due to interactions
•   In comparison to other measurement procedures, a real sample does not show a„stable“ measurement
    system during measurement.

5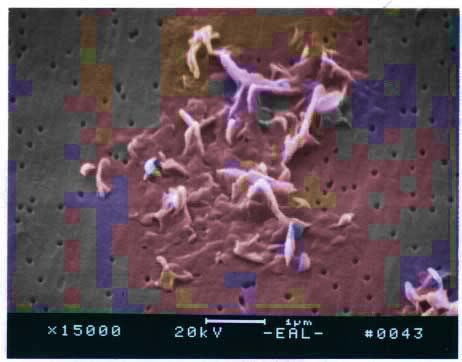
The three main procedures
    Nephelometric - Scattering at 90° angle

    Best suitable measurement for drinking water applications
    Standard method of DIN EN ISO and US EPA

    •   Light beam passing through a cell
    •   Scattering detection with a 90 detector orientation
    •   Light passing through the cell is being ignored

    Transmission measurement at 180°

    •   Transmisson is defined by light intensity after/before vial
    •   The detector is placed at 180°
    •   Photometric measurement is performed via transmission:

        This is the principle of photometric turbidity correction for some
        parameters like COD or being used for photometrical QC of e.g.
        liquids like wall paint.

6
Three main procedures
Ratio measurement – combining various detection angles

•   Important for solutions with high turbidity values ˃1500- 2000 NTU to optimize detection of
    multiple (back) scattering effects between particles.
•   Measuring different (scattering) angles in ratio to transmission being evaluated alogrithmically
    The more particles are dissolved, the more interacting effects are given. This may lead to an even lower measurement
    value with the 90°detection depending on particle distribution. With the ratio procedure a detection up to 10.000 NTU is
    possible (taking a high tolerance into account).

•   No standardized ratio procedure => no comparable results between different instruments
    Application specific standards, e.g. brewery industry with defined application optics (90°, 11°)

                                                                              Attention in water treatment referencing process
                                                                              with lab meters:
                                                                              Results from lab instruments with ratio from 40 NTU
                                                                              onwards are not comparable to nephelometric
                                                                              results above 40 NTU! Ratio is a non-standardized
                                                                              but manufacturer dependent optical system.
                                                                              Values should have any „Ratio“ mark to be identified
                                                                              as such.

7
IR or Tungsten Halogene Lamp?

Different Light Sources

IR at 860 nm
•   fulfills DIN EN ISO 7027-1 requirements => European standard for drinking water
•   tech. requirements of optical system strictly defined:
     • 860 nm ± 30 nm
     • - Detector at 90° ± 2.5°, aperture angle 20-30°
•   IR eliminates colour effects of solutions, less influence of ambient straylight

White light - Tungsten Halogene
•   fulfills US EPA 180.1 requirements => US regulations for drinking water:
•   Technical specification is much wider
     • light source between 400-600 nm, filament temperature 2200 – 3000 K
     • Detector at 90° ± 30° , aperture < 30°
•   In the given wavelength range, color infuences by absorbance are mostly disturbing
•   Due to smaller wavelength, smaller particles can be detected

=> Suitable optical systems are depending on standard methods, industries and applications

8
What is the best choice?

If not defined by requirements of standard methods, the application is important for the best choice:
Particle size and count + coloration of samples!

                                                                         Forward
                              Optics            IR 90°           T 90°                             Ratio
                                                                        scattering
                                               860 nm        400-600 nm (IR or T)               (IR or T)
    Measuring task
                                                                       (e.g. 11-45°)
    Low Turbidity Level
                                                   x               x
    e.g. Drinking Water ˂1 NTU
    High Turbidity Level                                                                               X
                                                                                             (cannot be compared to
     > 1000-2000 NTU                                                                          nephelometric results)

    Colored samples                                x                                                   x
    Small Particles                                                x
    Big Particles, e.g. cells                      x                                x

9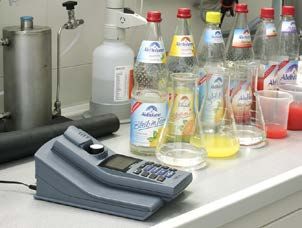
Influence of color – Example Fruit Juices
 Samples of                           Comparison IR vs T                                      IR light at 830-860 nm is out of absorbance range of
fruit juices, turb and                                                                        colored solutions:
clear                  Turb 430 IR Turb 750 IR Turb 430 T                    Turb 750 T
Beetroot                  220          222          56                           50           ⇒ The measurement results are mainly defined
Cabbage (turb)            789          802         695                          683             from turbidity alone: IFU is recommending IR
Carot                     556          556         112                          115             for measurement in juice.
Vegetable                 764          770         138                          128
                                                                                              ⇒ IR optics allow less variation in lamp and
Blueberry                 708          746         31,2                         25,5
                                                                                                layout: Measurement results will show mostly
Banana (turb)             996          983         350                          354
                                                                                                variability between different instruments.
Cherry-Banana             OFL          OFL         253                          236
Veg/Tomato                583          608          85                           77           Tungsten lamp with a variety of 400-600 nm
Apple clear               0,52        0,43         0,08
Calibration & Standards
Turbidimetry has natural limitations
11Calibration
Brief History of Calibration:
The Jackson Candle Turbidimeter explains the calibration idea of turbidity measurement:
Attempting a “real world sample image” with differently shaped particles
• First standards from diatoms in earth (= Kieselguhr)
Diatoms are algae with silica housing and multiple shape and size
Prepared from a 1000 ppm stock solution = suspended silica dilution steps
*) Source Image: https://de.wikipedia.org/wiki/Kieselgur#/media/Datei:Diatoms.png
Images courtesy of Mary Ann Tiffany, San Diego State University. - Bradbury J:
Nature's Nanotechnologists: Unveiling the Secrets of Diatoms.
PLoS Biol 2/10/2004: e306. doi:10.1371/journal.pbio.0020306
Various diatoms,
electronmicroscope*)
• Poured from top view in glass tube with candle below
• With increasing particles light turns gradually´
to a uniform shimmer and final opaque solution.
These grades have been marked
• Unit = JTU, JacksonTurbidityUnit, limitation of this „transmission“ < 25 JTU
12Calibration Yesterday and Today
Formazine in the 1950ties: best image of real samples
Primary standards DIN EN ISO and US EPA, characterized by a high tolerance need
• Hazardous, cancerogene (raw) material
• Stock solution of 4000 NTU, variation of 5-10% (manufacturer depende
depending on raw material and manufacturer, additional dilution error adds
• Freshly prepared dilutions for use within 24 hrs only, 2 hrs for small values!
• Particle instable in shape and size by clogging and deterioration of particles
=> inhomogenous and varying dispersion (even for stabilized formazine)
AMCO Clear® Standards and other polymers: Offering best and stable real sample image today
Polymer microspheres in ultrapure water are accepted to be primary standard acc. US EPA, secondary
standard acc. to DIN EN ISO, highly precise and longterm stable
• Not hazardous
• 1% Lot-to-Lot accuracy in production for size, shape
=> stable and homogenous distribution in particle composition
• Traceable to Formazine
• Designed and optimized for each optical system:
=> Highest precision reached with specific IR and T calibration standards
=> Only freshly prepared Formazine standards from one and the same standard for an instrument
comparison study
13Calibration: Comparing Standards
AMCO Clear® Standards (1) vs Formazine (2)
AMCO Clear® Standards Formazine / stabilized Formazine
Formazine raw material is rated
Non hazardous
carcinogenic and hazardous
Defined polymer beads, unchanged
Formazine stock solution plus dilution
composition, no dilution error
steps lead to 10- 20 % deviation
1% Lot to Lot accuracy
between different manufacturers
Drift of particle size and shape => Polymers
Stable particle distribution and particle values drift accordingly.
size, can be optimized for each optical Stabilized Formazine standard need
system “Re-Suspension” => Change in size
and distribution
Easy to dispose Formazine to be disposed sepeartely
Formazine Standards change within
Longterm stability min. 15 months in
24 hours, stabilized solution also drift
bottles, min. 3 months in clean vials
(see above) Formazine
14How to achieve best
results?
15Turb® 750/430: Simply „all right“ - with „IRPC“ „Stable“ is, what is correct! Precise results in turbidity measurement mean: Measuring moving, instable particles reliably with IRPC Intelligent Reproducibility- and Plausibily Check => Internal multiple readings per measurement => Evaluation of these values ⇒ Elimination of outliers ⇒ Stable data output of the evaluated result as a stable and reproducible reading! Take limits of the measurable into account ⇒ Turbidimetry with formazine showing 10% tolerances and more has to be realistic in terms of expectation: depending on measurement range 2-3% of the value at higher ranges is very good! ⇒ Higher tolerances are no problem: turbidity values are giving a value corridor of „being OK“ for quality and contaminant rating ⇒ Resolution of 0,02 NTU in low range can only be achieved with best practice and correct handling! Smaller resolution 0.00x are simply digital. Water scatters with approx 0,02 NTU/FNU itself. 16
Best measuring procedure: preparation
Excluding error sources

• Dirt and Dust: Clean vials bevore use, no fuzz in calibration standards,
  clean vial from finger prints with optical
• Glass inhomogentities for better reproducibility: Indexing (see below)
• Scratches excluded by indexing for suitable position of vial (see below)

Prepare vials by indexing for longterm-use
Reommendation in regulations (e.g. US EPA)
•    Place vial, press START and slighly turn to the right and left
•    Release START when a „stable“ value range:
     meaning no big jumps up or down, which would indicate a scratch*)
•    Mark position on cap label
     *) Tolerance for value deviations:
        ± 0,02 NTU below 1 NTU
        ± 2-3 % for higher values

 Then measuring routine is fast, precise, comfortable
 •   Place prepared = marked vial
 •   Press and release START
 •   Value will be stored, or store with ID
Best measuring procedure
Advantage of Indexing versus pre-marked vials
is the optimized path of light through the vial without impacts
• Scratches and glass inhomogenities are always excluded- in contrary to
pre-marked vials - with indexing procedure and allow longterm use
• Big value jumps during indexing indicate scratches or glass faults =>
indexing allows different positions to lows value for scratch-free light path
• Scratches in light path result in wrong turbidity values, mostly higher
=> pre-marked vials result eventually in less accurate values
• Silicon oil to mask scratches eventually has a differing index and
attracts dust and dirt on vials => missleading results
• For single use of vials:
Search best position by aligning the vial with lowest value during
measurement procedure as displayed.How to achieve optimal results in drinking water?
Assuring purity and cleanliness for human consuption!
⇒ Value ≤1 NTU, since particle offer ground for bacterial/viral growths
⇒ This value is very low considering the limits of this measurement procedure
⇒ Accuracy of result and assurance require a maximum accuracy during calibration and
measurement procedure
⇒ Dirt and Dust: Clean vials before use, no fuzz entry into calibration solutions, wipe off finger
prints with optical cloth.
⇒ Avoid glass inhomogenities and scratches by indexing
Calibration of the 0,02 NTU/FNU standard
• Insert vials, slightly turn to the left and right
• Release START when value is lowest respectively in a „stable range“
w/o big jumps of value, which might indicate a scratch (see manual)
• Mark position on cap label
Use same vial for measurement of samples and 0.02 NTU/FNU standard
Sample measurement in the same vial as 0.02 NTU standard before
empty vial, rinse with sample, fill (next) sample, measure at aligned marking position each time
The 0.02 NTU standard (with preservative against bacterial contamination) can be substituted
by fresh, clean and particle-free de-ionized water.GLP – The daily proof
A classical chicken-and-egg issue: What is drifting - standard or instrument?
• In laboratories meters drift less than in field situations due to stable ambient condition.
• But: for good laboratory practice, a proof standard before measuring can be used.
Tips for practise of a proof standards for low values
Prepare a dilution out of a 10 NTU Polymer-Standards to a nominal value of 0,3x to 0,6x NTU
Daily measurement and documentation of the value in a tolerance range of ±10%
Does the proof exceed ± 10%: Perform a calibration and prepare a new proof standard
Date xx.xx.xx xx.xx.xx xx.xx.xx xx.xx.xx xx.xx.xx xx.xx.xx xx.xx.xx xx.xx.xx xx.xx.xx xx.xx.xx …. xx.xx.xx
> 10%
0,36
0,35 x
0,34 x x
0,33±0,033 x x x x x x
0,32 x x
0,31
0,30
x
20Avoiding Impacts
• Correct sampling and fast measurement:
- Bring sample to room temperature, homogenisation
- Do not shake vigerously (bubbles => wait)
- Re-suspensation by gentle movement
- Fast settling samples instantly, average values
- No condensation on vial
• Impacts:
- Bubbles in the sampl
- Temperature change
- Condensation (Temp!)
- Finger prints!
- Scratches => Indexing
- Dirt and fuzz in vials
• The correct optical choice to match the application tasks
21Summary
• Turbidity is an indicator parameter: E.g in drinking water, particles stand for a
platform of bacterial growth, meaning a potential hazardous bacterial
contamination.
• Turbidity measurement principles are not comparable to physical or electro-
/chemical measurement principles, where clearly defined quantities or
concentrations of substances are reacting and can be analyzed subsequently.
E.g. pH, Ammonium, Chlorine, COD…
• For turbidity measurement, various optical systems can be selected matching
different application requirements and purposes: E.g. does color rarely influence
the measurement with IR lamp negatively in comparison to tungsten lamp.
• Formazine – beside using harmful raw material – is less accurate then modern
polymer particles with a production accuracy of +/- 1% like the well proven AMCO
Clear® standards.
• The comparison of measurement results from different instrument models is only
given when all instruments are calibrated with one and the same freshly prepared
formazine standards.
• For drinking water and low values ≤ 1 NTU the accuracy can be increased by
following an improved calibration and measurement handling together with
instrument specific or other polymers.
22For more information:
www.xylemanalytics.com
Technical Support
Email: TechInfo.WTW@xylem.com
Phone: ++49 881 183-321
23You can also read