Analyst Conference First Half of 2021

Page created by Harry Zimmerman
 
CONTINUE READING
Analyst Conference First Half of 2021
          Gunnar Groebler, Chairman of the Executive Board
          Burkhard Becker, Chief Financial Officer

                                                             SZAG Investor Relations
          Frankfurt, August 11, 2021
english
Analyst Conference First Half of 2021
Gunnar Groebler   1 Sustainability and Strategy

          Burkhard Becker   2 Economic Development and Financials

                                                                    SZAG Investor Relations
english
Analyst Conference First Half of 2021
Sustainability and Strategy

          Occupational safety – work-related accident per person rate

          18

          16     16.8
                                  15.7                                                                           Occupational safety is a high-ranking corporate
          14                                       14.7

          12
                                                                     13.4                                         target next to profitability, productivity and quality
                                                                                        12.6    2020: 11,33

          10                                                                                                     Reduction of injury rate through measures and
           8
                                                                                                                  campaigns to enhance workplace safety
           6                                                                  5.6               6.3
                                                          4.9
                                          3.9
           4
                         2.8
           2             2.8
                                          1.1             1.0                 0.7               0.7
           0
                 Jan + Feb            Mrz              Apr              Mai                   Jun
                           WA rate annualized      WA rate monthly          WA rate accrued

          Work-related accident per person rate = Number of accidents with more than one day off work / number of employees * 1,000

                                                                                                                                                                           SZAG Investor Relations
                                                  Groupwide goal of the occupational safety policy is: Zero Accidents
english

                                                                                                                                                                           3
Analyst Conference First Half of 2021
Sustainability and Strategy

           Vaccination campaign #hüttengeimpft

                          12,000

                          10,000
          Vaccine doses

                           8,000

                           6,000

                           4,000

                           2,000

                    0
          Calendar week            20     21      22      23      24       25      26      27       28      29        30   31

                                                                                                                                SZAG Investor Relations
                                        Salzgitter Group actively contributes to overcoming the COVID-19 pandemic –
                                           more than 10,000 doses of vaccine administered per calendar week 31!
english

                                                                                                                                4
Analyst Conference First Half of 2021
Sustainability and Strategy

           Contribution towards decarbonization – highlights of the first half 2021

                                                                                                                Groundbreaking for the
          Commitment to the GetH2 initiative                                                                    µDRAL direct reduction plant

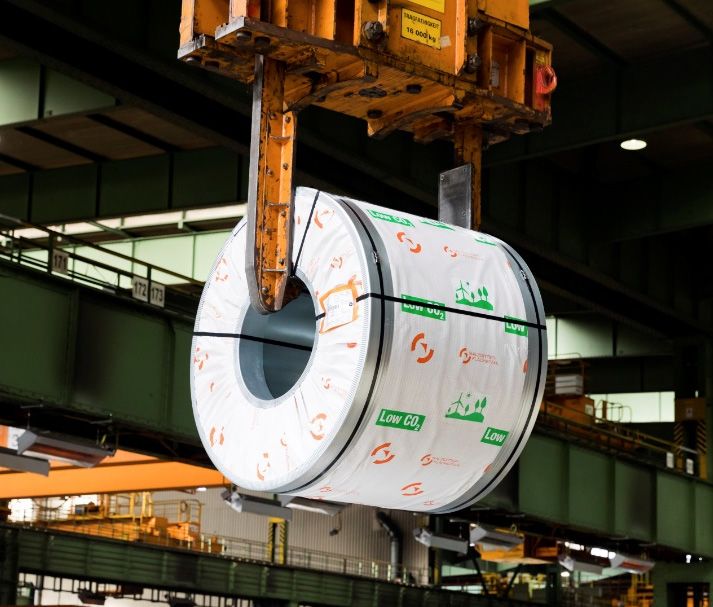
                                                                First delivery of green strip steel products
                                                                for the serial production to Mercedes-Benz

               MOU for joint research on optimization
               of iron ore supply for DRI plants                                                               Commissioning of Salzgitter Wind Hydrogen

                                                                                                                                                           SZAG Investor Relations
                                                        Strong focus on decarbonization continues in 2021
english

                                                                                                                                                           5
Analyst Conference First Half of 2021
Sustainability and Strategy

            SALCOS® – Gradual conversion to a H2-based steel production

             Today                                                     Indicative: 2025+               Indicative: 2030+                    Indicative: until 2050

                                    Status Quo                                           Pilot phase                                 Completion
            CO2-Emissions (8 m t/a)

                                                                           - 30% CO2
                                                                                                                                                                                         DRP

                                                                                                       - 50% CO2

                                                                                                                                            - 83% bis > - 95% CO2
                                                                                       (Stage I)                   (Stage II)
            Blast Furnaces

                                                                                                                                                                                          EAF

                                                                                                                                                                                   Electrolyzer
            Basic Oxygen Furnaces

                                                                                                                                                                     (Stage III)

                                                                                                                                                                                                  SZAG Investor Relations
                                    Status Quo                                              Stage I                       Stage II                                  Stage III
english

          EAF= Electric Arc Furnace          DRP= Direct Reduction Plant                                                                                                                          6
Analyst Conference First Half of 2021
Sustainability and Strategy

              Green steel – current environment

              Marketable                                    Fundable                                  Economically viable

              Already today certified production           Funding for a major part of the          Higher prices for green steel in the
               and delivery of green steel                   capex requirements applied for via        short-term as a result of added
              In addition, strong interest from             the EU and Federal/State programs,        green value and supply shortage
               customers underpinned with                    binding response by                      In the medium- to long-term higher
               memoranda of understanding for                the end of 2021                           competitiveness of green vs. gray
               green steel via the hydrogen route           Acquired CO2 emission                     steel due to CO2 regulations and
              Natural gas as bridge technology              allowances serve as additional            rising prices
               allows for significant CO2 reduction          security
               until green H2 is available to the
               necessary extent

               We resolutely strive to realize our ambition to produce green steel at the Salzgitter site by the end of 2025
               in order to bolster our strong competitive ability and clear commitment to the green transformation

                                                                                                                                              SZAG Investor Relations
                                 We have very good preconditions for a successful transformation towards green steel
english

                                                                                                                                              7
Analyst Conference First Half of 2021
Sustainability and Strategy

          EU crude steel: Green vs. Gray

                                                              Expected main drivers

                                        Green Steel                                                Gray Steel

          Short-term: Price premium in the EU due to                       Medium- to long-term: significant additional burden as a
          supply shortage and added green value                            result of decreasing EU allocation of CO2-emission
                                                                           allowances and rising CO2 prices
          Medium- to long-term: Price premium will diminish following
          an increase of the supply and a decrease of production costs     Long-term: Lower to no demand as a result of substitution
          as a result of the scale effect and level of maturity            effects from gray to green steel, high cost pressure as
                                                                           demand decreases

                                                                                                                                       SZAG Investor Relations
                           Higher competitiveness for steel via direct reduction versus blast furnace route expected;
                                         in the long run Gray Steel made in Europe will be obsolete!
english

                                                                                                                                       8
Analyst Conference First Half of 2021
Sustainability and Strategy

          Value of the acquired CO2 emission allowances

                                                                Market value CO2 emission allowances

                        1.000

                         750
            € million

                         500

                         250

                           0
                                3Q 16       1Q 17     3Q 17     1Q 18     3Q 18      1Q 19      3Q 19   1Q 20     3Q 20       1Q 21

                                                                                                                                      SZAG Investor Relations
                                        Acquired CO2 emission allowances have reached a market value of almost € 1 billion!
english

                                                                                                                                      9
Analyst Conference First Half of 2021
Sustainability and Strategy

              Update: feasibility study for the direct reduction of iron ore at Wilhelmshaven

          Study                                                                                    Project partners
              Construction of a direct reduction plant with an upstream
               hydrogen electrolyzer as well as
              Developing necessary infrastructure for supplying it with raw
               materials, natural gas and hydrogen at the deep-water port of
               Wilhelmshaven
          Status
              General feasibility of a 2 mt p.a. DRI plant affirmed
              Wilhelmshaven has good site conditions
               (deep-water port, access to renewable electricity, open
               spaces…)

                                                                                                                              SZAG Investor Relations
                                      No “either/or decision”– SALCOS® will be expedited at the Salzgitter site;
                          we generally support Wilhelmshaven as green energy hub and location for a direct reduction plant
english

                                                                                                                             10
Sustainability and Strategy

          Update investment projects

          Ilsenburger Grobblech: New heat treatment line
           Optimization of the product portfolio
           Expansion of the market position and volume expansion for higher
            value grade segments such as high strength and wear resistant, water
            tempered steel
           Commissioning: 2021
           Current status: Trial operation, first deliveries to customers

          Salzgitter Flachstahl: Hot-Dip Galvanizing Line 3
           Qualitative growth in the strip steel business
           Reinforcement of the market position in the automotive segment
           Strengthening of the premium segment for auto customers
           Commissioning: 2022
           Current status: Installation of equipment

                                                                                                                       SZAG Investor Relations
                              Realization of major investment projects to grow in terms of quality progresses well!
english

                                                                                                                      11
Sustainability and Strategy

          Strategy review initiated

                                                            FitStructure 2.0 (2019-)

                                                                                             FitStructure 2.0: Of a total of around
                                   Salzgitter AG 2021 (2016-2021)                             € 300 m in earnings improvement
                                                                                              potential € 160 m realized per
                                                                                              June 30, 2021
                                                                                             A further € 100 m in additional
                              Development of new Group strategy (H2 2021)                     earnings contribution to be
                                                                                              expected from Salzgitter AG 2021

                                                                                         New Group strategy (2022-)

                                         2021                                                        2022

                                                                                                                                        SZAG Investor Relations
                                         Presentation of the new Group strategy expected for early 2022
english

                                                                                                                                       12
Sustainability and Strategy

          Strategy review: key points

                Strategy                      Portfolio               Efficiency

          Who and what do we            What is the right        How do we generate
          want to be in                 business portfolio for   additional efficiency
          2025/2030?                    our strategy?            gains across the
                                                                 entire value chain?

                                              Enabler

             Management structures and instruments, organization of the Group,
                                    corporate culture

                                                                                                    SZAG Investor Relations
                                                       Review of the four main areas has started
english

                                                                                                   13
Gunnar Groebler   1 Sustainability and Strategy

          Burkhard Becker   2 Economic Development and Financials

                                                                    SZAG Investor Relations
english
Economic Development and Financials

          Order intake of steel consumers

                                             Order intake of selected branches of the German industrial sector (Jan. 2018 = 100)
                130

                120

                110

                100

                 90

                 80

                 70

                 60

                 50

                 40

                 30
                  Jan 18       Apr 18      Jul 18      Oct 18      Jan 19      Apr 19         Jul 19   Oct 19   Jan 20   Apr 20   Jul 20   Oct 20   Jan 21   Apr 21
                           Construction   Mechanical engineering    Metal processing    Automotive

                                                                                                                                                                       SZAG Investor Relations
                            After dramatic slump of order intake during the COVID pandemic recovery to pre-crisis levels
english

          Source: Bundesbank, last figure from June 2021, construction sector from May 2021                                                                           15
Economic Development and Financials

           Raw materials and steel prices

                                           Raw Materials                                                              Hot rolled coil & Heavy Plate
                            Iron ore                                  Coking Coal                  1,300                                                                              1,165
                 (62% Fe CFR China, US$/dmt)                    (FOB Australia, US$/t)
           250                              184         300                                        1,200
                                                                                         217
                                                                                                   1,100
                                                        250                                        1,000
           200                             Ø 188                                                                                                                            Ø 941
                                                              Ø 207                                 900                                                                     Ø 854
                                                        200
                                                                        Ø 177                       800
           150
                                                                                           Ø 144    700
                                                        150
                                                                                                             Ø 614
                                   Ø 109                                         Ø 124              600                           Ø 556
           100             Ø 93                                                                                                                           Ø 504
                 Ø 69                                   100                                         500      Ø 560
                                                                                                                                   Ø 474                  Ø 472
                                                                                                    400                                                                              1,050
            50                                           50
                                                                                                    300
                                                                                                      Jan' 18        Jul' 18   Jan' 19     Jul' 19   Jan' 20   Jul' 20   Jan' 21    Jul' 21
                        Average 2018           Average 2019            Average 2020                        Northern Europe HRC ex. Ruhr               Northern Europe Heavy Plate ex. Ruhr

                                                                                                                                                                                               SZAG Investor Relations
                     Diverging raw material price development – coking coal prices recently surged, iron ore prices decreased;
                                      steel prices stagnate at record levels following dynamic development
english

          Source: Platts                                                                                                                                                                      16
Economic Development and Financials

           Key data

                                                                                                             H1 2021       H1 2020      Δ    Q2 2021   Q1 2021

          Crude steel production                                                           kt                 3,377.6      2,952.7   424.9   1,733.1   1,644.5

          External sales1                                                       € million                     4,435.5      3,631.0   804.5   2,341.4   2,094.1

          Earnings before tax                                                   € million                        305.7      -127.8   433.5     188.4     117.3

          Earnings after tax                                                    € million                        230.6      -144.7   375.3     154.1      76.6

          Earnings per share (undiluted)                                                   €                       4.20      -2.70    6.90      2.82      1.38

          ROCE                                                                            %                        16.4       -6.3    22.7      20.1      13.2

          Core workforce2                                                                                      22,414       23,009    -595    22,414    22,475

                                                                                                                                                                  SZAG Investor Relations
                                Salzgitter Group continues its upward trajectory, delivering a strong result in the second quarter
english

          1 only   from entities within the Group of Consolidated Companies of Salzgitter Group   2   per reporting date                                         17
Economic Development and Financials

           Strip Steel

                       Order intake                  Consolidated sales                Earnings before taxes
               2,500                                     1,400                                   150

                                2,235                    1,200
               2,000                                                        1,198
                                                                                                 100
                                                                                                                   104.5
                        1,834                            1,000

               1,500                                               903                            50

                                             € million

                                                                                     € million
                                                          800
          kt

                                                          600
               1,000                                                                               0

                                                          400

                500                                                                               -50
                                                          200                                            -69.2

                  0                                         0                                    -100
                       H1 2020 H1 2021                           H1 2020   H1 2021                      H1 2020   H1 2021

                                                                                                                                     SZAG Investor Relations
               Outstanding profit contribution boosted by higher shipments and selling prices at record levels towards the end of
                                                              the first half of 2021
english

                                                                                                                                    18
Economic Development and Financials

           Plate / Section Steel

                       Order intake                      Consolidated sales              Earnings before taxes
               1,200                                         500                                   50

                                 1,101                       450                                   40
               1,000                                                           446
                                                             400                                   30
                          966
                                                             350     363                           20
                800
                                                             300                                   10

                                                 € million

                                                                                       € million
          kt

                600                                          250                                    0

                                                             200                                   -10
                                                                                                          -27.0     -26.9
                400
                                                             150                                   -20

                                                             100                                   -30
                200
                                                              50                                   -40

                  0                                            0                                   -50
                        H1 2020 H1 2021                            H1 2020   H1 2021                     H1 2020   H1 2021

                                                                                                                                          SZAG Investor Relations
                       Gradual improvement of order activity and pricing over the course of the first half; sections with solid profit
                             contribution; recovery of the plate companies lags due to late-cyclical nature of the business
english

                                                                                                                                         19
Economic Development and Financials

                Mannesmann

                              Order intake*              Consolidated sales*               Earnings before taxes
                      1,000                                    600                                   50

                       900                                                                           40
                                        881                    500               530
                       800                                             494                           30

                       700                                                                           20
                                                               400
                       600                                                                           10
          € million

                                                   € million

                                                                                         € million
                       500                                     300                                    0
                                498
                       400                                                                           -10              -15.5
                                                               200
                       300                                                                           -20    -22.7

                       200                                                                           -30
                                                               100
                       100                                                                           -40

                         0                                       0                                   -50
                              H1 2020 H1 2021                        H1 2020   H1 2021                     H1 2020   H1 2021
          * excluding EUROPIPE-Group

                                                                                                                                            SZAG Investor Relations
                      Improved business situation at the precision tubes group, medium-diameter line pipes and the stainless steel tubes
                                                        group also registered an increase in bookings
english

                                                                                                                                           20
Economic Development and Financials

           Trading

                       Shipments                     Consolidated sales                Earnings before taxes
               2,000                                     1,800                                   150

               1,800                                     1,600
                                1,810                                                            125
                        1,724                                               1,538
               1,600
                                                         1,400

               1,400                                                                             100
                                                         1,200
                                                                  1,229
               1,200

                                             € million

                                                                                     € million
                                                         1,000                                    75              149.3
          kt

               1,000
                                                          800                                     50
                800
                                                          600
                600                                                                               25
                                                          400
                400
                                                                                                   0
                200                                       200                                           -15.8

                  0                                         0                                    -25
                       H1 2020 H1 2021                           H1 2020   H1 2021                     H1 2020   H1 2021

                                                                                                                                       SZAG Investor Relations
               Very gratifying pre-tax profit as a result of the dynamic price development, along with favorable purchase prices in
                                                  the stockholding business and at the UES Group
english

                                                                                                                                      21
Economic Development and Financials

                Technology

                            Order intake                    Consolidated sales              Earnings before taxes
                      800                                       700                                   50

                                      749                                                             40
                      700                                       600               639

                                                                        575                           30
                      600
                                                                500                                   20               32.5
                              558
                      500
                                                                                                      10
          € million

                                                    € million

                                                                                          € million
                                                                400
                      400                                                                              0
                                                                300                                          -10.6
                                                                                                      -10
                      300

                                                                200                                   -20
                      200
                                                                                                      -30
                      100                                       100
                                                                                                      -40

                        0                                         0                                   -50
                            H1 2020 H1 2021                           H1 2020   H1 2021                     H1 2020   H1 2021

                                                                                                                                              SZAG Investor Relations
                      KHS Group’s pre-tax result significantly outperformed the year-earlier figure also due to accounting profit achieved
                           by selling the pouch business; KDE Group also with profit contribution, slightly negative result of KDS
english

                                                                                                                                             22
Economic Development and Financials

          Industrial Participations / Consolidation

                      Consolidated sales                         Earnings before taxes
                       100                                        100

                        90                                         90

                        80               84                        80
                                                                                            Contribution Aurubis investment:
                        70                                         70                       H1 2021: € 34.0 m
                        60
                               67
                                                                   60
                                                                                            H1 2021: € 91.0 m
          € million

                                                     € million
                        50                                         50

                        40                                         40

                        30                                         30               61.8

                        20                                         20

                        10                                         10    17.4

                        0                                          0
                             H1 2020   H1 2021                          H1 2020   H1 2021

                                                                                                                                      SZAG Investor Relations
                               Pre-tax profit includes € 91.0 million contribution of Aurubis AG, an investment included at equity
english

                                                                                                                                     23
Economic Development and Financials

           Income statement

          Income Statement (€ million)                                             H1 2021     H1 2020        Δ
          Sales                                                                      4,435.5     3,631.0   804.5
          Increase/decrease in finished goods and work in process/other own
                                                                                       88.2        -57.2   145.4
          work capitalized

                                                                                     4,523.7     3,573.8   949.9

          Other operating income                                                      174.9       132.9     42.0
          Cost of materials                                                          2,925.8     2,373.3   552.5
          Personnel expenses                                                          871.2       846.0     25.2
          Amortization and depreciation of intangible assets and property, plant
                                                                                      149.9       148.7      1.2
          and equipment
          Other operating expenses                                                    509.3       462.1     47.3
          Result from impairment losses and reversal of impairment losses of
                                                                                         3.5        -8.9    12.4
          financial assets
          Income from shareholdings                                                      0.6         2.1    -1.5
          Result from investments accounted for using the equity method                82.5        33.3     49.2
          Finance income                                                                 3.5         3.9    -0.4
          Finance expenses                                                             26.6        34.8     -8.1

                                                                                                                    SZAG Investor Relations
          Earnings before taxes (EBT)                                                 305.7       -127.8   433.5
          Income tax                                                                   75.1        16.9     58.2
          Consolidated result                                                         230.6       -144.7   375.3
english

                                                                                                                   24
Economic Development and Financials

           Consolidated balance sheet

          Assets (€ million)                                  2021/06/30    2020/12/31       Δ
          Non-current assets                                      4,229.0       4,244.5   -15.5
          Intangible assets, property, plant and equipment        2,424.0       2,423.6     0.4
          Investment property                                       80.8          81.5     -0.7
          Financial assets                                          53.1          54.6     -1.5
          Investments accounted for using the equity method       1,236.5       1,169.1    67.4
          Trade receivables                                           9.4          11.0    -1.6
          Other receivables and other assets                        18.3          22.3     -4.0
          Income tax assets                                           2.2           0.5     1.7
          Deferred income tax assets                               404.7         481.9    -77.2
          Current assets                                          4,771.7       3,992.9   778.8
          Inventories                                             2,181.1       1,933.7   247.4
          Trade receivables                                       1,416.0        923.9    492.1

          Contract assets                                          313.3         300.2     13.1
          Other receivables and other assets                       244.2         188.3     55.9
          Income tax assets                                         21.2          23.7     -2.5
          Securities                                                49.9            0.0    49.9

                                                                                                   SZAG Investor Relations
          Cash and cash equivalents                                544.6         621.4    -76.8
          Assets available for sale                                   1.4           1.7    -0.3
          Balance sheet total                                     9,000.7       8,237.4   763.3
english

                                                                                                  25
Economic Development and Financials

           Consolidated balance sheet

          Equity and liabilities (€ million)                2021/06/30    2020/12/31        Δ
          Equity                                                2,998.5       2,678.9   319.6
          Subscribed capital                                     161.6         161.6       0.0
          Capital reserve                                        257.0         257.0       0.0
          Retained earnings                                     2,902.9       2,594.5   308.4
          Other reserves                                          37.7          26.4      11.3
          Unappropriated retained earnings                          0.0           0.0      0.0
          Treasury shares                                        -369.7        -369.7      0.0
          Minority Interest                                         9.0           9.1     -0.1
          Non-current liabilities                               3,340.2       3,476.4   -136.2
          Provisions for pensions and similar obligations       2,170.1       2,298.6   -128.5
          Deferred tax liabilities                                73.6          73.9      -0.3
          Income tax liabilities                                  30.4          30.4       0.0
          Other provisions                                       274.5         267.1       7.4
          Financial liabilities                                   737.3         749.4   -12.1
          Other liabilities                                        54.3          57.1    -2.8
          Current liabilities                                   2,662.0       2,082.1   579.9
          Other provisions                                        227.0         210.4    16.6
          Financial liabilities                                   454.1         488.3   -34.2
          Trade payables                                        1,231.4         802.4   429.0

                                                                                                  SZAG Investor Relations
          Liability contracts                                     381.0         272.8   108.2
          Income tax liabilities                                   10.9           5.5     5.4
          Other liabilities                                       357.6         302.8    54.8
          Balance sheet total                                   9,000.7       8,237.4   763.3
english

                                                                                                 26
Economic Development and Financials

          Cash flow statement
          € million
          1,000

           800
                                                 222.1            -197.7

           600                                                                       -105.5
                                                                                                           4.3

           400
                            621.4
                                                                                                                         544.6
           200

              0
                        Cash and cash           Cash flow        Cash flow           Cash flow             Other    Cash and cash
                      equivalents at start   from operating   from investment     from financing                   equivalents at end
                           of period            activities       activities          activities                        of period

                                                                                                                                         SZAG Investor Relations
                                             More than € 200 million cash flow from operating activities
english

                                                                                                                                        27
Economic Development and Financials

             Salzgitter Group – Guidance

          Provided that the market continues its stable development in the second half of the year despite the latent COVID-19
          crisis, we affirm our forecast for the financial year 2021 that was revised upward in June and anticipate the following for
          the Salzgitter Group:

             an increase in sales to more than € 9 billion,

             a pre-tax profit of between € 400 million and € 600 million, as well as

            a return on capital employed (ROCE) that is tangibly above the previous year's figure.

          Legal Note and other remarks

          We make explicit reference to the fact that imponderables, including changes in the cost of raw materials, precious metal prices and exchange rates, along with global trade policy measures and their possible impact may still exert a considerable influence over
          the course of the financial year.

          To the extent that this presentation contains statements oriented towards or related to the future, such statements are based on our current state of knowledge and the estimates based on such knowledge made by the management of Salzgitter AG.
          However, as is the case with any forecasts or prognosis, such statements are also subject to uncertainties and risks. Notwithstanding prevailing statutory provisions and capital market law in particular, we are not obligated to update this data. In particular, we

                                                                                                                                                                                                                                                                                    SZAG Investor Relations
          shall not assume liability of any kind for knowledge and statements, as well as any acts resulting on the basis of such knowledge or statements that emanate directly or indirectly from the analysis of the data, content and correlations of this document. The
          information and data made available do not represent an encouragement or invitation to buy, sell or conduct any other type of trade in securities. Salzgitter AG shall neither assume liability for direct nor indirect damages, including lost profits, arising as a
          result of the utilization of the information or data contained in this document.

          For computational reasons, rounding-off differences of +/– one unit (€, % etc.) may occur in the tables. This document is also available in German language. In the event of any discrepancy, the German version shall prevail.
english
You can also read