Implications of ending the sale of petrol and diesel vehicles in the UK by 2030 - Prepared for

Page created by George Parsons
 
CONTINUE READING
Implications of ending the sale of petrol and diesel vehicles in the UK by 2030 - Prepared for
Implications of ending the
sale of petrol and diesel
vehicles in the UK by 2030

Prepared for
Implications of ending the sale of petrol and diesel vehicles in the UK by 2030 - Prepared for
Accelerating the EV transition                                     2

Overview

Summary and key messages

Part 1: Impacts of a 2030 phase out on the road transport sector

Part 2: Impacts on the UK automotive sector

Part 3: Implications for environment and energy

Part 4: Implications for the electricity system
Implications of ending the sale of petrol and diesel vehicles in the UK by 2030 - Prepared for
Accelerating the EV transition                                                                       3

Impact on the road transport sector
                                 • A 2030 phase out could increase the number of electric cars and
                                   vans from 11 million vehicles to 17 million in 2030.

                                 • The 2030 phase out would increase the scale of charging
                                   infrastructure needed in 2030 to around 21 million chargers,
                                   relative to around 13 million under the 2040 phase out.
                                 • Home and workplace charging infrastructure will be extensive;
                                   long-distance en-route charging, and parking-based charging
                                   infrastructure are also important, but much smaller scale.
Implications of ending the sale of petrol and diesel vehicles in the UK by 2030 - Prepared for
Accelerating the EV transition                                                                                 4

Impact on the automotive sector
                                 • As a result of a 2030 or a 2040 phase out, the UK could become the
                                   dominant EV market in Europe; in a 2030 phase out scenario the UK
                                   market is 42% of total European sales.
                                 • This will provide an opportunity for both UK and European EV
                                   production; the increase in UK production will depend on its ability to
                                   develop and maintain a competitive EV industry.

                                 • 2030 scenario: If UK’s share of future EV production evolves in line with
                                   its share of conventional vehicles today, it could produce around
                                   800,000 EVs per year (200,000 more than under the 2040 scenario). In
                                   this scenario, GVA in the EV industry increases to around £7.3 billion,
                                   and jobs in the EV industry to around 86,000 (an additional £1.9 billion
                                   of GVA and 24,000 jobs relative to the 2040 scenario).

                                 • 2030+ scenario: If the UK’s larger domestic market creates incentives
                                   for a larger share of total EV production to be located in the United
                                   Kingdom, it could produce an additional 100,000 EVs per year,
                                   accounting for a further £1 billion of GVA and 14,000 jobs.
Implications of ending the sale of petrol and diesel vehicles in the UK by 2030 - Prepared for
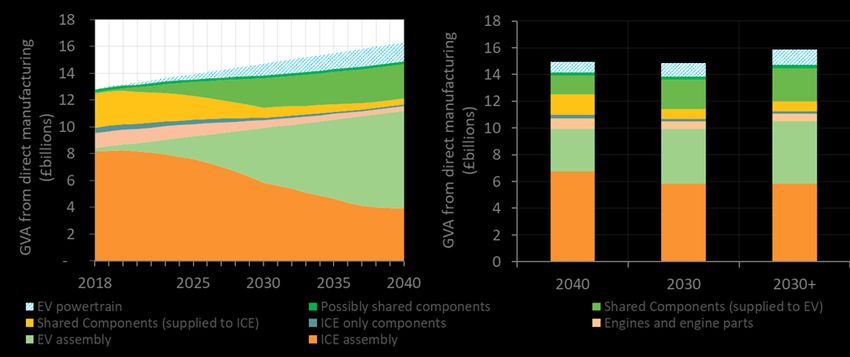
Accelerating the EV transition                                                                        5

Impact on the environment and energy
                           • The 2030 phase out would reduce tailpipe CO2 emissions by 13
                             MtCO2 in 2030, and 62 MtCO2 over the fifth carbon budget period.
                           • This saving could reduce the policy gap to meet the fifth carbon
                             budget by 53%.
                           • Put differently, this is equivalent to the CO2 from 6 million homes or
                             16 power stations.

                           • The 2030 phase out would reduce NOx emissions by around 14
                             kilotonnes, and PM10 emissions by 210,000 tonnes in 2030.
                           • The economic value of this reduction could be between £127-485
                             million per year in 2030.

                           • The 2030 phase out would reduce oil consumption, and therefore
                             net oil imports, by around 3.6 mtoe in 2030.
Implications of ending the sale of petrol and diesel vehicles in the UK by 2030 - Prepared for
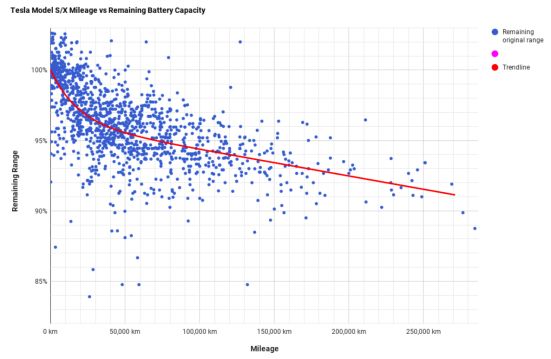
Accelerating the EV transition                                                         6

Implications for the electricity system
• The 2030 scenario with smart charging is lower cost than the 2040 scenario with
  standard charging, and therefore cheaper for consumers.

• Smart charging could reduce the costs of charging electric vehicles by 42% in both
  2030 and 2040 scenarios.

• A combination of smart charging and V2G could reduce these costs by 49% in the
  2040 scenario, and 46% in the 2030 scenario.

• Running an electric vehicle could add around £175 per year to the vehicle
  owner’s electricity bill under standard charging, and smart charging and/or V2G
  could similarly reduce this expenditure by nearly half. This compares to an
  average of over £800 to run a new petrol or diesel car or van today.

• For repurposing to have a material value, innovations are needed to achieve a
  minimum lifetime and maximum repurposing cost. With such innovations, the
  total potential value of these batteries in the 2040 scenario could be around £250
  million in 2040 and £1 billion in 2050. In the 2030 scenario, it could increase to
  around £400 million in 2040 and £1.3 billion in 2050.
Accelerating the EV transition                                                                       7

Overview of scenarios

Scenario                           Current         2040          2030                   2030+
Year                                 2017                        2030
Electric vehicles                  137,000       13 million             20 million
GVA in UK
automotive                        £13 billion    £14 billion   £14 billion           £16.5 billion
manufacturing
Jobs in UK
automotive                         137,000        147,000       144,000                180,000
manufacturing
                                  89 MtCO2
CO2 emissions                                    50 MtCO2               38 MtCO2
                                   (2016)
NO2 emissions                    182 kt (2015)     56 kt                     42 kt
PM10 emissions                   3.2 kt (2015)     0.9 kt                    0.7 kt
Accelerating the EV transition                                     8

Overview

Summary and key messages

Part 1: Impacts of a 2030 phase out on the road transport sector

Part 2: Impacts on the UK automotive sector

Part 3: Implications for environment and energy

Part 4: Implications for the electricity system
Accelerating the EV transition                                                         9

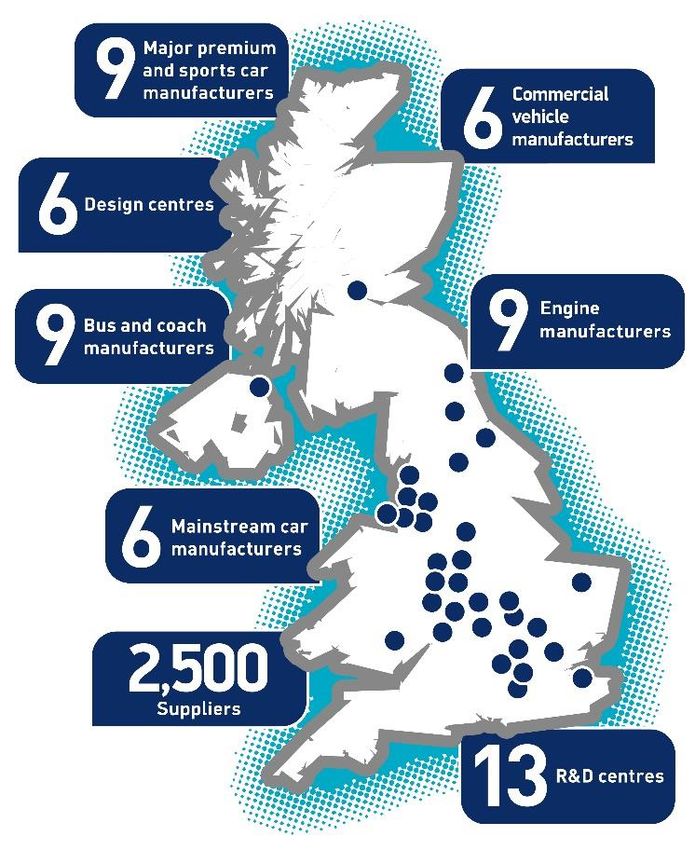
Key facts about UK automotive

— 6 volume manufacturers: Jaguar-Land
  Rover (500k), Nissan (500k), MINI (200k),
  Toyota (200k), Honda (100k), Vauxhall
  (100k). 4th largest in Europe.
— 1.7 million cars manufactured, and rising,
  of which 1.35 million are exported.
— 88% cars consumed are imported, although
  3 of the top 10 sold models (Nissan
  Qashqai, Vauxhall and MINI) made here.
— Over 37%* of cars in UK production are
  premium vehicles.
— A comparative advantage in car
  manufacture but relative weakness in
  parts, with 42% of UK made components in
  UK made cars, compared to 60%** in
  Germany and France.
        —       Notable exception is ICE engines.

* 2010 estimate, likely to have increased since                         Source: SMMT
** Based on anecdotal evidence as published by the Automotive Council
Accelerating the EV transition                                                                                                                                                                                    10

  A 2030 phase out could increase electric vehicles to around 20
  million in 2030, from 13 million under a 2040 phase out

                                                  Electric vehicle sales                                                                                Electric vehicle fleet
                            4.0                                                                                                  50
                            3.5                                                                                                  45
 Sales (million vehicles)

                                                                                                                                 40
                            3.0

                                                                                                              Million vehicles
                                                                                                                                 35
                            2.5                                                                                                  30
                            2.0                                                                                                  25
                            1.5                                                                                                  20
                                                                                                                                 15
                            1.0
                                                                                                                                 10
                            0.5                                                                                                   5
                            0.0                                                                                                   0
                                  2015   2020      2025        2030      2035      2040    2045      2050                             2015    2020      2025           2030      2035      2040    2045      2050

                                   Car     Van         Total          2040 phase out      2030 phase out                                Car     Van            Total          2040 phase out      2030 phase out

                                                 Sales (million vehicles)                                                                             Fleet (million vehicles)
Phase out                                       2020 2025 2030 2035                       2040        2050   Phase out                               2020 2025 2030 2035                           2040       2050
  2040 Car                                       0.2      0.9          1.8        2.4      3.0        3.0      2040 Car                               0.6         3.8         11.1       20.8     30.0       39.0
          Van                                    0.0      0.2          0.3        0.4      0.4        0.4              Van                            0.1         0.7          1.9        3.2      4.2        5.4
  2030 Car                                       0.2      1.5          3.0        3.0      3.0        3.0      2030 Car                               0.6         5.5         17.3       30.8     38.4       39.4
          Van                                    0.0      0.3          0.4        0.4      0.4        0.4              Van                            0.1         1.0          2.8        4.6      5.3        5.4
Accelerating the EV transition                                                                                                                                                                                         11

 Home and workplace charging infrastructure will be extensive; long-
 distance and parking-based infrastructure will be smaller scale

                                           Charging infrastructure needs                                                                                    Charging infrastructure costs
                               40,000                                                                                                    25,000
  Chargers (000s cumulative)

                                                                                                                  Cost (£m cumulative)
                               35,000
                                                                                                                                         20,000
                               30,000
                               25,000                                                                                                    15,000
                               20,000
                               15,000                                                                                                    10,000
                               10,000
                                                                                                                                          5,000
                                5,000
                                    0                                                                                                        0

                                        2020       2025        2030         2035            2040      2050                                           2020        2025        2030         2035            2040        2050

                                          Home            Workplace        Long-distance                                                               Home             Workplace        Long-distance
                                          Parking-based   2040 phase out   2030 phase out                                                              Parking-based    2040 phase out   2030 phase out

                                                 Chargers (000s, cumulative)                                                                                   Chargers (000s, cumulative)
Charging      Phase out                              2020     2025    2030          2035      2040     2050    Charging                           Phase out        2020     2025    2030   2035              2040       2050
Home          2040                                    600 4,000 11,000             21,000    28,000   28,000   Home                               2040              500 3,000 6,000 12,000                 15,000     15,000
              2030                                    600 5,000 17,000             27,000    28,000   28,000                                      2030              500 4,000 10,000 15,000                15,000     15,000
Workplace 2040                                        100      800 2,000            4,000     6,000    8,000   Workplace                          2040               90      500 1,000 2,000                3,000      4,000
              2030                                    100 1,000 3,000               6,000     8,000    8,000                                      2030               90      700 2,000 3,000                4,000      4,000
Long-distance 2040                                      1         1       1             2         3        4   Long-                              2040              16.7     23.6    30.0   56.3              81.3     105.8
              2030                                      1         1       2             3         4        4   distance                           2030              16.7     33.2    46.4   82.4            102.7      105.2
Parking-based 2040                                      6        10      30            50        70      100   Parking-                           2040              16.7     23.6 500.0 937.7             ######     ######
              2030                                      6        20      40            70        90       90   based                              2030              16.7     33.2 772.5 ######            ######     ######
Total         2040                                    700 5,000 13,000             25,000    34,000   35,000   Total                              2040              600 3,000 8,000 15,000                 20,000     22,000
              2030                                    700 7,000 21,000             33,000    35,000   36,000                                      2030              600 4,000 12,000 20,000                21,000     22,000
Accelerating the EV transition                                                     12

 2030 vehicles and chargers by nation

                                                                         Northern
                                   Total    England   Scotland   Wales    Ireland
Sales (millionCar                    3.0       2.6        0.2      0.1        0.1
vehicles)     Van                    0.4       0.4        0.0      0.0        0.0
Fleet (millionCar                   17.3      15.0        1.2      0.8        0.4
vehicles)     Van                    2.8       2.4        0.2      0.1        0.1
              Home                17344    14975.1    1164.3     762.8     441.6
Charge points Workplace            3469     2995.0     232.9     152.6      88.3
(thousand     Long-distance            2       1.6        0.1      0.1        0.0
chargers)     Parking-based           42      36.0        2.8      1.8        1.1
Accelerating the EV transition                                                                                                                                                     13

A 2030 phase out would reduce oil demand by around by around 4.4
million tonnes of oil equivalent (mtoe), or 15% of net imports in 2030

                                                      Oil production and consumption                                             Provenance of oil imports, 2016
                                         80
 Oil production and consumption (mtoe)

                                         70
                                                                                                                           Other, 26%
                                         60                                                                                                                      Norwa y, 34%
                                         50
                                         40
                                         30                                                                                                     84 mtoe
                                         20
                                         10
                                                                                                                  Sa udi Arabia, 4%             in 2016
                                          0                                                                        Sweden, 4%
                                              2015           2020         2025         2030         2035                                                             Rus sian
                                                                                                                                                                  Federation, 9%
                                                                                                            Bel gium, 4%
                                                     Net imports      Consumption      Production
                                                                                                                  Ni geria, 4%                               Netherlands, 9%
                                                     2040 phase out   2030 phase out                                                    Uni ted States, 7%

This could save around £2 billion per year                                                                 Oil and oil products are highly traded;
(with a range of £1.4-3.1 billion),                                                                        while net imports of oil and oil products
depending on oil prices.                                                                                   to the UK were around 25 mtoe, total
                                                                                                           imports were 84 mtoe, and total exports
                                                                                                           around 59 mtoe.
Accelerating the EV transition                                     14

Overview

Summary and key messages

Part 1: Impacts of a 2030 phase out on the road transport sector

Part 2: Impacts on the UK automotive sector

Part 3: Implications for environment and energy

Part 4: Implications for the electricity system
Accelerating the EV transition                                                                                 15

A 2030 Phase out makes the UK the dominant EV market in
Europe, which may impact the size of its automotive industry

                             ANALYSING THE IMPACT OF UK EV SALES ON UK AUTOMOTIVE PRODUCTION

   The complex automotive trade picture across Europe means that an increase in the UK market
   does not directly imply an increase in UK EV production.
   To illustrate the impact of a 2030 Phase out on EV, ICE and parts production, we compare gross
   value added and jobs in two 2030 scenarios to the modelled outcomes for a 2040 Phase out.

                          “2030” scenario assumes EV trade patterns will follow existing ICE trade patterns.
                          For example, it assumes the UK will continue to produce 15% of the cars sold in
                          the UK.

                          “2030+” scenario shows the potential impact of the increased attractiveness as a
                          manufacturing location given its dominant market. This is captured by showing
                          the impact of 1 additional manufacturing plant, and the knock on impacts this has
                          on parts manufacturing in the UK.
Accelerating the EV transition                                                                                                        16

The highly traded European market means that increased UK
sales do not translate 1 for 1 into increased UK production

   2030 scenario: To reflect that the majority of UK EV sales are likely imported, and the majority of production
   exported, the “2030” scenario assumes the future UK share of its own and the EU market stays the same as
   its current share of the ICE markets.

                    Domestic car sales per country                                       Car production per country

                                       85% of UK sales are                                                  82% of UK production is
                                       imported                                                             exported

   Note: import and export car numbers for France are estimated based on average car cost and trade value
Accelerating the EV transition                                                                              17

However, market proximity is one of the key factors determining the
attractiveness of the UK as an EV production site

                                 Ingredients for car manufacturing attractiveness
The corners of the                                           — Market proximity reduces transport
triangle are key
                                   Market                      costs of produces vehicles and, all else
factors affecting
location decisions for             proximity                   equal, producers will optimise their
producers. However,                                            location to be closest to their major
factors such as                                                demand centres.
existing business
relationships and                                            — Parts availability is an important factor
other local ties are                                           in location decisions. EU parts are highly
also important.                     Optimal                    traded, but any location must have
                                    location                   access to established supply chains to
                                                               be competitive.
                                                              — Manufacturing productivity is key for
                                                                location decisions. It largely depends on
           Manufacturing                         Parts          labour productivity, tax regimes and a
           productivity                          availability   variety of other factors such as the cost
                                                                of ancillary services etc.
Accelerating the EV transition                              18

The UK industry is focussed on assembly rather than parts
Accelerating the EV transition                                                                                                           19

The UK is likely to become more attractive for EV production
than it already is to ICE producers

2030+ scenario: To reflect the increased UK attractiveness to EV production, the UK is modelled to attract
additional (to the 2030 scenario) production equivalent to a medium size assembly plant, including associated
parts production.

                                                                         Category                      2030 EV compared to current ICE
 1      UK EV sales more dominant than current ICE sales
                                                                         Proximity to demand
               2017 ICE            2030 EV         2030 EV               Manufacturing productivity
                 sales              sales           sales
                                                                         Parts availability

                                                                         3     Current UK disadvantage in parts less important for EVs

                                                                         The UK currently
                                                                         produces fewer ICE
                                                                         powertrain parts than
                                                                         Germany and France,
                                                                         thus losing some
 2      Little difference in productivity across EU                      assembly to those
                                                                         countries.
                                 US    FR    GER     IT   NL       UK
                                                                         EV assembly drives a
     Average rank across                                                 shift away from ICE
     9 categories                                                        powertrain parts, and
     affecting                   3.6   2.8   3.3    3.7      3.6   3.6   a more level playing
     automotive
                                                                         field in vehicle
     productivity
                                                                         assembly.
Accelerating the EV transition                                                                                         20

A change in the phase out date change the proportion of ICE
and EV production in the UK, and may encourage growth

                                              UK vehicle (ICE+EV) production in 2030

                                                                                       Total production could
                                 Total cars produced does not change between a
                                                                                       increase due to 2030 Phase
                                 2040 and 2030 Phase out, but the share of EV in
                                                                                       out, given the UK’s potential
                                 total production does increase.
                                                                                       advantages in EV production
                                                                                       (relative to ICE).
Accelerating the EV transition                                                    21

The 2030 Phase out would significantly increase EV related
GVA, and leave total automotive GVA nearly constant

                                 2030 Phase out   Scenario comparison (in 2030)
Accelerating the EV transition                                                                             22

A 2030 phase out will bring forward a shift from ICE to EV jobs
compared to a 2040 phase out, and could add further jobs

                    Scenario comparison (in 2030)           Difference between a 2040 and 2030 Phase out

                                                                1 EV assembly jobs increase by 8,000
                                                                —
                                                    4
                                                                  in a 2030 Phase out, replacing ICE
                                                                  jobs and a further 5,000 are added
                                                                  in the 2030+ scenario.
                                                        2       2 EV parts (compatible with both EVs
                                                                —
                                         2
                                                                  and ICEs) show a large increase in
                                                    3             jobs of 12,000 in the 2030 scenario
                                                                  and a further 7,000 in 2030+.
                                         1              1
                                                                —
                                                                3 Engine and other ICE only
                                                                  manufacturing jobs decrease by
                                                                  2,000 and 1,500 respectively
                                                                  compared to the 2040 Phase out.
                                                                —
                                                                4 Although speculative, an additional
                                                                  14,000 jobs may be supported
                                                                  through EV powertrain and charging
                                                                  point manufacture.
Accelerating the EV transition                                                                  23

Most automotive jobs are likely to shift relatively smoothly
from ICE to EV, without being lost

                           Jobs in a 2030 Phase out         Scenario comparison (in 2030)

                                                      Approximately a third of jobs are in
                                                      components shared by both EVs and
                                                      ICEs, such as suspension and vehicle
                                                      bodies. Production of such parts will
                                                      continue, requiring minimal change
                                                      adaptation by the workforce.
                                                      Approximately half of jobs are in
                                                      assembly. The skills for EV and ICE
                                                      assembly are likely to stay relatively
                                                      constant – with the shift likely
                                                      comparable to regular training
                                                      provided when ICE model changes are
                                                      made. Hence, lost ICE assembly jobs
                                                      are likely to shift relatively smoothly
                                                      into EV assembly jobs.
Accelerating the EV transition                                     24

Overview

Summary and key messages

Part 1: Impacts of a 2030 phase out on the road transport sector

Part 2: Impacts on the UK automotive sector

Part 3: Implications for environment and energy

Part 4: Implications for the electricity system
Accelerating the EV transition                                                                         25

A 2030 phase out would reduce CO2 emissions by 62 MtCO2 2028-32,
around 53% of the projected Fifth Carbon Budget exceedance

                     100
                      90
                      80
                      70
                      60
             MtCO2

                      50
                      40
                      30
                      20
                      10
                       0
                            2015             2020           2025              2030              2035

                                 Car   Van          Total    2040 phase out          2030 phase out
Accelerating the EV transition                                                                                                                                       26

 It would also reduce NOx emissions, delivering health and wider
 benefits

                                             LDV pollutant emissions                                                     2030 pollutant reductions
                       200                                                                     8
                       180
                       160
                                                                                               7                         • 14 kt reduction (NOx);

                                                                                                   PM10 emissions (kt)
  NOx emissions (kt)

                                                                                               6
                       140
                       120                                                                     5                         • 0.2 kt reduction (PM10).
                       100                                                                     4
                        80
                        60
                                                                                               3
                                                                                                                         These reductions are valued at £127-485
                                                                                               2
                        40
                        20                                                                     1
                                                                                                                         million, reflecting reduction in disease,
                         0                                                                     0                         healthcare costs and lost productivity.
                             2015     2020    2025   2030      2035      2040   2045    2050

                                NOx          PM10           2040 phase out       2030 phase out                          Policy Exchange estimated that
Values of change in air quality (£m)                                                                                     • the impact of NO2 concentrations in
                     NOx          PM10                                                      Total                          London failing to improve beyond
Central             294.5          12.1                                                    306.6                           2025 at up to 12.2 million life years;
Low                 117.8           9.5                                                      127
High                471.1          13.8                                                      485                         • introducing 220,000 electric vehicles
Source: HMT Green Book                                                                                                     to London could increase average life
                                                                                                                           expectancy by 1.1 million life years.
Accelerating the EV transition                                                                                                              27

Impacts of the 2030 phase out on non-compliant reporting
zones would be modest

                                40

                                                                                                                  Baseline
                                35

                                                                                                                  EV 2030 scenario

                                30
                                                                                                                  Air quality plan
      Number of non-compliant

                                25
         reporting zones

                                20

                                15

                                10

                                5

                                0
                                     2018   2019   2020   2021   2022   2023   2024   2025   2026   2027   2028      2029            2030
Accelerating the EV transition                          28

Overview

Summary and key messages

Part 1: Impact of a 2030 phase out on stock and sales

Part 2: Impacts on the UK automotive sector

Part 3: Implications for environment and energy

Part 4: Implications for the electricity system
Accelerating the EV transition                                                                                                          29

The 2030 scenario with smart charging is cheaper than the
2040 scenario with standard charging (1)

                                         40
                                                                                                         0.5
                                         35                 0.3                                                       0.1         0.1
                                                                           0.1            0.0            3.3
                                                            2.1                                                       2.1
  Total electricity system costs (£bn)

                                                                           1.3            1.2                                     2.0
                                         30
                                                10.2
                                         25

                                         20      3.6

                                         15

                                         10     18.4

                                         5

                                         0
                                              Before EV   Standard        Smart           V2G         Standard       Smart        V2G
                                              charging
                                                                      2040 phase out                             2030 phase out
                                                                     Generation    Transmission   Distribution
Accelerating the EV transition                                                                                                                                  30

The 2030 scenario with smart charging is cheaper than the
2040 scenario with standard charging (2)

                                                           5.0
  Change in total electricity system costs in 2030 (£bn)

                                                           4.0

                                                                                                           0.5           0.4

                                                           3.0
                                                                                                                         1.2
                                                                                                                                           0.1
                                                                   0.3           0.3                                                             Distribution
                                                           2.0                                                                                   Generation
                                                                                 0.8               0.0
                                                                                                           3.3                       0.1

                                                           1.0     2.1
                                                                                             0.1

                                                           0.0
                                                                 Standard       Smart        V2G         Standard       Smart        V2G
                                                                            2040 phase out                          2030 phase out
Accelerating the EV transition                                                                                         31

The cost savings from smart charging and vehicle to grid are
primarily driven by their impact on the capacity mix

                  200

                  180
                                                                     27
                  160              25
                                                                                   32          31
                                                 32          31                                      Other
                  140                                                35
                                   32                                                                Margin
                                                                                   24          24
                                                 22
  Capacity (GW)

                  120                                        22
                                                                                                     Peaking
                  100                                                46                              Solar PV
                                   41                                              40          40
                                                 35          34
                        20                                                                           Onshore wind
                   80
                        13         16            16          16      18            16          16    Offshore wind
                   60   11                                                                           Large-scale gas
                         5
                   40              40            40          40      40            40          40    Hydro
                        38                                                                           Nuclear
                   20
                                   16            14          13      16            13          13
                    0    9         4.5           4.5         4.5     4.5           4.5         4.5
                                 Standard       Smart        V2G   Standard       Smart        V2G
                        2017                2040 phase out                    2030 phase out
Accelerating the EV transition                                                                                                                                               32

Standard charging could add £175 per year to a driver’s electricity
bill; smart charging and/or V2G could reduce this by 42-49%.

                                                    900
                                                                8                    4
                                                                                                                                8
  Annual dual-fuel household electricity bill (£)

                                                    800
                                                                            37                                                              37       71
                                                                                     70                                                     51
                                                    700                     51                       11                                                            7
                                                                    165                      34              33                     168                    34          33
                                                                                             51              51                                            51          51
                                                    600   29                                                               29
                                                          51                                                               51
                                                    500

                                                    400
                                                                            691                                                             693
                                                    300                                     621             610                                            622         616
                                                          525                                                             525
                                                    200

                                                    100

                                                      0
                                                                          Standard         Smart            V2G                           Standard        Smart        V2G
                                                           No EVs                         2040 phase out                     No EVs                   2030 phase out
                                                                                          Electricity system costs   Policy costs     VAT
Accelerating the EV transition                                                                      33

The value of repurposing EV batteries in 2050 could be as high as £1
billion in the 2040 scenario, and higher in the 2030 scenario

▪ If 50% of electric vehicle batteries can be repurposed and used productively in the electricity
  system, their value could be £240-400 million in 2040 and £1-1.3 billion in 2050.
▪ By 2050, this value is around 4% of the total cost of the electricity system, and could reduce
  total electricity prices and consumer bills by a similar proportion.
▪ For repurposing to have a material value, innovations are needed to achieve a minimum lifetime
  and maximum repurposing cost.

                                 Value of repurposed EV batteries     High need
                                 2040                2040 scenario   £250 million
                                                     2030 scenario   £400 million
                                 2050                2040 scenario    £1 billion
                                                     2030 scenario   £1.3 billion
Accelerating the EV transition                                                                                                                              34

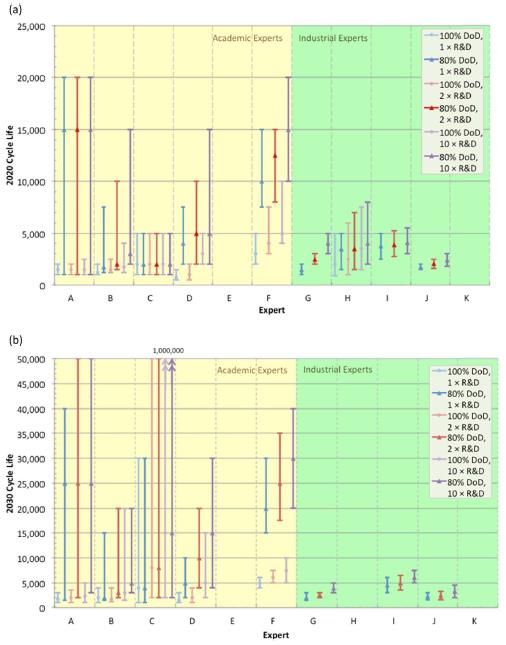
Battery cycle lives are projected to be adequate for vehicle to
grid and subsequent repurposing as stationary storage

▪ An electric car                                                                                             ▪ A real-world trial with Tesla Model S supports
  battery would use                                                                                             the assumption of high cycle life:
  around 700 cycles
  over its lifetime.
▪ Academic and
  industry experts
  estimated a range
  of lithium ion
  battery cycle life
  of 1,500 to 15,000
  cycles in 2020.
▪ This range
  increases to 2,000
  to 30,000 cycles in                                                                                         ▪ This implies a cycle life of around 3,500
  2030.                                                                                                         cycles.

                                                                                                              ▪ Analysis of the Imperial modelling results
                                                                                                                suggest 160 cycles per year for a stationary
                                                                                                                storage battery. If a repurposed battery lasts
                                                                                                                10 years this implies an additional 1,600
                                                                                                                cycles, or 2,400 in total.

Few et al. (2018): Prospective improvements in cost and cycle life of off-grid lithium-ion battery packs: An analysis informed by expert
elicitations
Accelerating the EV transition                                                                                               35

However, there is significant uncertainty over future calendar
life

▪Element
    NissanEnergy (2012): Cost and performance of EV batteries
            provides an 8 year warranty on the LEAF’s battery.
▪ Element Energy (2012) estimated that “based on the expected improvements
    in thermal control and management, it is reasonable to assume that future
    cells will achieve a 12 year lifetime (temperate climates) from 2020.”
▪ The United States Advanced Battery Consortium (USABC)1 have a goal for a
    calendar life of 15 Years for batteries commercialised in 2020.
▪ The prospect of a calendar life that significantly exceeds the lifetime of a
    vehicle is therefore currently speculative.
▪ We assume a calendar life of 23 years: 13 in a vehicle; 10 as stationary storage.
1 Part of United States Council for Automotive Research, comprising Chrysler, Ford, General Motors; collaborative research
organisation aiming to strengthen U.S. auto industry technology base
Element Energy (2012): Cost and performance of EV batteries
Accelerating the EV transition                                                                                                                    36

The costs of repurposing an electric vehicle battery for
stationary storage could range from £75-£200/kWh

                     Cost per kWh of a re-habilitated battery.

                                                                                                     ▪ Direct re-use: minimal repurposing.
                                                                                                     ▪ Module re-work: dismount battery,
                                                                                                       rearrange cell configurations and repackage
                                                                                                       for second use.

                                                                                                     Repurposing an battery involves
                                                                                                     ▪ Dismantling the battery;
                                                                                                     ▪ Testing the modules or cells;
                                                                                                     ▪ Regrouping the modules or cells for the
                                                                                                        new application;
                                                                                                     ▪ Installation of new refrigeration system and
                                                                                                        Battery Management System (BMS).

                                                                                                     Costs are highly uncertain
                                                                                                     ▪ Very few specific studies;
                                                                                                     ▪ Typically not linked to specific grid
                                                                                                        applications.
Source: Casals et al. (2014): A cost analysis of electric vehicle batteries second life businesses
Accelerating the EV transition                                                                                                                              37

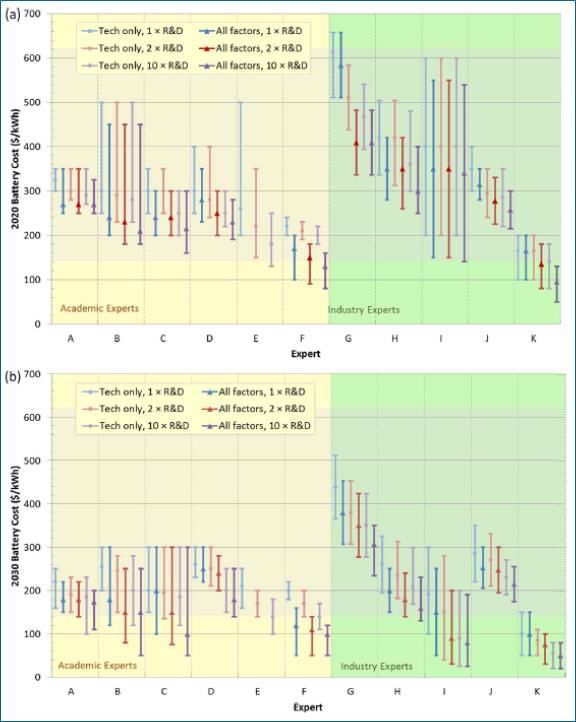
Repurposed electric vehicle batteries will need to compete with
new, dedicated stationary storage batteries on cost

▪ Academic and                                                                                                ▪ Cost projections from the International
  industry experts                                                                                              Renewable Energy Agency (IRENA) suggest
  estimated a range                                                                                             that lithium nickel manganese cobalt oxide
  of lithium-ion                                                                                                (the battery chemistry currently used in the
  battery costs of                                                                                              Nissan Leaf) could decrease in cost to
  $100-$600/kWh in                                                                                              $145/kWh (£105) in 2030.
  2020, with an
  average of
                                                                                                              ▪ The likelihood that repurposing EV batteries
  $300/kWh (£220).
                                                                                                                will be cheaper than producing new
▪ This range
                                                                                                                batteries in 2030 and beyond is uncertain
  decreased to $50-
                                                                                                              ▪ Battery cost estimates do not take into
  $400/kWh in
                                                                                                                account recycling of materials; this blurs the
  2030, with an
                                                                                                                line between repurposing and new
  average of
                                                                                                                batteries.
  $200/kWh (£150).

Few et al. (2018): Prospective improvements in cost and cycle life of off-grid lithium-ion battery packs: An analysis informed by expert elicitations
Accelerating the EV transition                                                                                            38

                                 Contact us:                         Author contact details: Eric Ling
                                 163 Eversholt Street                T: +44 (0)844 8000 254
                                 London                              E: eric.ling@vivideconomics.com
                                 NW1 1BU

                                 Company Profile

                                 Vivid Economics is a leading strategic economics consultancy with global reach. We
                                 strive to create lasting value for our clients, both in government and the private
                                 sector, and for society at large.

                                 We are a premier consultant in the policy-commerce interface and resource and
                                 environment-intensive sectors, where we advise on the most critical and complex
                                 policy and commercial questions facing clients around the world.
                                 The success we bring to our clients reflects a strong partnership culture, solid
                                 foundation of skills and analytical assets, and close cooperation with a large network
                                 of contacts across key organisations.

                                 Practice areas
                                 Energy & Industry                     Growth & Development
                                 Natural Resources                     Competitiveness & Innovation
                                 Public & Private Finance              Cities & Infrastructure
You can also read