Greater Cambridge Local Plan

  Initial evidence base and
 spatial options assessment

       Public webinar
←
→
Page content transcription
If your browser does not render page correctly, please read the page content below
Greater Cambridge Local Plan
Initial evidence base and
spatial options assessment
Public webinar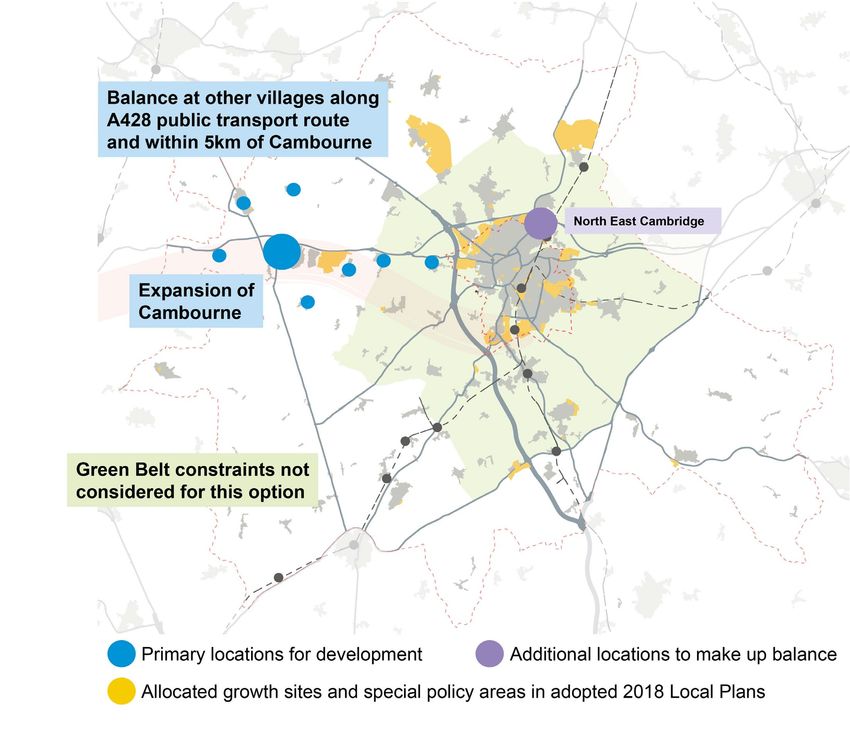
Welcome and introduction

Process of Local Plan preparation
     First Call for Sites, initial
    stakeholder engagement,          Publish consultation and Calls for
         preparatory work                     Sites responses
      Spring 2019 onwards                    September 2020

 First Conversation consultation     Publish initial evidence findings,
   (Issues & Options + Call for      further stakeholder engagement
        Sites/Green Sites)                 Autumn-Winter 2020
          Jan-Feb 2020

                                        Preferred Options public
                                              consultation
                                         Summer/Autumn 2021                 Proposed Submission Plan
                                                                                public consultation
                                                                          Spring 2023/Autumn-Winter 2023
                                     Publish further evidence findings,
                                     further stakeholder engagement
                                                                           Submission to Secretary of State
                                                                             Autumn 2023/Spring 2024
                                         Draft Local Plan public
                                              consultation
                                             Summer 2022                      Examination and adoption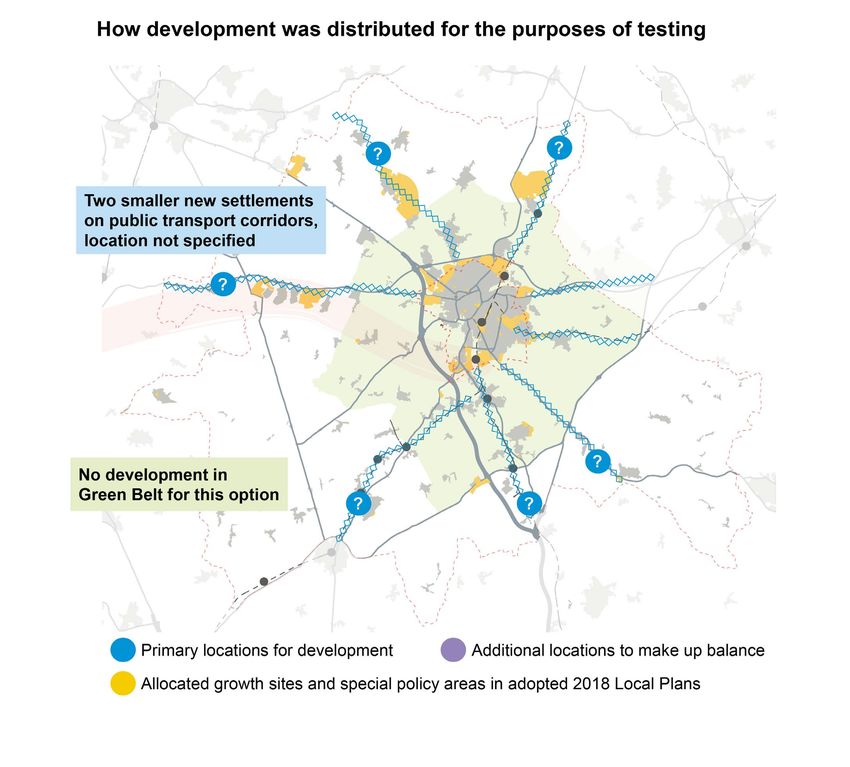
Big themes and strategic vision

                           • In the First Conversation, 73% of those who
                             answered the question either agreed or
                             strongly agreed that we had identified the
                             right themes
                           • Climate change was viewed as the highest
                             priority theme
                           • Wellbeing and social inclusion was the
                             second highest priority for respondents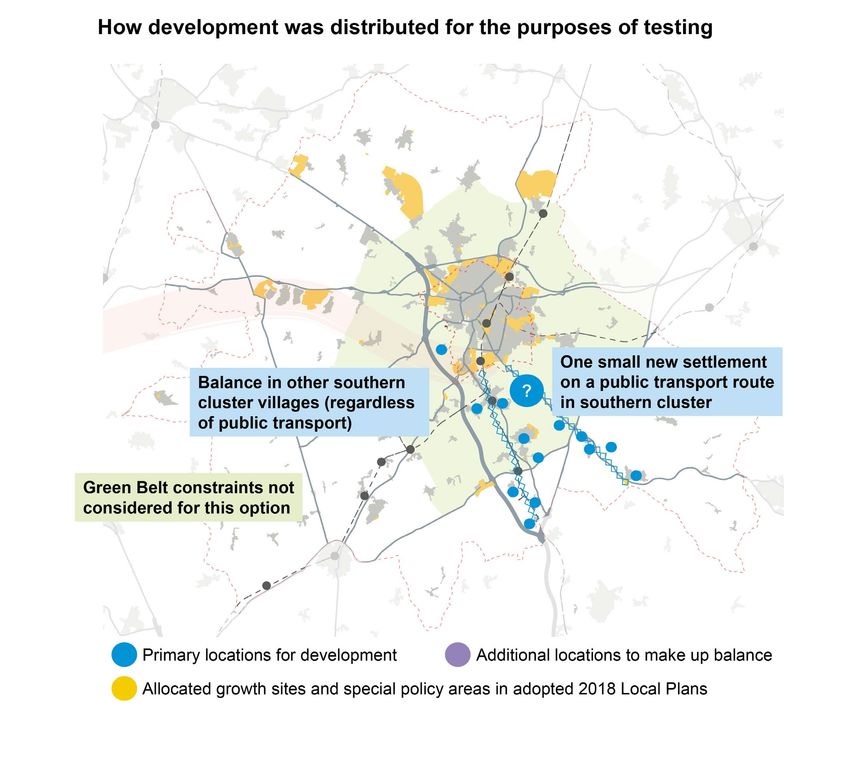
Wider context

                • Ox Cam Arc and East-West Rail
                • City Deal - £500m of investment based on supporting
                  growth identified in 2018 Local Plans
                • Combined Authority’s Local Transport Plan and Non-
                  Statutory Spatial Framework

                • Greater Cambridge is strategically significant
                  nationally and regionally
                • Planning here must be mindful of this context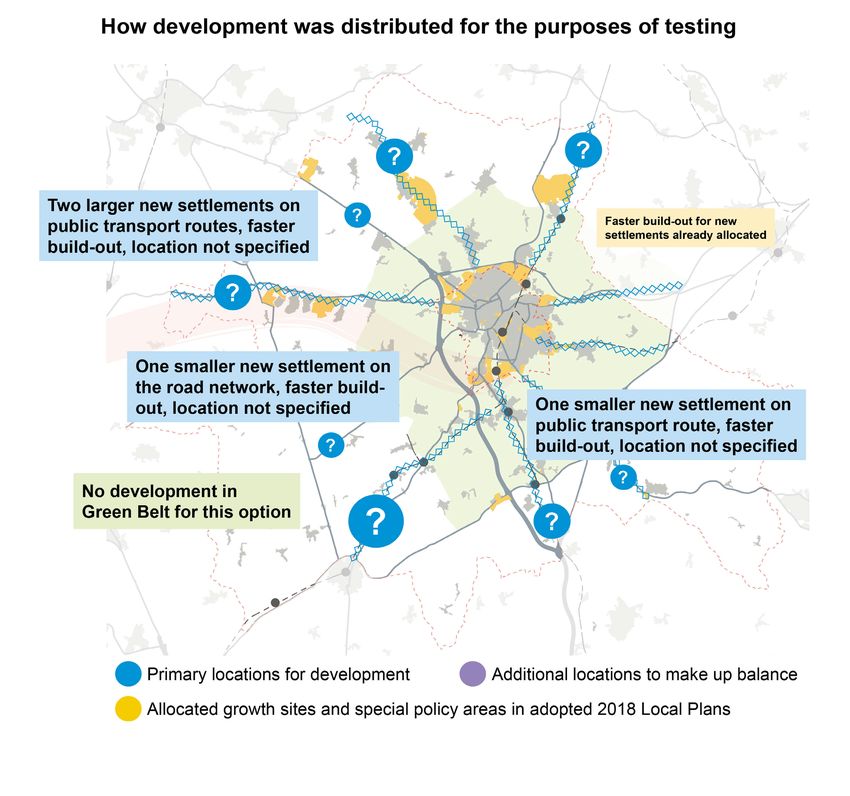
Requirements for a sound Local Plan
• What the key considerations are for plan making i.e. what makes a sound plan?

• Paragraph 35 of NPPF 2019:

    • Positively prepared - ‘as a minimum, seeks to meet the area’s objectively assessed
      need’
    • Justified – ‘An appropriate strategy, taking into account reasonable alternatives’
    • Effective – ‘Deliverable’
    • Consistent with national Policy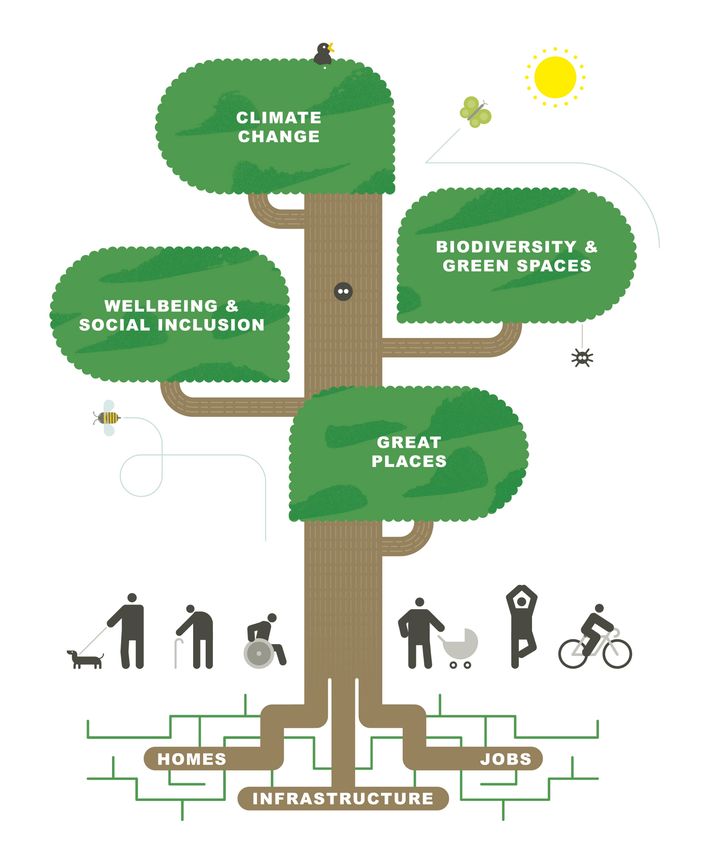
What have we done in this stage?

• Commissioning specialist consultants to gather and analyse a range of baseline data
  and evidence
• Calculating the minimum requirement for new housing according to national
  government’s ‘standard method’ and the jobs it would support
• Forecasting future economic growth in Greater Cambridge, and translating this into
  medium and maximum growth level options;
• Calculating what the housing levels would be to support those medium and maximum
  levels of forecast economic growth;
• Identifying a range of possible broad locations for new development, illustrating
  deliberately diverse approaches
• Testing the possible growth levels across each of the different locations
• Asking our specialist consultants to assess how well each of these strategic spatial
  options performs
Why have we published this?

• For consideration by the Joint Local Planning Advisory Group
• Being transparent with our stakeholders and communities as we learn
  more about the key issues
• Asking community representatives and stakeholders to ‘kick the
  tyres’ and help us test the implications of the evidence through
  workshops with different interest groups
How much growth to plan for?
Calculating consistent scales of growth for
homes and jobs

Influencing factors

• Housing affordability

• Nationally significant      Minimum Growth: Take the Government’s standard method homes
                                  calculation and calculate the jobs that these would support.
  economic strengths

• Continued growth in jobs
  in knowledge intensive
  sectors

• Data suggests significant
  proportion of employment
  forecast in adopted Local       Higher Growth: Forecast jobs based on detailed evidence for
  Plans for 2011-31              Greater Cambridge, and calculate the homes required to support
  already delivered.                                        these.
Identifying options: Jobs and homes • Minimum – government standard method homes • Medium – economic forecast considered the most likely outcome as it takes into account long term historic employment growth (including the fast growth in key sectors in the recent past) • Maximum – economic forecast placing greater weight on fast jobs growth in the recent past, particularly in key sectors for Greater Cambridge Growth scenario Employment Employment Housing Housing 2020-41 (jobs) Total (jobs) per year (dwellings) Total (dwellings) per year Local Plans 2018 44,100 2,205 33,500 1,675 (2011 to 2031) Minimum 45,800 2,181 36,700 1,743 Medium 58,500 2,786 42,000 2,000 Maximum 78,700 3,748 56,500 2,690
Housing to support each growth level

• 10% buffer to give flexibility for the Plan to adapt to rapid change as required.
• Significant amount of housing supply from planning permissions already granted and sites
  included in the adopted 2018 Local Plans, that will be delivered during the period of the new
  Local Plan.

  Growth option          Total housing (inc 10%        Development already in         Additional housing to be
                         buffer)                       the pipeline (including        allocated sites in the
  2020 to 2041                                         windfalls)                     new Local Plan
  Minimum
                         40,300                        36,400                         3,900
  Medium
                         46,200                        36,400                         9,800
  Maximum
                         62,700                        36,400                         26,300
Housing to support each growth level
Development already in the
pipeline, 2020-2041
Minimum growth level Medium growth level Maximum growth levelGrowth level options – implications for neighbouring
authorities
• If Greater Cambridge delivers a higher number of jobs than the ‘standard method’
minimum number of homes would support, then either:
• More homes would need to be provided in neighbouring Local Authority areas
• Greater Cambridge would need to provide more homes
• At this stage, for the purposes of testing, we have assumed that:
• For the medium option, the current % split between workers commuting into the
area, and living in Greater Cambridge, continues
• This means additional homes would be provided outside Greater Cambridge
according to this proportion.
• This equates to an additional 2,400 homes over the Plan period being delivered in
neighbouring authority areas – above and beyond what the ‘standard method’ would
be for them
• For the maximum option, we have assumed all 3,000 additional homes are provided
within Greater Cambridge (no extra homes in neighbouring authority areas)What about Covid and Brexit? • Our evidence doesn’t account for Covid or Brexit, because data is not yet available at this point to fully understand the impact and what long-term shifts may result • We will be looking to update our evidence as new data becomes available • Greater Cambridge’s economy includes a wide range of jobs, not all of which can be done from home • In October, only 24% of workers were working exclusively from home nationally, despite severe restrictions being in place, so the impact on demand for workspace and transport to work may not be as great as some commentators anticipate.
What are the key evidence findings so far?
Key findings: Net Zero Carbon study

• Carbon emissions associated with each new home would be 6-13 tonnes/CO2
  per year – with ambitious net zero carbon policies this would reduce to 2-9
  tonnes/CO2
• With ambitious net zero policies, almost no energy would be used in running
  costs of buildings and less than 1 tonne/CO2 in the construction (annualised over
  lifetime of home) – the rest of the CO2 is generated by user travel patterns
• Ambitious net zero policies will impact the cost of development and therefore
  viability
• Village locations create 3x as much CO2 as urban locations in terms of transport
Net Zero Carbon – emissions per home
Carbon emissions in Greater Cambridge
Key findings: Integrated Water Management Study

Key messages:
• No environmental capacity for new local plan to be supplied through increased
   abstraction from chalk aquifer.
• Future water demand will need to be balanced by a range of measures in other
   ways, including greater water efficiency, reducing leakages and shifting to more
   sustainable water sources, to ensure no additional detrimental environmental impact
   from future growth.

•   Minimum growth option capable of being accommodated.
•   Water supply is a potential deal-breaker for a maximum growth option
•   Regional scale interventions, such as new reservoirs, are unlikely to be available
    until after the start of the local plan period following normal funding processes.
•   Significant issues for government to consider when exploring growth in our area
    through Ox-Cam Arc
Key findings: Housing delivery • Options that mix short-medium term sources of supply with longer term sources would create a more deliverable, smoother trajectory • Delivering the high option annual growth rate on a consistent basis unlikely to be deliverable • Higher growth options require faster build out of sites, not realistic without some form of intervention, and still issue of market absorption (i.e. how quickly homes can be sold in an area) to consider. • Medium growth option could be exceeded and still deliverable, but the exact figure needs detailed testing
Minimum growth level – opportunities and challenges

Opportunities

Climate change:
Water Supply: Measures necessary to prevent detrimental impacts before regional scale water supply
solutions are operational, but these are likely to be achievable.

Homes:
Levels of housing growth considered deliverable.
Largely met by existing commitments over the plan period as a whole, additional supply is needed
after 2031 to sustain delivery.

Challenges

Home and Jobs:
Standard method homes and related jobs would not respond to CPIER recommendation to look at
higher growth in jobs and homes than normal modelling, which would not fully reflect Greater
Cambridge’s key growth sectors.
Medium growth level – opportunities and challenges

Opportunities

Homes and Jobs:
Would respond to central scenario jobs growth (reflecting longer term past trends,
including in Greater Cambridge’s key growth sectors) with related number of homes.

Homes:
Levels of housing growth considered deliverable.
Requires a more significant increase in supply later plan period.

Challenges

Climate change:
Plausible that water supply is achievable, but there would be challenges to address
until strategic solutions become available.
Maximum growth level – opportunities and
challenges
Opportunities
Home and Jobs:
Would reflect high growth in Greater Cambridge’s key growth sectors in the recent
past into the longer term with related number of homes.

Challenges
Climate change:
Water Supply: ‘deal breaker’ constraints on water supply given need for new regional
scale interventions, and under normal process / timescale for their delivery.

Homes:
Housing Delivery: Would require a significant increase in delivery throughout plan
period, not deliverable in practice based on current market conditions and based on
the UK housing market’s traditional routes to delivery.
Strategic spatial options
Broad locations suggested in the First Conversation

 1: Densification          2: Edge of Cambridge, not   3: Edge of Cambridge, in   4: New settlements
                           in Green Belt               Green Belt

5 Dispersal to villages   6: Focus on public
                          transport corridors
Identifying other spatial approaches • Important to make sure we test all reasonable options. • The six spatial options suggested in the First Conversation consultation needed to be tested and confirmed. • We also needed to check whether there were other reasonable spatial options. • Review of different spatial ideas, examples and good practice. • From a long list of 97 ideas, 29 were shortlisted and considered. • Two broad spatial options considered sufficiently different to add to the original six.
Broad locations being tested

 1: Densification          2: Edge of Cambridge, not   3: Edge of Cambridge, in       4: New settlements
                           in Green Belt               Green Belt

5 Dispersal to villages   6: Focus on public           7. Southern cluster              8. Western cluster (focus
                          transport corridors          (integrating jobs and homes)     on transport node)
Mapping the growth levels onto the broad locations • Each growth level was applied to each broad location – resulting in 24 strategic spatial options for testing • Primary focus of the spatial option was used to supply as many of the homes as possible for each growth level option • Where this would not be enough (under market conditions) to meet growth level, additional sources of supply were used to make up the numbers – using locations most aligned to the focus of the spatial scenario • For the maximum growth level, all options assumed higher delivery rates although it is currently unclear how these would be achieved
1. Densification – minimum
Relatively low numbers required, achievable at
lower densities
Opportunities
• Carbon – best option (lowest emissions)
• Transport – best active travel mode share
• Landscape - more limited impacts
• Housing & employment – located in
desirable and accessible locations
Challenges
• Infrastructure/green infrastructure –
burden on existing
• Water – flood risk + existing infrastructure
• Employment & housing – not suitable for
all key sector uses / housing mix types
Minimum housing growth does not reflect
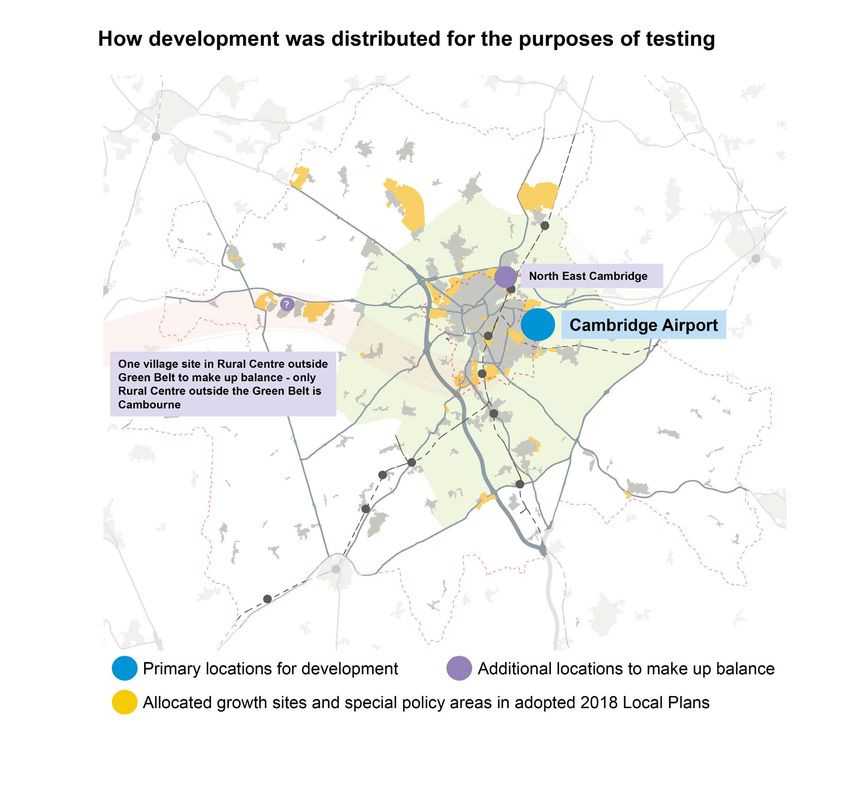
recent and potential future jobs growth1. Densification – medium growth level
• Medium growth level requires additional
sources of supply
• Cambridge Airport and Edge of Cambridge
(Green Belt) were added for the purposes
of testing as these are most consistent
with the aim of this scenario i.e.
concentrating growth in and around the
City
Opportunities/challenges (compared to
minimum growth scenario):
• Greater impacts on townscape and
landscape
• Increased pressure on green infrastructure1. Densification – maximum growth level
• Maximum growth in this scenario requires
higher density development in the City and
faster delivery rates on North East
Cambridge and Cambridge Airport.
Opportunities/challenges (compared to
minimum growth scenario):
• Further impacts on townscape/landscape
• Further pressure on green infrastructure
As with all maximum growth scenarios:
• Water supply potential ‘deal breaker’
• Housing delivery rate not currently
deliverable
• Infrastructure requires big-ticket items2. Edge of Cambridge (not in Green Belt) – minimum
• Airport is the only site on the edge of
Cambridge that is not in the Green Belt
• Additional sources of supply are required
Opportunities
• Water – best option due to low flood risk and
opportunities for infrastructure
• Transport – highest active travel mode share
• Equality – accessibility and services
• Housing & employment – accessible
employment, can accommodate range of
sectors and housing types
Challenges
• Housing delivery risk
• New infrastructure/decontamination costs
Minimum housing growth does not reflect
recent and potential future jobs growth2. Edge of Cambridge (not in Green Belt) – medium
• Medium growth level uses historic delivery
rates and therefore requires additional
sources of supply
Opportunities/challenges (compared to
minimum growth scenario):
• Greater impacts on townscape and
landscape
• Increased pressure on green infrastructure2. Edge of Cambridge (not in Green Belt) – maximum
• Maximum growth scenario involves faster
build-out across all sources of supply
Opportunities/challenges (compared to
minimum growth scenario):
• Further impacts on townscape/landscape
• Further pressure on green infrastructure
As with all maximum growth scenarios:
• Water supply potential ‘deal breaker’
• Housing delivery rate not currently
deliverable
• Infrastructure requires big-ticket items3. Edge of Cambridge (in Green Belt) – minimum
Opportunities
• Green infrastructure – could meet deficits in
adjacent urban areas + enhance remaining
Green Belt
• Transport – highest active travel mode share
• Equality – accessibility and services
• Housing & employment – accessible
employment, can accommodate range of
sectors and housing types
Challenges
• Housing delivery – unlikely to meet small
sites target
• Transport – cost of delivering infrastructure
• Landscape – alters setting of the city
Minimum housing growth does not reflect
recent and potential future jobs growth3. Edge of Cambridge (in Green Belt) – medium
• Medium growth scenario assumes historic
delivery rates
• Therefore more additional sources of
supply are required to meet the medium
growth target
• For the purposes of testing, balance has
been assumed to be provided within the
City
Opportunities/challenges (compared to
minimum growth scenario):
• Potential habitat / GI impacts
• Greater impacts on townscape and
landscape
• Potential housing delivery issues3. Edge of Cambridge (in Green Belt) – maximum
• Maximum growth scenario involves faster
build-out across all sources of supply
Opportunities/challenges (compared to
minimum growth scenario):
• Further impacts on townscape/landscape
As with all maximum growth scenarios:
• Water supply potential ‘deal breaker’
• Housing delivery rate not currently
deliverable
• Infrastructure requires big-ticket items4. New settlements – minimum
Opportunities
• Water – best option as sites can be selected
with water in mind
• Green infrastructure – landscape led
masterplanning
• Equality – accessibility and services
• Great places – distinctive sense of place
• Housing and employment – can include
range of sectors and housing types
• Infrastructure – critical mass to fund
Challenges
• Housing – competition with existing sites
• Transport – need to enhance
Minimum housing growth does not reflect
recent and potential future jobs growth4. New settlements – medium
• Medium growth scenario assumes historic
delivery rates
• More/larger new settlements required plus
one on the road network
Opportunities/challenges (compared to
minimum growth scenario):
• Greater impacts on landscape
• Unable to demonstrate 5 year housing land
supply at adoption without additional short
term allocations or stepped housing
requirement4. New settlements – maximum
• Maximum growth scenario requires faster
than normal build-out across all sources of
supply
Opportunities/challenges (compared to
minimum growth scenario):
• Further impacts on townscape/landscape
• Unable to demonstrate 5 year housing land
supply at adoption
As with all maximum growth scenarios:
• Water supply potential ‘deal breaker’
• Housing delivery rate not currently
deliverable
• Infrastructure requires big-ticket items5. Villages – minimum
For the purposes of testing, growth distributed
across all villages regardless of location
Opportunities
• Housing delivery – due to small sites
• Employment – due to availability of land
Challenges
• Carbon – worst performing option
• Water – high existing flood risk in some
villages + few infrastructure opportunities
• Infrastructure/green infrastructure –
piecemeal and more costly
• Equalities – cost of travel to jobs/services
• Housing - less affordable housing
• Transport – highest mode share
Minimum housing growth does not reflect
recent and potential future jobs growth5. Villages – medium
• Medium growth scenario assumes historic
delivery rates
Opportunities/challenges (compared to
minimum growth scenario):
• Greater impacts on townscape/landscape
• Better options for infrastructure/green
infrastructure
• Potential for more habitat impacts5. Villages – maximum
• Maximum growth scenario involves faster
build-out across all sources of supply
Opportunities/challenges (compared to
minimum growth scenario):
• Further impacts on townscape/landscape
• Better for infrastructure/green infrastructure
As with all maximum growth scenarios:
• Water supply potential ‘deal breaker’
• Housing delivery rate not currently
deliverable
• Infrastructure requires big-ticket items6. Public transport corridors – minimum
For the purposes of testing, growth distributed
across all villages on public transport routes
Opportunities
• Carbon – second best option
• Green infrastructure
• Equalities – accessibility
• Jobs and homes – good accessibility and
potential for a range of homes
Challenges
• Equalities – not all areas have affordable
transport options
• Employment – due to market preferences
• Infrastructure/green infrastructure –
piecemeal and more costly
Minimum housing growth does not reflect
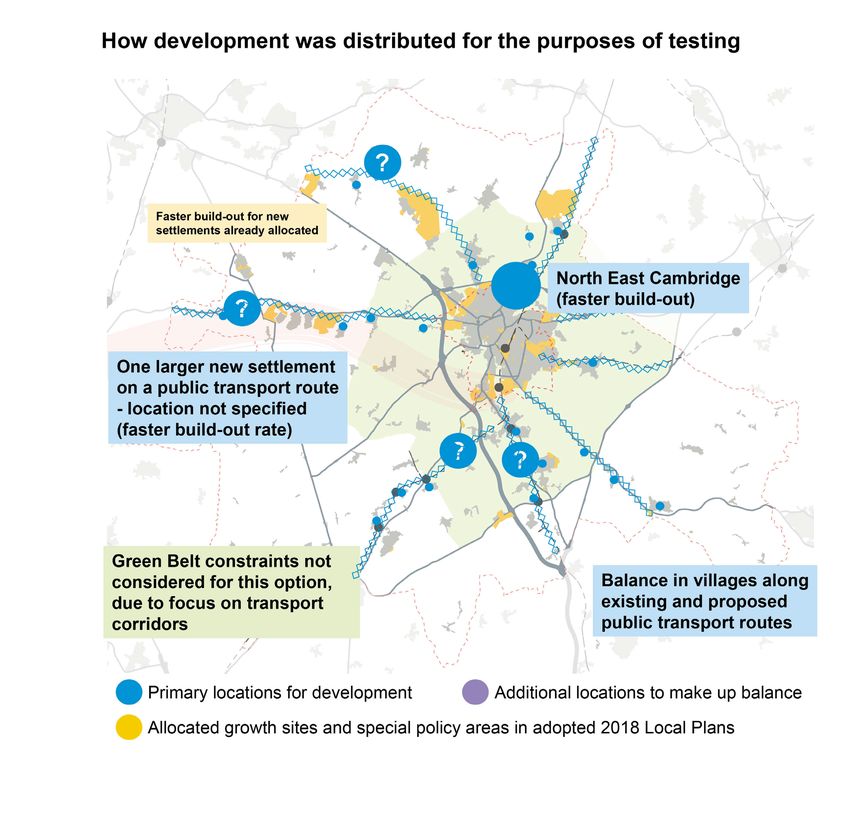
recent and potential future jobs growth6. Public transport corridors – medium
• Medium growth scenario assumes historic
delivery rates
Opportunities/challenges (compared to
minimum growth scenario):
• Greater impacts on landscape
• Better options for infrastructure/green
infrastructure
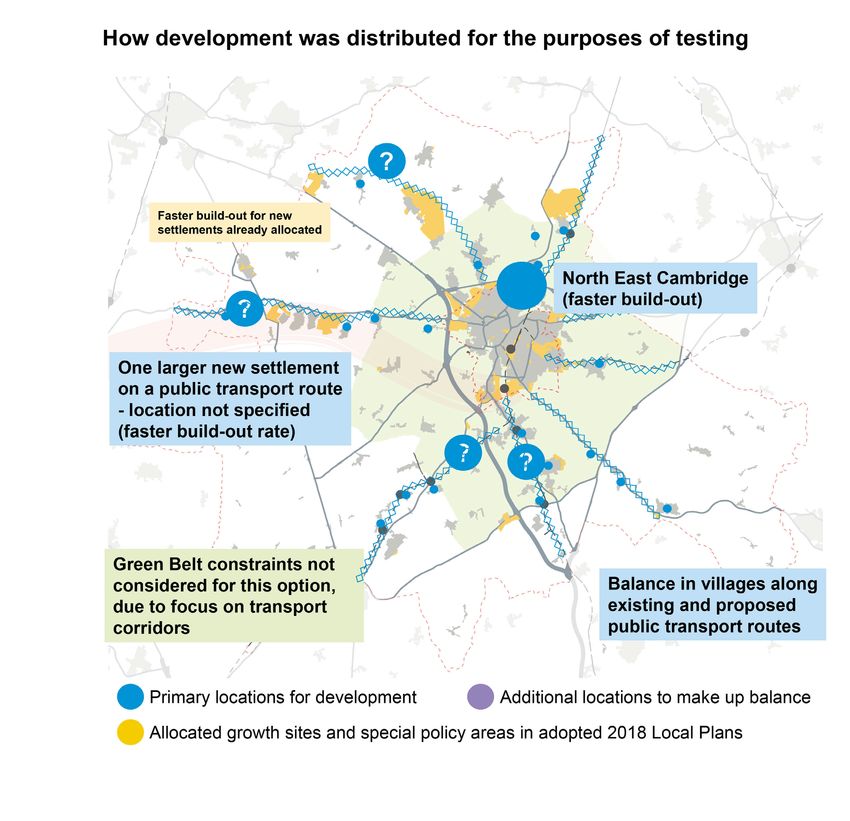
• Potential for more habitat impacts6. Public transport corridors – maximum
• Maximum growth scenario involves faster
build-out across all sources of supply
Opportunities/challenges (compared to
minimum growth scenario):
• Further impacts on townscape/landscape
As with all maximum growth scenarios:
• Water supply potential ‘deal breaker’
• Housing delivery rate not currently
deliverable
• Infrastructure requires big-ticket items7. Southern cluster – minimum
Opportunities
• Landscape – reducing impacts on landscape
across area
• Equalities – accessibility and integration with
employment
• Jobs and homes – good accessibility and
potential for a range of homes
Challenges
• Carbon – second worst overall
• Landscape/habitats – impacts the local
area significantly
• Employment – relies on performance of
specific sectors
Minimum housing growth does not reflect
recent and potential future jobs growth7. Southern cluster – medium
• Medium growth scenario assumes historic
delivery rates
• More sources of supply required hence
siting development in villages without
public transport links
Opportunities/challenges (compared to
minimum growth scenario):
• Greater impacts on local
landscape/habitats
• Better options for green infrastructure
• Greater infrastructure cost due to dispersal
to villages7. Southern cluster – maximum
• Maximum growth scenario involves faster
build-out across all sources of supply
Opportunities/challenges (compared to
minimum growth scenario):
• Further impacts on townscape/landscape
• Better for infrastructure/green infrastructure
As with all maximum growth scenarios:
• Water supply potential ‘deal breaker’
• Housing delivery rate not currently
deliverable
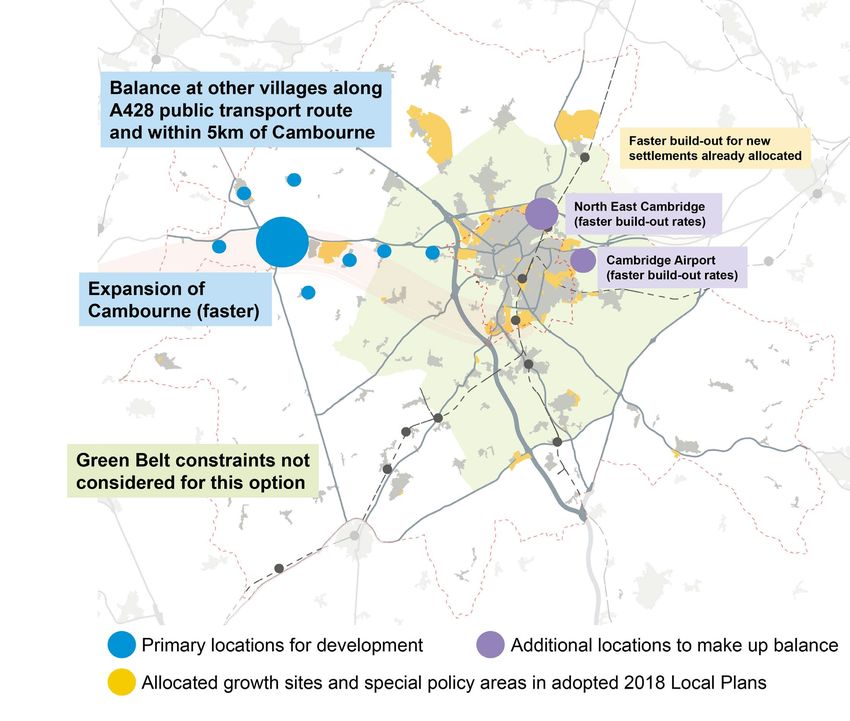
• Infrastructure requires big-ticket items8. Western cluster – minimum
For minimum growth level, only sites along the
transport route are needed
Opportunities
• Green infrastructure
• Landscape – less sensitive landscapes
• Jobs and homes – good accessibility and
potential for a range of homes
Challenges
• Carbon – third worst overall
• Water – capacity constraints for WRCs
• Infrastructure– dependent on delivery of
East-West Rail
• Employment – contrary to market
preferences for offices
Minimum housing growth does not reflect
recent and potential future jobs growth8. Western cluster – medium
• Medium growth scenario assumes historic
delivery rates
• More sources of supply required hence
siting development in villages not on
primary public transport route
Opportunities/challenges (compared to
minimum growth scenario):
• Greater impacts on local
landscape/habitats
• Risk of market saturation/absorption rates8. Western cluster – maximum
• Maximum growth scenario involves faster
build-out across all sources of supply
Opportunities/challenges (compared to
minimum growth scenario):
• Further impacts on townscape/landscape
• Market saturation/absorption
As with all maximum growth scenarios:
• Water supply potential ‘deal breaker’
• Housing delivery rate not currently
deliverable
• Infrastructure requires big-ticket itemsWhat next?
Publishing this evidence

• Development Strategy Options Summary Report – including a plain English
  executive summary - brings together all the key initial evidence findings
• Baseline evidence on transport and green infrastructure
• Jobs and Homes evidence - resulting in 3 growth level options
• Strategic spatial options - Methodology paper outlining how we developed options
  for testing - 8 possible broad locations to focus development (not site specific)
• Topic based assessments of the strategic spatial options – as shown on
  preceding slide
• Sustainability Appraisal of the strategic spatial options
Other evidence to come

Only the initial findings of studies being reported at this stage
• Studies will be updated to test the preferred option stage

Other workstreams underway include:

•   Housing and Employment Land Availability Assessment
•   Housing Mix & Needs of specific groups
•   Retail & Leisure
•   Open Space & Sports
•   Community Facilities (village halls etc)
•   Visitor Accommodation
•   Broadband Infrastructure & SMART
•   Strategic Historic Impact Assessment
•   Green Belt Study
•   Creative economy & workspaces
•   Health and inclusivity topic papers
Process of Local Plan preparation
     First Call for Sites, initial
    stakeholder engagement,          Publish consultation and Calls for
         preparatory work                     Sites responses
      Spring 2019 onwards                    September 2020

 First Conversation consultation     Publish initial evidence findings,
   (Issues & Options + Call for      further stakeholder engagement
        Sites/Green Sites)                 Autumn-Winter 2020
          Jan-Feb 2020

                                        Preferred Options public
                                              consultation
                                         Summer/Autumn 2021                 Proposed Submission Plan
                                                                                public consultation
                                                                          Spring 2023/Autumn-Winter 2023
                                     Publish further evidence findings,
                                     further stakeholder engagement
                                                                           Submission to Secretary of State
                                                                             Autumn 2023/Spring 2024
                                         Draft Local Plan public
                                              consultation
                                             Summer 2022                      Examination and adoption
Find out more www.greatercambridgeplanning.org/localplan Visit ‘Document Library’ for all the documents referred to localplan@greatercambridgeplanning.org
Thank you!
You can also read