Investor Presentation - FY20 & 1Q21 Mike Lobinsky, CEO Valérie Worrall, CFO - EOS imaging

Page created by Tammy Jimenez
 
CONTINUE READING
Investor Presentation - FY20 & 1Q21 Mike Lobinsky, CEO Valérie Worrall, CFO - EOS imaging
Investor Presentation
Mike Lobinsky, CEO
Valérie Worrall, CFO

FY20 & 1Q21
Investor Presentation - FY20 & 1Q21 Mike Lobinsky, CEO Valérie Worrall, CFO - EOS imaging
Disclaimer
This document has been prepared by EOS imaging (the "Company") and is provided for information purposes only.
The information and opinions contained in this document speak only as of the date of this document and may be updated, supplemented, revised, verified or amended, and such
information may be subject to significant changes. EOS imaging is not under any obligation to update the information contained herein and any opinion expressed in this
document is subject to change without prior notice.
The information contained in this document has not been independently verified. No representation, warranty or undertaking, express or implied, is made as to the accuracy,
completeness or appropriateness of the information and opinions contained in this document. The Company, its subsidiary, its advisors and representatives accept no
responsibility for and shall not be held liable for any loss or damage that may arise from the use of this document or the information or opinions contained herein.
This document contains information on the Company’s markets and competitive position, and more specifically, on the size of its markets. This information has been drawn from
various sources or from the Company’s own estimates. Investors should not base their investment decision on this information.
This document contains certain forward-looking statements. These statements are not guarantees of the Company's future performance. These forward looking statements relate
to the Company's future prospects, developments and marketing strategy and are based on analyses of earnings forecasts and estimates of amounts not yet determinable.
Forward-looking statements are subject to a variety of risks and uncertainties as they relate to future events and are dependent on circumstances that may or may not materialize
in the future. EOS imaging draws your attention to the fact that as forward-looking statements cannot under any circumstance be construed as a guarantee of the Company's
future performance and that the Company’s actual financial position, results and cash flow, as well as the trends in the sector in which the Company operate may differ materially
from those proposed or reflected in the forward-looking statements contained in this document. Furthermore, even if EOS imaging’ financial position, results, cashflows and
developments in the sector in which the Company operates were to conform to the forward-looking statements contained in this document, such results or developments cannot
be construed as a reliable indication of the Company's future results or developments. The Company does not undertake any obligation to update or to confirm projections or
estimates made by analysts or to make public any correction to any prospective information in order to reflect an event or circumstance that may occur after the date of this
presentation. A description of those events that may have a material adverse effect on the business, financial position or results of EOS imaging, or on its ability to meet its
targets, appears in the "Risk Factors" section of EOS imaging Financial Annual Report available on the Company’s website.
Certain figures and numbers appearing in this document have been rounded. Consequently, the total amounts and percentages appearing in the tables are therefore not
necessarily equal to the sum of the individually rounded figures, amounts or percentages.
This document does not constitute or form part of an offer to sell or to purchase securities or the solicitation of an offer to purchase securities in the United States of America or in
any other jurisdiction. The securities mentioned in this presentation have not been and will not be registered under the U.S. Securities Act of 1933, as amended (the “Securities
Act”) or under any other legislation of any jurisdiction in the United States of America and may not be offered or sold in the United States absent registration or an applicable
exemption from registration under the Securities Act.

                                                                                                                                                                              April 2021 2
Investor Presentation - FY20 & 1Q21 Mike Lobinsky, CEO Valérie Worrall, CFO - EOS imaging
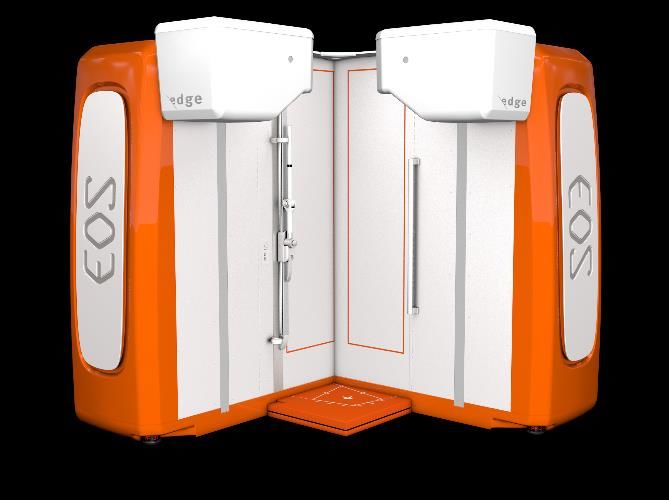
EOS imaging: a leader in orthopedic medical imaging and software solutions

   Unique, innovative, low dose 2D/3D full body imaging and software solutions bridging the gap between
   imaging and orthopedic surgery

   EOSedge: a disruptive imaging system with regulatory approvals in the U.S., Europe, Canada and Australia

   EOS system, the first-generation system recognized worldwide with clearance to market in 51 countries incl.
   U.S. (FDA), Japan, China, and the European Union (CE), with over 400 units installed worldwide

   A product portfolio targeting a ~€2 billion per year addressable market

   Strategic partnerships in selected countries and direct commercial presence with offices in France (HQ),
   U.S., Canada, Germany, and Singapore

   > 160 employees, including an R&D team of 45 engineers

                                                                                                    April 2021 3
Investor Presentation - FY20 & 1Q21 Mike Lobinsky, CEO Valérie Worrall, CFO - EOS imaging
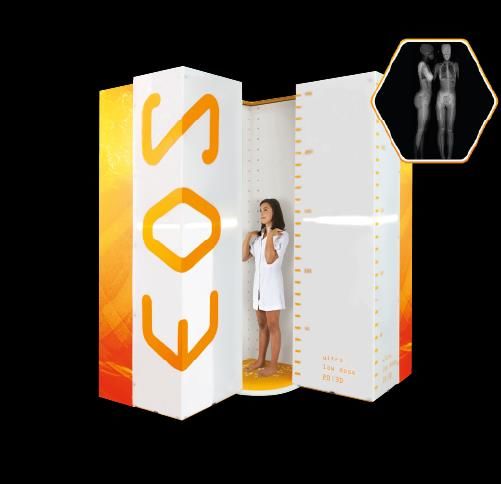
Experienced Complimentary Management Team
Combined 120+ Years Medical Technology Experience

                  Mike Lobinsky – Chief Executive Officer                       Carl Denys – VP Global Marketing

                  •    Over 20 years experience in Medical Device               •       Over 25 years of global medical industry experience in
                  •    Held senior management positions at Smith and                    upstream/downstream marketing, business development, and
                       Nephew, Brainlab, Blue Belt Technologies, Stryker Corp           sales operations.
                  •    Joined the company in 2017                               •       Held senior management positions at IMRIS, St. Jude Medical, and
                  •    Appointed CEO Jan 2019                                           Boston Scientific
                                                                                •       Joined EOS imaging in 2020

                  Eric Maulave - Chief Operating Officer                            Pascal Désauté – Chief Technology Officer
                  •    Over 25 years of experience and began his career as          •    Over 18 years of experience in R&D and engineering in the
                       business engineer for the IT and Multimedia sectors               healthcare market
                       within the Philips Group.                                    •    5 years of experience in R&D in mutli-energy X-ray cargo imaging
                  •    Held various international positions as Sales and            •    Contributed to the development of the gaseous detector of EOS,
                       Marketing Director within the Philips Group.                      and to the overall device EOS
                  •    Joined EOS imaging in 2012                                   •    Joined EOS imaging in 1997

              Valerie Worrall - Chief Financial Officer
              •       Over 20 years’ experience in Finance in the
                      Healthcare industry
              •       She had a long tenure with Novartis and GSK and was
                      also CFO of Balt, a French Medical device company
              •       Joined EOS imaging in November 2018

                                                                                                                                           April 2021 4
Investor Presentation - FY20 & 1Q21 Mike Lobinsky, CEO Valérie Worrall, CFO - EOS imaging
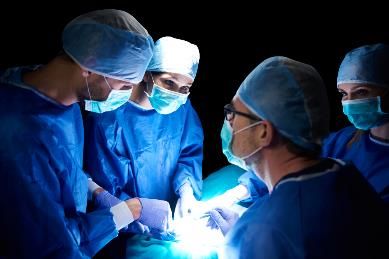
Differentiated orthopedic imaging platform
Addressing Weaknesses of Conventional Imaging

                                                           Current orthopedic imaging modalities
                                                Bone Imaging                        Soft tissue imaging

                                                                                                               EOS              X-Ray
                              EOS OFFERING      X-RAY: CR/DR   CT SCANNER     MRI           ULTRASOUND

              Low dose

           3D imaging                                                *           *

             Full-body
         (no stitching)
    Weight-bearing
                                                                                                             Continuous,          Imprecise,
                                                                                                          full-body imaging   stitched imaging

*Only   available in non-functional positions

                                                                                                                                 April 2021 5
Investor Presentation - FY20 & 1Q21 Mike Lobinsky, CEO Valérie Worrall, CFO - EOS imaging
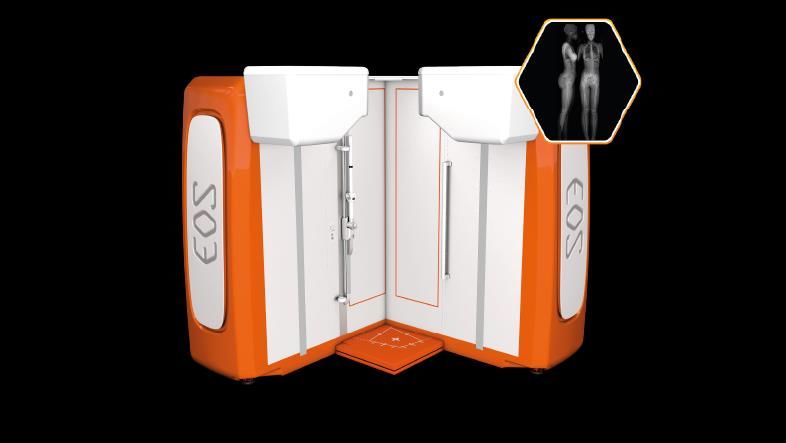
EOS Orthopedic Solutions
Expansion Beyond Radiology System & Creation of 2 Focused Divisions

          Imaging Solutions                               Advanced Orthopedic Solutions

                                                       3D Modeling     3D Surgical planning         Surgery

                                                        On-site &           EOSapps                EOSlinkTM
                                                       3DServices          3D surgical           Integration of
                                                     3D modeling of         planning           EOSapps surgical
                                                     musculoskeletal        & patient         planning into the OR
                                                         system           engagement

                                                                                                      April 2021 6
Investor Presentation - FY20 & 1Q21 Mike Lobinsky, CEO Valérie Worrall, CFO - EOS imaging
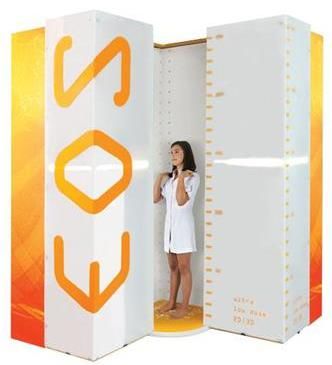
Clinical innovation through cutting-edge technology

                     2008                                              2019

      Stereo-radiographic full body                           First general X-ray system
       weight-bearing acquisition                          with photon-counting detectors
             Low dose imaging                                  Unique image resolution
                                                          to support diagnostic capabilities
       3D modeling with accurate
            measurements                            Optimized dose modulation with Flex Dose™
                                                     Open design and short exam time (
Investor Presentation - FY20 & 1Q21 Mike Lobinsky, CEO Valérie Worrall, CFO - EOS imaging
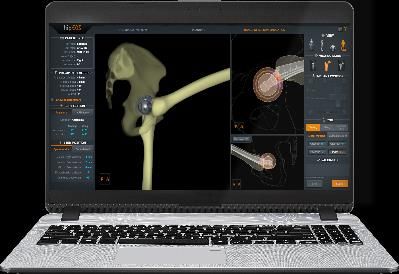
Installed base as of December 31st, 2020
  Over 400 Systems Installed Worldwide, of which over 150 in NAM

                                                                    France: > 90 EOS installed
                                                                     70% in Private settings
                                                                   Germany: > 15 EOS installed
U.S: > 130 EOS installed                              EMEA           50% in Private settings
                           NAM
                           39%                       44%

                                                                                                 Asia-Pac.
                                                                                                 16%

                                 Lat. Am
                                                                                                             Australia: > 20 EOS
                                  1%                                                                          installed 80% in
                                                                                                               Private setiings

                                                                                           (1)

                                                                                                                     April 2021 8
Investor Presentation - FY20 & 1Q21 Mike Lobinsky, CEO Valérie Worrall, CFO - EOS imaging
Global top hospital penetration
EOS in 7 of the top 10 best hospitals in the world*

                                                        1     Mayo Clinic

                                                        2     Cleveland Clinic

                                                        3
        70%
                                                              Singapore General Hospital (Bukit Merah)

                                                        4     The Johns Hopkins Hospital (Baltimore)

                                                        5     Charité (Berlin)

                                                        6     Massachusetts General Hospital (Boston)

                                                        7     Toronto General Hospital

                     TOP # 10                           8     University of Tokyo Hospital
                     WORLD BEST                         9     Lausanne (Switzerland) University Hospital
                     HOSPITAL
                                                       10     Sheba Medical Center (Tel Aviv, Israel)

                                                      *https://www.newsweek.com/2019/04/05/10-best-hospitals-world-1368512.html

                                                                                                                       April 2021 9
Investor Presentation - FY20 & 1Q21 Mike Lobinsky, CEO Valérie Worrall, CFO - EOS imaging
EOS solutions in the best hospitals
US News and Word Report 2020-21

   100%                      90%               80%               90%
      of the top 10           of the top 10      of the top 10     of the top 10
      Best Pediatric          Best Pediatric    Best Hospitals    Best Hospitals
        Hospitals             Hospitals for    for Orthopedics   for Neurosurgery
      “Honor Roll”            Orthopedics

                                                                               April 2021 10
Financials –
2020 Annual Results

                      11
2020 Financial Highlights

    €23.8m                 €12.9m
      2020                   2020
                                                  €24.4m
                                                                       €11.2m        €9.7m
    revenues               recurring                 OpEx                              Cash
                                                                        Net Loss
     (+19%)                revenues                                                   Position

                        +11% vs. 2019            -13% vs. 2019
                                                                                     Increased vs.
                         thanks to the       as a result of a sharp
Double digit growth                                                   Decreased by     €8.2m at
                      continued growth in    decrease in Sales &
 from all Regions                                                     39% vs. 2019     December
                      maintenance activity   Marketing expenses
                                                                                        31,2019
                            (+15%)                   (-34%)

                                                                                             April 2021 12
2020 Equipment Orders

› €18.3 million of equipment orders in 2020 (40 orders booked including 20 EOS edge) vs. 56 orders in 2019

› €8.1 million of equipment orders in Q4 2020 (18 orders booked) vs. 12 orders in Q4 2019.

› EOSedge represented 85% of the orders in the countries where it is commercialized

    EOS imaging 2020 Equipment Orders by Region                                     EOS imaging quarterly Equipment Orders
    EUR million                                                                     EUR million

                                                                      24,0                                                                                    24,0

                                                                             18,3                                                                                    18,3

         9,2                9,8
                                                                                                                                                        8,1
                                        6,0                     6,6                      6,3              6,6
                      5,7                          5,1                                                                     5,8        5,3    5,4
                                                                                                    3,0
                                                                                                                     1,9

               EMEA               NAM                    APAC           GLOBAL                 Q1               Q2               Q3                Q4            Total
                                          2019   2020                                                                      2019       2020

                                                                                                                                                                     April 2021 13
Change in the commercial cycle in 2019                                                                                  2020 Financial Results

  Shift by 3 to 15 months of the equipment delivery to the customer
  The order taking and installation activities remained unchanged
  The cash stream remained unchanged : deposit at order and final payment at acceptance
  Decreased working capital thanks to reduced time from equipment production to installation
  One-time transition impact on equipment revenue, as equipment billing (at delivery) are delayed until customer site readiness

Up to December 2018
        Sales               Equipment                      Site Preparation by the Customer                             Installation
      Agreement              Delivery                                   [3 to 15 months]                               & Acceptance

Since January 2019
       Sales                         Site Preparation by the Customer                            Equipement            Installation
     Agreement                                     [3 to 15 months]                                Delivery           & Acceptance

Cash cycle unchanged
   Downpayment                                                                                                        Final Payment

                                                                                                                                  April 2021 14
Order Book as of December 31, 2020

>        18 equipment orders in Q4 2020, for a total of €8.1 million, 40 orders in 2020 for a total of €18.3m
>        €15.2m gross equipment revenues from the billing of 34 equipment of which 15 in Q4 2020
>        Order book up by €1.3 million during Q4 to reach €17.4 million at December 31, 2020, as new orders exceed deliveries

        EOS imaging Order Book Variation - EUR million

            Quarterly Equipment new Orders      Quarterly Revenues recorded from Equipment delivered          Equipment Order Book Value as of end of the quarter
                                                                                                                                                                                                            #18 EOS
25

21                                                                                               #12 EOS*                                                 #4 EOS                   #12 EOS                            6,6
                                                                                                                                                                                                              8,1             #38 EOS
                                                                      #14 EOS
                                                                                                                                                #36 EOS    1,9                                      #35 EOS
17                                                                                                  5,4     5,3                          0,7                                                 2,9
                                                                                  3,5    #33 EOS                    #32 EOS    3,0                                 5,0               5,3
                                                                                                                                                                                                                    #15 EOS
                                           #15 EOS                      5,8                                                                                              #30 EOS
                                                                                                                                       #2 EOS                                              #7 EOS
13                                                            #28 EOS
                                                       0,7                                                #13 EOS             #6 EOS
                                                                                #9 EOS                                                                           #10 EOS

    9                                         6,6    #2 EOS
                                                                                                                                                 16,7                                                16,0                      17,4
                  #15 EOS         #15 EOS                                                 14,4                       14,4
                            0,1                                                                                                                                            13,6
                                                               12,1
    5
         #0 EOS
                   6,3               6,2
    1

-3

                                                                                                                                                                                                                    April 2021 15
             * As a reminder, orders in Q4 2019, expected to exceed 18 units (Q4 2018 performance), have been postponed by customers with the arrival of the new EOSedge offer on 1 December 2019.
2020 Detailed Revenue Breakdown

 Revenues by product lines                                          Change
 Unaudited/Including forex impact / € m /   2020   2019   Change   constant
 As of Dec. 31 2020                                                  rate
 Equipment                                  10.9   8.5    +29%      +29%

 Maintenance contracts                      12.0   10.5   +15%      +16%

 Consumables and associated services        0.9    1.2     -26%     -26%

 TOTAL REVENUES                             23.8   20.1   +19%      +19%

 Revenues by region                                                 Change
                                                                              Geographic
 Unaudited/Including forex impact / € m /   2020   2019   Change   constant
                                                                                 split
 As of Dec. 31 2020                                                  rate
 EMEA                                       11.0    9.9    +11%      +11%        46%

 APAC                                        5.3    3.8    +39%      +39%        22%

 NAM                                         7.4    6.3    +17%      +20%        31%
 LATAM                                       0.6    0.0    +77%      +77%        0%
 TOTAL REVENUES                             23.8   20.1    +19%      +19%       100%

                                                                                           April 2021 16
2020 Income statement
        Lower operating expenses and reduction in operating loss 2020

Income Statement / € million
Unaudited
                                                         2020           2019
As of December 31

Sales                                                    23.8           20.1     Total revenues of €23.8 million generated
                                                                                 in 2020 (+19%) vs. 2019, which had been
Other income                                              2.2            2.1     impacted by the business model
                                                                                 transition
TOTAL REVENUES                                           26.0           22.2

Direct cost of sales                                     (11.2)         (11.0)

GROSS MARGIN                                             12.6            9.1
                                    as a % of revenue    52.9%          45.4%
                                                                                 Improvement in Gross margin from 49.8%
          excluding exceptional items as % of revenues   54.3%          49.8%    to 54.4%

Total operating expenses                                 (24.4)         (27.9)   An OPEX decrease by 13% vs. 2019

Operating income/(loss)                                  (9.6)          (16.7)   Significant reduction in net loss by 39%
Net financial income/(expense)                           (1.6)          (1.7)

Net income/(loss)                                        (11.2)         (18.4)

                                                                                                                      April 2021 17
2020 Operating Expenses
Operating expenses totaled €24.4 million in 2020, down 13% compared to 2019

 Operating Expenses / € million
 Unaudited                                         2020                2019
 As of December 31

 Indirect cost of production and services           4.6                4.4

 Research & Development                             5.6                4.8

 Sales, Marketing and Clinical                                                Sales & Marketing expenses (-34%),
                                                    7.4                11.2
                                                                              following in particular the cancellation of
                                                                              trade shows and the reduction in travel
 Regulatory expenses                                0.8                0.9    expenses due to the pandemic and its
                                                                              restrictions
 Administrative costs                               6.0                5.9

 Share-based payments                               0.0                0.7

 TOTAL OPERATING EXPENSES                           24.4               27.9

                                                                                                                April 2021 18
Change of Commercial Cycle continues to fuel Working Capital Reduction

 Balance Sheet main elements change from December 2018 to December 2020                                    Net Working Capital Variation from December 2019 to December 2020
 EUR million                                                                                               EUR million

                         Dec. 2018      Dec., 2019       Dec., 2020

                                                                                34,4
    32,7
                                                                                                                     27,2
                                                                                       27,2

                                                                                              19,8
           17,7                                                                                                                                                 0,5           19,8
                                     13,5   13,4
                   9,8      8,8
                                                                                                                                     ( 7,9)        ( 0,1)

                                                              ( 4,0) ( 3,4)
                                                     (7,1)

       Receivables             Inventories                   Payables          Net Working Capital
                                                                                     (NWC)

                                                                                                                      NWC         Receivables   Inventories   Payables         NWC
                                                                                                                as of Dec. 2019                                          as of Dec. 2020

    Continued               Stable inventories                                Significant improvement in
    reduction of                                                              working capital
    Receivables

                                                                                                                                                                                April 2021 19
H1 2019 Financial Results
    2020 Balance Sheet
    Balance Sheet / € million
    Unaudited                               2020   2019

      Goodwill                              5.1    5.1
      Intangible Assets                     8.5    8.5
      Lease Right-of-Use                    3.7    4.4
      Tangible Assets                        1.5   2.1
    Total non-current Assets                19.0   20.3
      Inventories                           13.4   13.5
      Total Receivables                     9.8    17.7   Strong reduction of Receivables, as expected,
                                                          thanks to the new commercial cycle
      Other Current Assets                  3.2    5.2
      Cash                                  9.7    8.2
    Total Current Assets                    36.1   44.6
    Total Assets                            55.1   64.9
    Total Equity                            0.4    12.1
    Total non-current Liabilities           28.4   29.7
      Trade payables                        3.4    4.0
      Other liabilities and adj. Accounts   19.8   15.6
    Total current Liabilities               26.3   23.1
    Total Liabilities                       55.1   64.9

                                                                                           April 2021 20
2020 Financial Results
2020 Cash Flow Statement
Cash position of €9.7m at December 31, 2020 compared with €8.2 million at December 31, 2019
Positive Cash flow from operating activities: +€4.7m

                    Cash Flow Statement / € million
                    Unaudited                                   2020                   2019

                    Net Income                                 (11.2)                  (18.4)
                    Restatement of non-cash items               2.8                     2.9
                    Restatement of financial items              (0.2)                  (0.0)
                    Working Capital variation                   13.3                    8.0

                    Cash Flow from operating activities         4.7                    (7.6)

                    Cash Flow from investing activities         (2.2)                  (2.7)

                    Cash Flow from financing activities        (0.8)                   (1.3)

                    Net Cash Flows                               1.7                   (11.6)
                    Cash Position at end of the period           9.7                    8.2

                                                                                                          April 2021 21
Q1 2021 sales

                22
Q1 2021 Equipment Orders                                                                                      Q1 2021 sales

› €4.7 million of equipment orders, (11 systems ordered) vs. €3.0 million in Q1 2020 (6 systems ordered)

                               EOS imaging Q1 Equipment Orders by Region
                               EUR million

                                                                                                    +55%

                                                                                                         4,7

                                                                                              3,0

                                                                                        2,2

                                                                1,4         1,3
                                             1,1   1,2
                                0,6

                                      EMEA               APAC                     NAM           GLOBAL
                                                                Q1 2020   Q1 2021

                                                                                                                 April 2021 23
Q1 2021 sales
EOS imaging | Q1 2021 Detailed Revenues Breakdown
› €5.59m of revenues generated over Q1 2021, a sharp increase (+48%) vs. Q1 2020
     • Of which €2.34m of equipment sales and €3.26m of recurring revenues

› Commercial performance* at €7.9m, up 31% compared to Q1 2020

               Revenues by product lines                                                            Q1     Q1
               Non-audited / Including forex impact / € million / As of March 31                   2021   2020
               Equipment                                                                           2.3    0.7

               Maintenance contracts                                                               3.1    2.7
               Consumables and services                                                            0.2    0.3

               TOTAL REVENUES                                                                      5.6    3.8

               Revenues by geographies                                                              Q1     Q1
               Non-audited / Including forex impact / € million / As of March 31                   2021   2020

               EMEA                                                                                2.4    1.7

               APAC                                                                                0.3    0.6
               NAM                                                                                 2.9    1.4
               TOTAL REVENUES                                                                      5.6    3.8

 *Commercial performance: sum of recurring revenues and equipment orders generated over a period
                                                                                                                   April 2021 24
Q1 2021 sales
          Order Book as of March 31, 2021
          > 11 equipment orders in Q1 2021, for a total of €4.7 million
          > €2.3m gross equipment revenues from the billing of 4 equipment
          > Order book up by €2.3 million during Q1 to reach €19.7 million at March 31, 2021, as new orders exceed deliveries

     EOS imaging Order Book Variation - EUR million

         Quarterly Equipment new Orders        Quarterly Revenues recorded from Equipment delivered              Equipment Order Book Value as of end of the quarter

25
                                                                                                                                                                                           #18 EOS

                                                                                                                                                                                                                    #11 EOS
                                                                                        #12 EOS*                                          #4 EOS                                                                                    #45 EOS
21                                                                                                                                                               #12 EOS                             6,6                      2,3
                                                                                                                                                                                             8,1                      4,7
                                                              #14 EOS                                                                                                                                      #38 EOS
                                                                                                                                 #36 EOS 1,9                                2,9 #35 EOS
17                                                                                        5,4      5,3                     0,7
                                                                         3,5 #33 EOS                     #32 EOS 3,0                               5,0 #30 EOS 5,3                                                          #4 EOS
                                                                5,8                                                  #2 EOS                                                #7 EOS                  #15 EOS
                                    #15 EOS
13                                                   #28 EOS
                                               0,7                                              #13 EOS          #6 EOS                        #10 EOS
                                                                        #9 EOS
                                       6,6    #2 EOS                                                                                                                                                                                 19,7
9                                                                                                                                                                                                            17,4
            #15 EOS 0,1 #15 EOS                                                                                                    16,7                                             16,0
                                                                                 14,4                     14,4                                            13,6
                                                       12,1
 5
      #0 EOS
               6,3            6,2
 1

-3

                                                                                                                                                                                                                        April 2021 25
          * As a reminder, orders in Q4 2019, expected to exceed 18 units (Q4 2018 performance), have been postponed by customers with the arrival of the new EOSedge offer on 1 December 2019.
Contact
Phone: +33 (0)1 55 25 60 60
Email: investors@eos-imaging.com
www.eos-imaging.com
You can also read