Third Quarter 2020 Business Update - Nov. 4, 2020
←
→
Page content transcription
If your browser does not render page correctly, please read the page content below
Third Quarter 2020 Business Update
Nov. 4, 2020

Forward-Looking Statements
Certain statements in this presentation, including without limitation statements about demand; pricing; yield; the company’s enterprise
wide optimization efforts, including expected benefits and ability to increase SOP feedstock and lengthen evaporation season; the
company’s growth trajectory and continued growth; the company’s 2020 strategic priorities, including its ability to build a sustainable
culture, deliver on commitments and its strategic assessment; ability to meet demand and serve customers; the company’s outlook for the
fourth quarter of 2020 and full-year 2020, including revenue, EBITDA, sales volumes, corporate and other expense, interest expense,
depreciation, depletion and amortization, capital expenditures and tax rate; foreign currency rates; liquidity; free cash flow; capital
expenditures; spending; leverage ratio; and ability to achieve success at Goderich Mine, including increasing efficiency of mining
systems, decreasing maintenance needs, providing greater optionality and key features; are forward-looking statements within the
meaning of the Private Securities Litigation Reform Act of 1995. Forward-looking statements are those that predict or describe future
events or trends and that do not relate solely to historical matters. We use words such as “may,” “would,” “could,” “should,” “will,” “likely,”
“expect,” “anticipate,” “believe,” “intend,” “plan,” “forecast,” “outlook,” “project, ” “estimate” and similar expressions suggesting future
outcomes or events to identify forward-looking statements or forward-looking information. These statements are based on the company's
current expectations and involve risks and uncertainties that could cause the company's actual results to differ materially. The differences
could be caused by a number of factors, including without limitation (i) impacts of the COVID-19 pandemic, (ii) weather conditions, (iii)
pressure on prices and impact from competitive products, (iv) foreign exchange rates and the cost and availability of transportation for the
distribution of the company’s products, (v) any inability by the company to successfully implement its strategic priorities or its cost saving
or enterprise optimization initiatives, and (vi) the outcome of the company’s strategic evaluation of the Plant Nutrition South America
business. For further information on these and other risks and uncertainties that may affect the company’s business, see the “Risk
Factors” and “Management’s Discussion and Analysis of Financial Condition and Results of Operations” sections of the company’s
Annual Report on Form 10-K for the year ended December 31, 2019 and its Quarterly Report on Form 10-Q for the quarters ended March
31, June 30 and September 30, 2020, filed or to be filed with the SEC. The company undertakes no obligation to update any forward
looking statements made in this presentation to reflect future events or developments. Because it is not possible to predict or identify all
such factors, this list cannot be considered a complete set of all potential risks or uncertainties.
3Q20 Highlights

               YTD                                                                                                                          • Year-to-date performance

                                                                       19%
                                                                                                                                              remains strong despite short-
             Operating                                                                             vs.
                                                                                                                                              term challenges in 3Q20
                                                                                                  2019*
             Earnings                                                                                                                           - Multiple hurricanes striking
                                                                                                                                                  Louisiana mine
                                                                                                                                                - Dry weather and extreme fires
                       YTD                                                                                                                        in key agriculture markets

                                                                         10%
                Adjusted                                                                          vs.
                                                                                                                                                - Continued weakening of
                                                                                                                                                  Brazilian currency
             EBITDA                           **                                                 2019
                                                                                                                                            • Improvements in execution
                                                                                                                                              continued
                                                                                                                                            • Strong cash flow generation

                                                                   $188.5M
                                                                                                                                              achieved
         YTD
    Cash Flow from
      Operations
                                                                                     93%
                                                                             vs. 2019

                                                                                                                                                                                  3
*3Q19 YTD results include $2.8 million in expense related to Mississippi river flooding and $2.3 million of executive transition expense.
**Earnings before interest, taxes, depreciation and amortization and adjusted for special items. See appendix for reconciliations.
Taking Care of People First
• Excellent progress with safety improvement
throughout the company
Total Case Incident Rate
- 3Q20 among the safest quarters in Compass (12-month rolling)
Minerals history
- Our Ogden, Utah facility nearing 1 million 4.00
working exposure hours without a lost time
injury incident
3.00
• COVID-19 mitigation efforts continue
1.49
- Staggered shift starting times at larger 2.00
operations to facilitate social distancing
- Thermal scanners installed at sites for 1.00
pre-shift temperature screenings
- PPE provided for all employees 0.00
3Q16 3Q17 3Q18 3Q19 3Q20
- Heightened controls placed on contractors
and truck drivers entering our sites
4Salt Segment Demonstrating Benefits of
Improved Execution and Optimization
Significant Margin Strong Production Performance
Improvement
30.0%
Delivered at Goderich Mine
+28%
22.7%
18.8%
17.7%
12.9%
8.8%
+53%
2020
2020
OPERATING MARGIN ADJUSTED EBITDA* THIRD QUARTER YEAR TO DATE
MARGIN
3Q18 3Q19 3Q20 2019 2020
• Strong operational execution at North American mines in 3Q20
- Record-setting performance with continuous mining at Goderich
- Excellent preparation and recovery following 4 hurricanes at Cote Blanche
Expects to make up most of lost production by year end
• 3Q20 Margin expansion also supported by incremental benefits from enterprise-wide optimization
efforts
- Logistics benefits from maximizing purchasing power across full enterprise and more efficient ship loading from
Goderich
- New pricing strategy lifting Consumer and Industrial pricing on non-deicing products
• Performance helps offset 2020-2021 NA highway deicing bid season results
5
- Bid volumes up 4% vs. market wide decline of 15%; average contracted price down 11%
*Earnings before interest, taxes, depreciation and amortization and adjusted for special items. See appendix for reconciliations.3Q20 Plant Nutrition Results Impacted by Dry
Weather in Brazil and Wildfire in Western US
• Both North and South America Plant Nutrition
businesses faced timing challenges in sales due
to dry weather conditions +10% Year-Over-Year Sales Growth
for Plant Nutrition Products
• North America sales additionally slowed by
extreme fire activity
- Most acres impacted in California’s history with four
of the largest fires ever experienced occurring in
2020
In thousands of short tons
343
Colorado and Oregon also facing wildfire challenges 327
• Soybean planting in Brazil progressing at slowest
pace in 10 years due to drought
200 239
• Underlying fundamentals remain supportive of
demand for 4Q20 and into 2021
YTD19 YTD20
- Improving pricing for many specialty crops including
Plant Nutrition South America*
tree nuts and citrus
Plant Nutrition North America
- Need for robust yield remains strong in Brazil due to
historic level of forward-sales of soybean crop
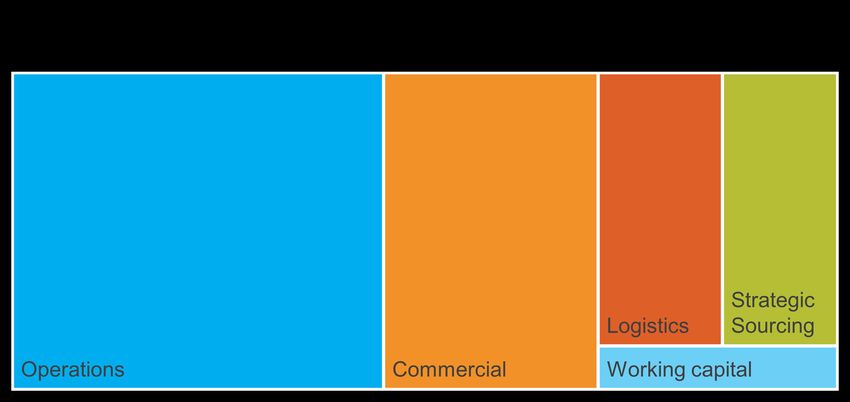
*Agriculture product sales only. 6Enterprise-Wide Optimization Highlight –
Ogden SOP Harvest Project
• Project underway expected to Full Enterprise-Wide Optimization Effort
materially increase available pond- Expected to Benefit Multiple Value Streams
based SOP feedstock through new
approach to harvesting
- Insourcing all harvest and haul
activities
- Upgrading to pond-appropriate
equipment which increase safety,
efficiency and speed
- Expected to lengthen the
evaporation season by reducing the
time required for harvesting
Innovating Our Harvest & Haul Process
Replacing Dozer/Graders & Introducing Pan Scrappers,
Loaders + On-Road Haul Trucks Articulated Truck & Excavators
7Remaining on a Strong Growth Trajectory
Initial 2020 Outlook
$350M to $400M Current 2020
Outlook
$330M to $345M**
Adjusted EBITDA* in $ millions
1Q20
$314 Mild BRL
Winter weakness COVID-19
$291 Impact vs. USD Impacts
$281
~$45M Earnings Impact
2020 guidance
2017 2018 2019 2021E
• Strategic priorities remain in place
- Building a sustainable culture
- Delivering on our commitments
- Strategic assessment
• Our enterprise-wide optimization effort has helped offset challenges beyond our control
• We remain close to our customers and ready to meet demand quickly as the sales season
becomes compressed for agriculture products
• Setting up for solid 4Q20 and continued growth in 2021
*Earnings before interest, taxes, depreciation and amortization and adjusted for special items. See appendix for reconciliations.
**Excludes $7.4 million Ogden inventory adjustment3Q20 Consolidated Results Snapshot
Consolidated Results vs.
Commentary
(Dollars in millions) 3Q19
Revenue -17% • Lower sales volumes across Salt and both Plant Nutrition North
and South America
Operating earnings -46% ̵ YTD20 sales volumes up 20% vs. prior year for Plant Nutrition North
America and 5% for Plant Nutrition South America, while Salt
volumes declined 9% on mild winter weather for the period
Adjusted EBITDA* -18%
• Improved Salt earnings partially offset weak Plant Nutrition North
and South America earnings results
Adjusted EBITDA* margin -20%
• Strong cash flow from operations, up ~$91million vs. YTD2019
Year-to- Date • Free cash flow* of ~$126 million including 2020 U.S. tax refund
$188.5
Cash flow from operations vs. ~$26 million in YTD19
Adjusted EBITDA*
(in millions)
$6.2 $(11.8)
$2.8 $55.4*
Plant
Nutrition
Corp. &
Salt North
Other
America Plant
Nutrition
South
America
3Q19 3Q20 9
*Non-GAAP measure. See appendix for reconciliations.Strong 3Q20 Salt Segment Earnings
• Salt segment 3Q20 revenue down 11%
vs. 3Q19 Salt 2017
Segment Results
3Q20 3Q19 %Δ
($ in millions)
- Sales volumes dropped 13% driven with 14%
2016
lower volumes in Highway Deicing and 8% lower Revenue $141 $160 -11%
volumes for Consumer & Industrial sales
Operating earnings $25 $21 +21%
Pre-season bulk and packaged deicing demand
depressed vs. prior year Operating earnings margin 18% 13% +5 pts
Consumer & Industrial sales also impacted by Adjusted EBITDA* $42 $36 +17%
COVID-19 related demand disruptions
Adjusted EBITDA* margin 30% 23% +7 pts
- Average selling price up 1% primarily due to
product mix vs. 3Q19 Average price per ton $85/ton $84/ton 1%
Highway deicing average selling price down 8% *Non-GAAP measures. See appendix for reconciliations.
due to highway bid price results and sales mix
C&I average selling price up 8% primarily due to Sales Volumes
pro-active price actions for non-deicing products (in thousands of short tons)
1,403
• 3Q20 earnings lifted by lower per-unit costs 1,205
- Per-unit logistics costs and product cash cost both
down 9% from prior year 500
458
Product costs benefiting from improved Goderich
production with NA Highway Deicing cash costs
down 36% vs. 3Q19
Logistics costs driven lower by optimization
efforts and fewer lock closures in 2020
- Adjusted EBITDA* margin expanded 7 percentage Highway Deicing Consumer and Industrial
points, despite impact of lower sales volumes 3Q19 3Q20 10Plant Nutrition North America Segment
Pressured by Sales Timing in 3Q20
• 3Q20 revenue down 21% vs. 3Q19 on 22% Plant Nutrition North America
lower sales volumes partially offset by 2% Segment Results ($ in millions) 3Q20 3Q19 %Δ
higher average sales price
Revenue $35 $44 -21%
- SOP sales volumes impacted by extreme
fires and drought conditions in western U.S. Operating earnings $(6.1) $4.7 -230%
delaying applications
Operating margin (17)% 11% -28 pt
- SOP-only sales price remained stable
sequentially at $575 per ton EBITDA* $3.9 $16 -75%
• Operating earnings and EBITDA* driven EBITDA* margin 11% 35% -24 pts
lower in 3Q20 by inventory adjustment as Average price per ton $651/ton $641/ton 2%
well as reduced sales volumes
*Non-GAAP measures. 3Q20 includes impact of ($7.4 million) inventory adjustment. See
- Error identified with bulk stockpile appendix for reconciliations.
measurement at Ogden SOP plant
Sales Volumes
No impact on 2020 cash flow or future (in thousands of short tons)
profitability of the segment
- Excluding $7.4 million impact from 69
adjustment, EBITDA* totaled $11.3 million, 54
28% lower vs. 3Q19, generating an EBITDA*
margin of 32%
3Q19 3Q20
113Q20 Plant Nutrition South America Results
• 3Q20 revenue down 23% vs. 3Q19 while
Plant Nutrition South
up 5% in local currency vs vs
America Segment 3Q20 3Q19 3Q20 3Q19
- Agriculture sales volumes down 11% due ($ in millions) USD USD BRL BRL
to early season demand filled in 2Q20 and
Revenue $103 -23% R$558 +5%
weather driven delays in 3Q20
- Chemical solutions sales volumes declined Operating earnings $15 -33% R$81 -9%
2% on slow recovery of industrial process
Operating earnings margin 15% -2 pts 15% -2 pts
sales
EBITDA* $20 -32% R$106 -7%
- In local currency, average selling price up
15% with agriculture pricing up 19% and EBITDA* margin 19% -2 pts 19% -3 pt
chemical solutions up 8% due to improved Average price per ton $449 -17% R$2,426 +15%
sales mix *Non-GAAP measures. See appendix for reconciliations.
• Operating earnings and EBITDA*
Sales Volumes
pressured by increased per-unit costs and (in thousands of short tons)
some pricing pressure on B2B agriculture 166
sales 148
• BRL weakened significantly vs. prior year,
reducing reported earnings 84 82
- Average 3Q20 USD-BRL rate 5.39 vs. 3.92
in 3Q19
Agriculture Chemical Solutions
3Q19 3Q20
124Q20 Outlook
Plant Nutrition Plant Nutrition
Salt
North America South America
4Q20 Revenue $310M $335M $65M $85M $100M $120M
4Q20 EBITDA $85M $100M $20M $30M $20M $30M
• Continue to expect increased 4Q20 sales volumes vs. 4Q19, although pricing anticipated
to decline due to highway deicing bid season results
• Continue to anticipate strong end to 2020 for Plant Nutrition North and South America
given underlying demand fundamentals for specialty plant nutrients
- Ready to serve a compressed application season in North America
- Strong soybean demand supporting robust farmer economics in Brazil
- Weak Brazilian currency expected to continue pressuring year-over-year reported results
Current 4Q20 USD-BRL exchange rate assumption @ ~ 5.5
132020 Full-Year Guidance Items
Key Metrics vs. Prior Guidance
(in millions of dollars unless otherwise noted)
Current (Aug. 4, 2020)
Segment Outlook Low High Low High
Salt Segment sales volumes (in millions of tons)
10.5 10.8 10.7 11.1
Plant Nutrition North America
Segment sales volumes (in thousands of tons) 340 365 unchanged
Plant Nutrition South America
Segment sales volumes (in thousands of tons) 800 900 unchanged
Consolidated and Corporate Outlook Low High Low High
Consolidated EBITDA $330 $345 $330 $370
Corporate and other expense* $50 $52 unchanged
Interest expense ~$72 $76 $78
Depreciation, depletion and amortization $135 $138 unchanged
Capital expenditures $95 $100 unchanged
Effective tax rate ~29% unchanged
*Excludes non-cash items of depreciation, amortization and stock-based compensation.
14Maintaining Strong Liquidity
Position and Improving
Balance Sheet
• $34 million of cash on hand and
more than $220 million of total
Total Year-End Liquidity
liquidity at end of 3Q20
(in millions)
$225 to - Additional ~$72 million
$302 $250 available from accounts
$252 receivable securitization facility
$202 $175 $175
$152 $130 • Proactively reduced cap ex and
$102 discretionary spending as part
$52
of balance sheet risk
$2
management
2017 2018 2019 2020E
• Anticipate ending 2020 with
adjusted net-debt-to-EBITDA
Expected FY20 FCF leverage ratio of ~3.8x
~ $125 million
15Appendix
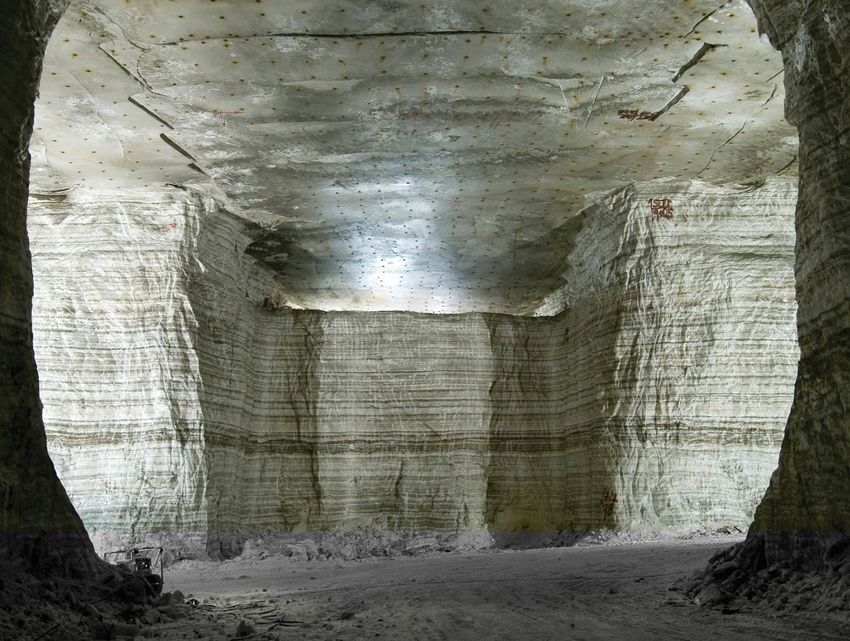
16Paving the Way for Long-Term Success at
Goderich Mine
• Expected to increase efficiency Long-Term Goderich Mine Illustration
of mining systems, decrease
maintenance needs of previously
mined space and provide greater
optionality to address potential
variability in geology and
deposit quality
• Key features include:
- Built-for-purpose roadways to
mining area which are designed for
50-year life span, have lower
ceilings and require less scaling
- Five-year panels designed to be
shuttered with minimal long-term
maintenance
Note: Not to scale, for illustrative purposes only.
17Reconciliation of Non-GAAP Information
Reconciliation for EBITDA and Adjusted EBITDA (unaudited)
(in millions)
Three months ended September 30,
2020 2019
Net (loss) earnings
$ (2.1) $ 10.6
Interest expense 17.1 17.7
Income tax (benefit) expense
(1.3) 4.8
Depreciation, depletion and amortization
35.6 33.9
EBITDA
$ 49.3 $ 67.0
Adjustments to EBITDA
Stock-based compensation – non cash
2.1 0.6
Loss (gain) on foreign exchange
4.1 (1.8)
Executive transition costs(1)
0.0 2.3
Other income, net(2)
(0.1) (0.8)
Adjusted EBITDA
$ 55.4 $ 67.3
Total Revenue
$ 282.4 $ 341.3
Adjusted EBITDA margin
20% 20%
(1) The company incurred severance and other costs related to executive transition.
(2) Primarily includes interest income. 18Reconciliation of Non-GAAP Information
Reconciliation for Salt Segment EBITDA (unaudited)
(in millions)
Three months ended September 30,
2020 2019
Segment GAAP operating earnings $ 25.0 $ 20.6
Depreciation, depletion and amortization 17.4 14.3
Segment EBITDA $ 42.4 $ 34.9
Executive transition costs 0.0 1.3
Segment adjusted EBITDA $ 42.4 $ 36.2
Segment sales 141.3 159.6
Segment adjusted EBITDA margin 30.0% 22.7%
(1) The company incurred severance and other costs related to executive transition
19Reconciliation of Non-GAAP Information
Reconciliation for Plant Nutrition North America Segment EBITDA (unaudited)
(in millions)
Three months ended September 30,
2020 2019
Segment GAAP operating (loss) earnings $ (6.1) $ 4.7
Depreciation, depletion and amortization 10.0 11.0
Segment EBITDA $ 3.9 $ 15.7
Segment sales 35.2 44.4
Segment EBITDA margin 11.1% 35.4%
Reconciliation for Plant Nutrition South America Segment EBITDA (unaudited)
(in millions)
Three months ended September 30,
2020 2019
Segment GAAP operating earnings $ 15.0 $ 22.4
Depreciation, depletion and amortization 4.4 6.0
Earnings in equity method investee 0.3 0.4
Segment EBITDA $ 19.7 $ 28.8
Segment sales 103.3 135.0
Segment EBITDA margin 19.1% 21.3%
20Reconciliation of Non-GAAP Information
Reconciliation for Free Cash Flow
(unaudited, in millions)
Nine months ending Sept. 30,
2019 2020
Cash Flow From Operations $98 $189
Capital Spending (72) (63)
Free Cash Flow $26 $126
21You can also read