Rose Leaf Disease Detection using Digital Image Processing &Deep Learning
←
→
Page content transcription
If your browser does not render page correctly, please read the page content below
International Journal of Emerging Trends & Technology in Computer Science (IJETTCS)
        Web Site: www.ijettcs.org Email: editor@ijettcs.org, editorijettcs@gmail.com
Volume 10, Issue 3, May – June 2021                                            ISSN 2278-6856

     Rose Leaf Disease Detection using Digital Image
              Processing &Deep Learning
                                        Varsha J. Sawarkar1, Dr. Seema Kawathekar2

                   1
                       Department of Computer Science& IT, Dr. Babasaheb Ambedkar Marathwada University, Ms, India

           2
               Department of Computer Science& IT, Dr. Babasaheb Ambedkar Marathwada University, Ms, India

                                                                      diseases is quite be hard to find out the diseases fastly.
Abstract—Rose plant is used to process for a research in              This was costly and improper paradigms as human
this paper.Leaf disease detection is the input for to                 intelligence is not perfect. This can be best solved using
prevent the losses in the farming and also the product.               deep learning, where the image of infected rose leafs is
Diseases decrease the efficiency of plant, which restricts            pre-processed and fit into neural network model for
the plant growth and also loss the quality and quantity. In           detection of ailment. This all basic procedure used in any
this paperthe approach is to the progress of rose leaf                approaches[4,5,6,7,8,9,10]. In addition to this, artificial
disease detection model that is based on basic image                  neural networks and SVM [12] are also used for the
classification, by the use of deep CNN. For detection on              image identification and classification. Deep learning
rose leafs we used here the image processing and deep                 avoids the features of threshold based segementation[13],
learning techniques. Deep learning is the exact and                   and its also healthy for classification of leaf diseases. In
precise model for the plant disease detection. Infected               this research, three categories of rose leafs are studied.
leaves are collected and labeled as per the diseases finding          Several artificial neural network architectures are
on it. Processing of taken image is performed along with              designed from scratch and the best model was
the pixel wise operation to get better the image                      implemented for training. Digital image processing
information. Extracting the features and fit into the                 technique such as RGB to gray scale and otsu’s
neural network. By the detection with CNN in image                    thresholding were used with the aim of exposure and
processing is the success for representing the possibility of         classificationion of leaf diseases[5].Neural networks is a
this approach in the category leaf disease detection.                 computational advance used in computer science and
Keywords—Convolutional neural networks, deep learning,                other research disciplines, which is based on a large
Image processing, Plant disease, Rectified Linear Units               collection of neural units. Each neural unit is connected
                                                                      with many others, and links can be enforcing or
1.   INTRODUCTION                                                     inhibitory in their effect on the activation state of
                                                                      connected neural units[10].
   The categorization and identification of rose plant
diseases is the technical and economical importance in
                                                                      2. MATERIALS AND METHODS
the plants species [2]. In the plant classification if we
research on rose plant, then find that the rose leaf is                  The hole procedure of developing the model for
infected by several pathogens of the plant which cause                rose plant
disease and slowly destroy its health, marketability and              disease recognition exploitation Convolutional Neural
also aesthetic value [2]. Research in Rose plants is aimed            Network              is represented more intimately. the
at to increase the amount produced quality , with a                   entire method is split into many necessary stages in
reduction      of making      make      use      of     of            subsections below, beginning with gathering images for
and with improved profit. Management of diseases is a                 classification method using neural networks.
challenging task. Traditionally, leaf diseases were
detected through chartgoing over of plant tissue by train
                                                                      DATA SET
experts [3]. As per the visually inspection of the plant

Volume 10, Issue 3, May - June 2021                                                                                  Page 1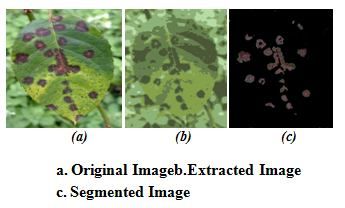
International Journal of Emerging Trends & Technology in Computer Science (IJETTCS)
        Web Site: www.ijettcs.org Email: editor@ijettcs.org, editorijettcs@gmail.com
Volume 10, Issue 3, May – June 2021                                            ISSN 2278-6856

   Datasets are required at all stages of object
recognitionresearch,startingfromtrainingphasetoevaluati
ng the presentationof detection steps. All the images
collected for the dataset were downloaded from the
Internet, searched by different disease names on
various o n l i n e sources. Images in the dataset were
grouped into different modules which represented rose
leaf diseases which could be visually determined from
leaves.      To       differentiate    healthy     leaves
fromdiseasedones, onemoreclassisadded into thedataset.
From the dataset an extra class with the background
images is beneficial to get the more accurate
classification[11]. Thus, deep neural network could be
trained to differentiate the leaves from the surrounding.
From the dataset which taken from online sources if
                                                                 B. INTERACTIVE         FOREGROUND
there was some duplicate images that are removed by                 EXTRACTION USING GRABCUT
developed python script applying the procedure. The               Everything outside this rectangle will be taken as sure
main aim of presented study is to train the network to          background and inside rectangles is unknown. Similarly
learn the features that differentiate one class from the        any user input specifying foreground and background are
others. Therefore, when using the output images, the            considered as hard-labeling which means they won’t
chance for the network to learn the appropriate features        change in the process. Computer does an initial labeling
has been increased. The augmentation process shows all          depending on the data we often find[8]. It labels the
supported diseases together with the number of orig inal        foreground and background pixels (or it hard-labels). Now
images and number of augmented images for every class           a Gaussian Mixture Model (GMM) is used to model the
used as training and validation dataset for the                 foreground and background. Depending on the data we
diseaseclassification model[5,6,7].                             gave, GMM learns and create new pixel distribution. That
                                                                is, the unknown pixels are labeled either probable
 A. IMAGE PREPROCESSING
                                                                foreground or background depending on its relation with the
     Rose leaf datasets are arbitrarily sized RGB images.       other hard-labeled pixels in terms of color statistics (It is just
 At first the image is cropped on leaf diseases area. And       like clustering). Here use k-means cluster on the input
 then converted to gray levels. To enhance the image we         images. A graph is built from this pixel distribution. Nodes
 used Laplacian filter. the RGB images into the grey            in the graphs are pixels. Additional two nodes are
 images using colour conversion using equation (1).             added, Source node and Sink node. Every foreground pixel
 f(x)=0.2989*R + 0.5870*G + 0.114.*B - - - - - - - - - - (1)    is connected to Source node and every background pixel is
 As most of the neural network models assume a square           connected to Sink node.
 shape input images, it is resized to 256× 256 pixels           The weights of edges connecting pixels to source node/end
 maintaining uniform aspect ratio. It is ensured that images    node are defined by the probability of a pixel being
 contain all the required information for feature extraction.   foreground/background. Canny edge detection is use on it.
 In order to make convergence faster while training the         The weights between the pixels are defined by the edge
 network, dataset are normalized. Then find the mean of all     information or pixel similarity. If there is a large difference
 images for the normalization. Data normalization is carried    in pixel color, the edge between them will get a low weight.
 out by subtracting the mean from each pixel, and then
 dividing the result by the standard deviation. Hence, each
 input parameter i.e. Pixel in this case, are maintained a
 similar data distribution[10,11].

Volume 10, Issue 3, May - June 2021                                                                                Page 2
International Journal of Emerging Trends & Technology in Computer Science (IJETTCS)
Web Site: www.ijettcs.org Email: editor@ijettcs.org, editorijettcs@gmail.com
Volume 10, Issue 3, May – June 2021 ISSN 2278-6856
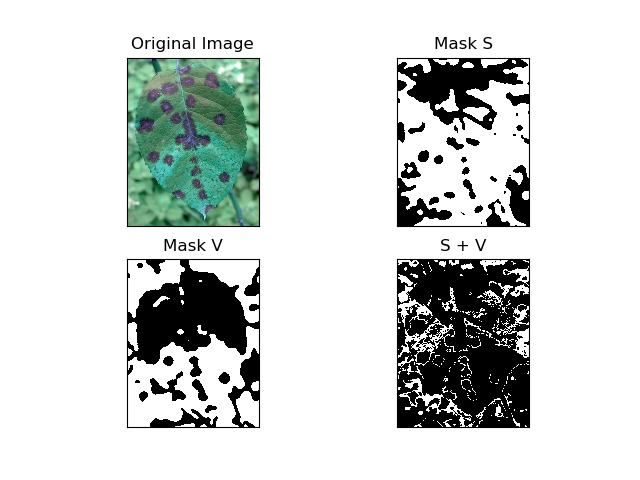
C. IMAGE SEGMENTATION Since, x shows the convolution operation and Wi shows the
convolution kernels of the layer. The values of Wi = [W 1,
W 2,…, W K], and K is the number of convolution kernels
Image segmentation is one of the most important process for of the layer. Each kernel W K is an M × M× N weight
disease detection and has a crucial impact on the overall matrix with M being the window size and N being the
performance of the developed systems[14]. The K-Means number of input channels[5,12].
clustering technique is a well-known approach that has been The hidden layer contains the hyper-parameters that fine
applied to solve low-level image segmentation tasks[9]. This tuned along with it. This resulted outputs in gradual increase
clustering algorithm is convergent and its aim is to optimize in precision. Eventually, Neural Network consisting the 7
the partitioning decisions based on a user-defined initial set hidden layers resulted the best performance and highest
of clusters[10]. This paper is proposed to k-means accuracy. Rectified linear function (ReLU(x) = max(0, x)),
segmentation method to segment target areas. The area is used as activation function and in pooling, we pass
affected by the disease is the target area. Belowfigures convolutional neural network and window size.
shows the outputs from the segmentation.Since the neural The discrepancy between predicted result and the label of
network tends to over-fit in case of limited number of the input and it defined as the sum of cross entropy into the
training data samples trained with higher number of epochs loss functions:
[15], we implement the technique of image augmentation ( )=− / ΣΣ[ ( = )+( − = = )
for artificially expanding dataset. Zoom, shear, rotation ( − ( = ))],
functions are the Image augmentation parameters used. In
addition to this,adaptive histogram equalization and contrast Where, W shows the weight matrices of convolutional and
stretching, histogram equalization are used as custom fully connected layers, n represents the number of training
functions to generate augmented images. Usage of these samples, i show the index of training samples, and k shows
parameters results in generation of images having these the index of classes. yik = 1 if the ith sample belongs to the
attributes during training of artificial neural network kth class; else yik = 0.
model.Then a threshold segmentation algorithm is used to
segment the graph. It cuts the graph into two separating P(xi = k) is the probability of input xi belonging to the kth
source node and sink node with minimum cost function. The class that the model predicts, which is a function of
cost function is the sum of all weights of the edges that are parameters W. Output layer is also a fully connected layer
cut. After the cut, all the pixels connected to Source node but in this case, softmax function is used as activation
become foreground and those connected to Sink node function. Finally, we run regression on ConvNet and Adam
become background.The process is continued until the is used as an optimization algorithm instead of the classical
classification converges. stochastic gradient descent procedure[11].
3. RESULTS AND DISCUSSIONS
The results presented in this section are related to training
with the whole database containing both original and
segmented images. It is known that convolutional networks
are able to learn features when trained images on larger
datasets, results achieved when trained with only original
images will not be explored. Taking into account the fact
that during this research our image database was developed.
In addition, since no one has used deep learning to identify
plant diseases in scientific literature, it is impossible to
compare it with other examples. In this paper, a new
D. DESIGN OF ARTIFICIAL NEURAL approach of using image processingand deep
NETWORK learningmethod was explored in order to automatically
classify and detect diseases from rose leaf images. The
Initially, 4 convolutional and pooling layers are consisting complete procedure was described, correspondingly, from
to network is built from scratch. For an input value of x of collecting the images used for training and validation to
the ith convolutional layer, it computes: = ( × ), image pre-processing and segmentation and finally the
(1) [16]. procedure of training the deep CNN.
Volume 10, Issue 3, May - June 2021 Page 3International Journal of Emerging Trends & Technology in Computer Science (IJETTCS)
Web Site: www.ijettcs.org Email: editor@ijettcs.org, editorijettcs@gmail.com
Volume 10, Issue 3, May – June 2021 ISSN 2278-6856
REFERENCES Int. J. Innov. Emerg. Res. Eng., vol. 2, no. 4, pp. 139–
144, 2015.
[1] Aakanksha Rastogi, Ritika Arora, Shanu Sharma, “Leaf [11]Dheeb Al Bashish, Malik Braik and Sulieman Bani-
Disease Detection and Grading using Computer Vision Ahmed, “Detection and Classification of Leaf Diseases
Technology &Fuzzy Logic,” presented at the 2nd using K – means based segmentation and Neural
International Conference on Signal Processing and Networks Based Classification,” Inf. Technol. J., pp.
Integrated Networks (SPIN), IEEE, 2015, pp. 500–505. 267–275, 2011.
[2]Garima Tripathi, Jagruti Save, “AN IMAGE [12]Sanjeev S. Sannakki. 2013. Diagnosis and
PROCESSING AND NEURAL NETWORK BASED Classification of Grape Leaf Diseases Using Neural
APPROACH FOR DETECTION AND Networks. 4th ICCCNT.
CLASSIFICATION OF PLANT LEAF DISEASES,” [13]S. Arivazhagan, R. Newlin Sheiah, S. Ananthi,
Int. J. Comput. Eng. Technol. IJCET, vol. 6, no. 4, pp. “Detection of unhealthy region of plant leaves and
14–20, Apr. 2015. classification of plant leaf diseases using texture
[3]S. Arivazhagan, R. Newlin Shebiah, S. Ananthi, S. features”, Vol.15, pp 211-217, March-2013.
[14]Dr. Nitin Choubey and Prashant Udawant, “Study of
Vishnu Varthini, “Detection of unhealthy region of Rose plant diseases and its identification with modern
plant leaves and classification of plant leaf diseases automation techniques.ISSN: 0975-833X.International
using texture features,” Agric Eng Int CIGR J., vol. 15, Journal of current research, vol. 9, Issue, 06, June-
no. 1, pp. 211–217, Mar. 2013. 2017.
[4]Prof. Sanjay B. Dhaygude, Mr.NitinP.Kumbhar, [15] Aniket Gharat, Krupa Bhatt, Bhavesh Kanase,
“Agricultural plant Leaf Disease Detection Using Abhilasha bapnna, “Leaf disease detection using Image
processing”.ISSN:2454-1362. Imperial Journa of
Image Processing”IJAREEIE, vol. 2(1),pp. 599-602,
Interdisciplinary Research (IJIR) Vol-3, Issu-5, 2017.
January 2013.
[5]K. Muthukannan, P. Latha, R. PonSelvi and P. Nisha,
“CLASSIFICATION OF DISEASED PLANT
LEAVES USING NEURAL NETWORK
ALGORITHMS,” ARPN J. Eng. Appl. Sci., vol. 10,
no. 4, pp. 1913–1918, Mar. 2015.
[6]Md. Nazrul Islam, M.A. Kashem, MahmudaAkter and
Md. JamilurRahman, “An Approach to Evaluate
Classifiers for Automatic Disease Detection and
Classification of Plant Leaf,” presented at the
International Conference on Electrical, Computer and
Telecommunication Engineering, RUET, Rajshahi-
6204, Bangladesh, 2012, pp. 626–629.
[7]Hrishikesh Kanjalkar P. and Prof. Lokhande S. 2013.
Detection and Classification of Plant Leaf Diseases
using ANN. International Journal of Scientific &
Engineering Research. ISSN: 2229 5518.
[8]Suhaili Beeran kutty. and Noor ezan Abdullah. 2013.
Classification of Watermelon Leaf Diseases Using
Neural Network Analysis’, IEEE Business Engineering
and Industrial Applications Colloquium (BEIAC).
International Journal of Engineering Science and
Computing, March 2017 5328
[9]H. Al-Hiary, S. Bani-Ahmad, M. Reyalat, M. Braik and
Z. ALRahamneh, “Fast and Accurate Detection and
Classification of Plant Diseases,” Int. J. Comput.
Appl., vol. 17, no. 1, pp. 31–38, Mar. 2011.
[10]Prakash M. Mainkar, Shreekant Ghorpade, Mayur
Adawadkar, “Plant Leaf Disease Detection and
Classification Using Image Processing Techniques,”
Volume 10, Issue 3, May - June 2021 Page 4You can also read