Using Artificial Neural Networks to Predict Restaurant Industry Service Recovery
←
→
Page content transcription
If your browser does not render page correctly, please read the page content below
Using Artificial Neural Networks to Predict Restaurant Industry Service Recovery
                          Han-Chen Huang

       Using Artificial Neural Networks to Predict Restaurant Industry Service
                                      Recovery
                                                     Han-Chen Huang
     No. 168, Hsueh-Fu Rd., Tanwen Village, Chaochiao Township, Miaoli County, 36143 Taiwan
         Department of Leisure Management, Yu Da University, E-mail: hchuang@ydu.edu.tw

                                                          Abstract
        Success in the service industry requires providing high-quality service and a satisfying consumer
     experience. However, regardless of the level of quality, preventing service failures is always difficult.
     When a service failure occurs, it is critical for managers to propose a quick and accurate service
     recovery plan that can satisfy the consumer. After surveying consumers, the data revealed a 72.99%
     chance that consumers will return to the place of business if they are satisfied with the service recovery
     plan. Conversely, there is a 79.64% chance that consumers will not return if they are not satisfied with
     the service recovery plan. This indicates that managers should manage consumer complaints with
     extreme care. This paper uses multilayer perceptrons (MLPs) and support vector machines (SVMs)
     neural networks to predict service recovery. The variables which are input into the MLPs and SVMs
     artificial neural networks to predict consumer expectations for service recovery are service failure type,
     easily determined consumer characteristics, the language used in customer complaints, tone of voice,
     and mood. Both MLPs and SVMs are proved to be efficient and reliable. The SVMs method is more
     accurate (PPV=95%) than the MLPs method (PPV=87.5%).

                    Keywords: Service Failure, Service Recovery, Artificial Neural Networks

     1. Introduction

        With the fast growth of economic development and individual incomes, the relative proportion of
     service industry businesses in Taiwan has grown increasingly higher. The service industry constituted
     57% of Taiwan’s GDP in 1990, and that rate grew to 67.10% by 2010, showing the rising influence
     and importance of the service industry to Taiwan’s economy.
        As the service industry has grown, competition within the service industry has intensified. To
     sustain perpetual operation, a business must attract new consumers as well as keep existing consumers.
     Desatnick[1] indicated that the cost of attracting one new consumer is roughly equal to five times the
     cost of maintaining an existing consumer. Reichheld and Sasser[2] stated further that if a business can
     reduce the consumer loss rate by 5%, it may produce a profit of 25% to 85%, depending on the
     industry. Therefore, many businesses have changed from an “offensive” strategy of focusing the
     business on new consumers to a “defensive” strategy of satisfying and retaining existing consumers[3].
     Goodwin and Ross[4] stated that a service failure at any service contact point during service delivery
     produces a negative reaction by the consumer, resulting in a complaint. McCollough and Bharadwaj[5]
     found that consumers receiving service recovery from a business have a higher level of satisfaction
     than do consumers who experience no service failure at all, demonstrating that effective service
     recovery can increase consumer satisfaction. However, Holloway and Beatty[6] showed that 57% of
     consumers are not satisfied with the management of service failures and that service recovery is an area
     where many businesses need improvement.
        For a business to recover from a service failure, it must first understand the situation that led to that
     service failure. We used a consumer survey method to examine the types of service failure encountered
     in the fastfood restaurants to determine the expected service recovery. In addition, we used artificial
     neural networks to build a service recovery prediction model that can be used onsite when providing
     service.

International Journal of Advancements in Computing Technology(IJACT)                                                315
Volume4,Number10,June2012
doi:10.4156/ijact.vol4.issue10.37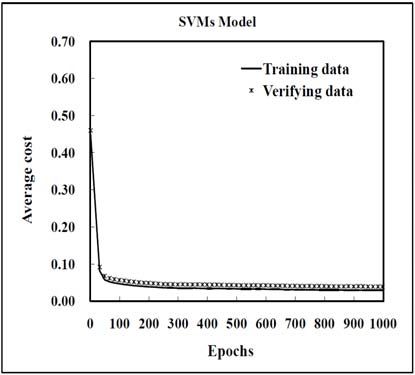
Using Artificial Neural Networks to Predict Restaurant Industry Service Recovery
                   Han-Chen Huang

2. Questionnaire survey and findings

   We aimed to build a service recovery prediction model that can be directly used onsite when
providing service to predict consumer expectations for service recovery, and we acquired the data
required for the model’s training, cross-validation, and testing using a questionnaire survey. The
contents of the questionnaire were divided into two parts.
   First part: Whether consumers had an unhappy experience when dining at the fastfood restaurant;
the type of unhappy experience; whether they made a complaint; how the business handled it; how the
consumer expected it to be handled; whether they were satisfied with that service recovery; and
whether they will return.
   Second part: expression of customer complaint (language used, degree of anger, tone of voice) and
basic personal information (gender, age: young, middle-aged, or elderly, and dress).
   We sent a total of 1,000 questionnaires in Taipei to two Chinese restaurants, two Western
restaurants, and two breakfast restaurants, and received 719 validly completed questionnaires. Figure 1
is the tree diagram of questionnaire results. Unhappy experiences were reported in 61.34% of the
questionnaires, with 10 types of customer complaints provided for respondents to choose from. The
customer complaint that was reported most frequently was waiting too long (27.44%), followed by
food quality (22.90%) and an unhygienic environment (17.69%). This indicates that businesses should
increase service speed and pay attention to food quality and cleanliness. In addition, employees who
directly serve customers should receive more training and improve their ability to respond to situations
so that they can reduce the occurrence of errors.

                             Figure 1. Tree diagram of questionnaire results

   Figure 1 also shows that among the 250 customer complaints of service failure, business provided a
poor service recovery 113 times. Under these circumstances, the percentage of consumers who did not
return was 79.65%. By comparison, in situations with a good service recovery, the consumer loss rate
was only 27.01%, showing that businesses must have an effective service recovery mechanism to
influence whether consumers return. If the business can accurately present a remedial plan that meets
consumer expectations, there is a chance that they can win back the consumer’s trust and retrieve the
consumer’s business.
   Among the 719 valid questionnaires, 250 respondents reported having the experience of making
complaints, and the three main methods of addressing complaints (constituting 66.4%) were “apology,”
“exchange for equivalent product,” and “Personal explanation by manager(Table 1). However, as can
be seen in Table 2, the primary method of service recovery desired by consumers is “personal
explanation by the manager” (22.4%), indicating that onsite employees may lack the authority or

                                                                                                           316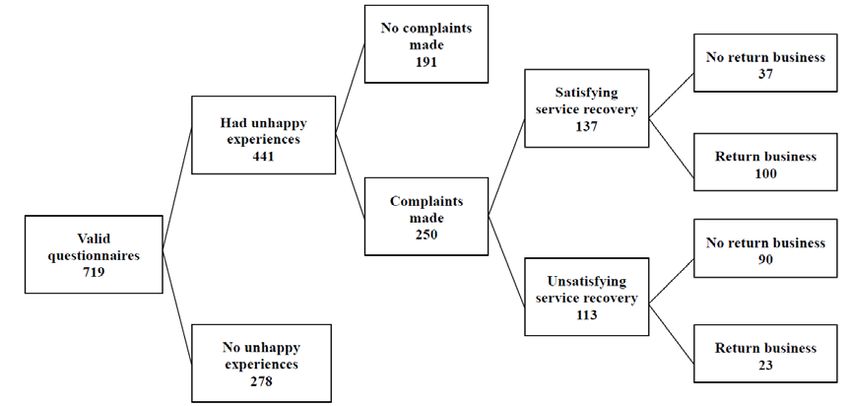
Using Artificial Neural Networks to Predict Restaurant Industry Service Recovery
                   Han-Chen Huang

sincerity to “take corrective action” or “apologize” voluntarily, leading the consumer to expect that the
manager should personally explain the problem.

                    Table 1. Frequency distribution of business handling methods
                            Type                                 Frequency       Percentage
                            Apology                                             70                    28.00%
                Exchanging for equivalent product                               53                     21.20%
                Personal explanation by manager                                 43                    17.20%
                           Correction                                           30                     12.00%
                       Offering free food                                       23                      9.20%
                       Offering coupons                                         17                      6.80%
                 Making this visit complimentary                                14                      5.60%
                              Total                                            250                    100.00%

         Table 2. Frequency distribution of service recovery methods expected by consumers
                               Type                                         Frequency            Percentage
                Personal explanation by manager                                  56                   22.40%
                            Apology                                              49                   19.60%
                           Correction                                            38                   15.20%
                 Making this visit complimentary                                 34                   13.60%
                Exchanging for equivalent product                                29                   11.60%
                        Getting free food                                        25                   10.00%
                  Getting coupons or discounts                                   19                   7.60%
                               Total                                             250                  100.00%

3. Artificial neural networks

   Artificial neural networks (ANNs) are effective in addressing classification problems because they
can learn from noisy data and generalize findings. The first neural network model (the perceptron) was
developed by Rosenblatt in the late 1950s. Since then, several other models have been proposed; for
example, generalized feed-forward networks, radial basis function networks, the Hopfield model,
multilayer perceptrons, modular networks, support vector machines, and self-organizing feature maps.
These models differ in architecture and in how they learn and behave; thus, they are suitable for
various types of problems.
    Numerous applications involve ANNs to solve real-world problems. For commercial purposes,
ANNs can be applied to predict profit, market movements, and price levels based on the market’s
historical dataset. In medical applications, doctors can evaluate the situation of many patients
depending on the historical dataset of other patients with the same illness. In industry, engineers can
apply ANNs to solve various engineering problems such as classification, prediction, pattern
recognition, and non-linear problems that are extremely difficult or potentially impossible to solve
using normal mathematical processes[7].
   In this study we used multilayer perceptrons (MLPs) and support vector machines (SVMs)
neural networks to predict the service recovery expected by consumers when a service failure
occurs. Table 3 list the input and output variables.

                                                                                                                317
Using Artificial Neural Networks to Predict Restaurant Industry Service Recovery
Han-Chen Huang
Table 3. Input and output variables
Type Variables
X1:Product defect, such as cold, overcooked, or bad food
X2:Slow service
X3:Service not delivered
X4:Unclear rules, such as restaurant not accepting foreign currency or credit
cards
Service
X5:Food not prepared as requested
Failure
X6:Seating problem, such as refusing a customer’s request for specific
Type seating
X7:Public health and hygiene problem
Input X8:Inappropriate employee behavior, such as being rude or impolite
X9:Delivery of wrong product
X10:Error with check or checkout
Expression X11:Language used for complaint (Taiwanese, Mandarin, or other)
of X12:Degree of anger (on scale of 4 points from calm to furious)
Complaint X13:Tone of voice (on scale of 4 points from slow to urgent)
Consumer X14:Gender
External X15:Age (young, middle-aged, or elderly)
Characteristics X16:Dress (formal or casual)
Y=1,Free food
Y=2,Coupon or discount
Expected
Y=3,Personal explanation by manager
Service
Output Y=4,Receiving equivalent product
Recovery
Y=5,Corrective action
Methods
Y=6,Apology
Y=7,Making this visit complimentary
3.1 MLPs neural network
The MLPs neural network used in this study contains three layers. The NeuroSolutions software was
used to construct the required model. The constructed model consists of an input layer, a nonlinear
hidden layer, and an output layer. The hidden layer and output layer apply the tanh transfer function.
The MLPs neural network was trained and based on 170 questionnaires. The cross-validation process
of the network uses a dataset of 40 questionnaires. The testing process is defined as data used to
evaluate the performance after the training is complete. The trained network was tested based on 40
questionnaires that were not used in the training and cross-validation set. Table 4 lists the distribution
of datasets. The number of nodes of the network is the number of exemplars of the training set equal to
170 and 1,000 epochs. Note that the number of nodes is configured automatically by the NeuralBuilder.
3.2 SVMs neural network
As with MLPs model, a NeuroSolutions programmer was used to transform the data from an input
space to a high-dimensional space using a radial basis function (RBF) network that places a Gaussian
distribution at each data sample[8]. Thus, the feature space becomes as large as the number of samples.
The SVMs neural network was divided into two parts to implement the RBF dimensionality expansion
and a large margin classifier.
As with MLPs, SVMs use the concept of back-propagation training to train the linear combination
of Gaussians. SVMs are motivated by the concept of training and use only those inputs that are near the
decision surface because they provide the most information about the classification[9]. The training,
cross-validation, and testing processes of SVMs were conducted based on the same dataset that was
used in the MLPs to ensure an exact comparison in the quality of the results between the MLPs and
SVMs.
318Using Artificial Neural Networks to Predict Restaurant Industry Service Recovery
Han-Chen Huang
Table 4. Distribution of datasets
Personal Exchanging Making
Getting Getting
explanation for Correctio visit
free coupons or Apology Total
by equivalent n complim
food discount
Dataset manager product entary
Train 15 12 40 20 26 34 23 170
validation 5 4 8 4 6 7 6 40
Test 5 3 8 5 6 8 5 40
4. Empirical results
The training, cross-validation, and testing dataset classification using SVMs and MLPs are listed in
Tables 5, 6, and 7, respectively. To validate the proposed model, positive predicted value (PPV) was
computed as
PPV=(Correct results / All results) x 100% (1)
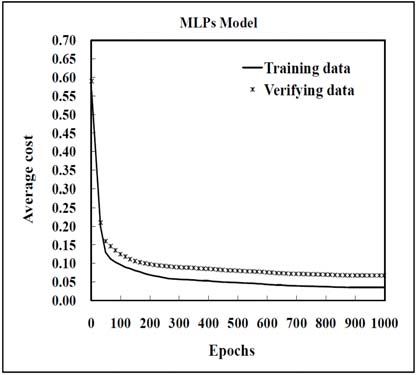
Figure 2 shows the SVMs and MLPs learning curves. The active cost curves approaches zero which
means that classification of the dataset was carried out correctly. Table 8 shows the mean square error
(MSE), correlation coefficient (r), and PPV. The testing result (PPV) of the trained SVMs is higher
than that of the MLPs model, with 90% accuracy. Although the prediction effect of the MLPs is less
effective, it still has 83.33% accuracy; therefore, both the SVMs and MLPs models have high
prediction ability.
Table 5. Training dataset classification
Getting
Personal Exchanging Making this
Clas Getting coupon explanation for Correctio visit Tota
Model free s or Apology
s by equivalent n complimentar l
food discoun
manager product y
t
True 14 11 40 20 26 34 23 168
SVMs
False 1 1 0 0 0 0 0 2
True 12 10 38 20 23 32 21 156
MLPs
False 3 2 2 0 3 2 2 14
Table 6. Cross-validation dataset classification
Getting
Personal Exchanging Making this
Clas Getting coupon
Model explanation for Correctio visit Tota
s free s or Apology
by equivalent n complimentar l
food discoun
manager product y
t
True 4 3 8 4 6 7 6 38
SVMs
False 1 1 0 0 0 0 0 2
True 3 2 7 4 5 7 6 34
MLPs
False 2 2 1 0 1 0 0 6
319Using Artificial Neural Networks to Predict Restaurant Industry Service Recovery
Han-Chen Huang
Table 7. Testing dataset classification
Getting
Personal Exchanging Making this
Clas Getting coupon
Model explanatio for Correcti visit Tota
s free s or Apology
n by equivalent on complimentar l
food discoun
manager product y
t
True 4 2 8 5 6 8 5 38
SVMs
False 1 1 0 0 0 0 0 2
True 3 2 7 5 5 8 5 35
MLPs
False 2 1 1 0 1 0 0 5
Figure 2. The SVMs and MLPs model learning curves
Table 8. Mean square error, correlation coefficient, and PPV of our research
Training data Cross-validation data Testing data
Model MSE r PPV MSE r PPV MSE r PPV
SVMs 0.0338 0.9774 98.82% 0.0704 0.9381 95% 0.0833 0.9315 95%
MLPs 0.0416 0.9446 91.76% 0.0920 0.8261 85% 0.1114 0.8369 87.5%
5. Conclusions
After surveying consumers, “Slow service” is the primary complaint by consumers; therefore, fast
service should be one of the goals of fastfood restaurants operators. Businesses must reduce the time
consumers spend waiting as much as possible or explain to consumers the standard waiting time so that
consumers can feel at ease instead of anxious.
When a service failure occurs, the business should provide the correct service recovery as expected
by the consumer. We discovered that if the service recovery can satisfy the consumer, there is a
72.99% chance that they will return. If the consumer is not satisfied with the service recovery, there is
a 79.64% chance that they will not return. Businesses should manage consumer complaints with
extreme care and offer the appropriate service recovery depending on the onsite situation. This should
320Using Artificial Neural Networks to Predict Restaurant Industry Service Recovery
Han-Chen Huang
be considered as a second sales opportunity, and the maintenance of good consumer relations is
essential for the long-term operations of a business.
We used a questionnaire to collect consumer opinions and to present the actual expectations of
consumers. Businesses must reassess their methods for managing consumer complaints to determine
whether they deviate from the actual expectations of consumers. Thus, businesses can prevent a
mistaken service recovery from offending the consumer a second time after the original service failure.
Using MLPs and SVMs neural network to predict consumer expectations for service recovery
is a feasible method. We obtained a prediction accuracy of 87.5% using MLPs and 95% using
SVMs. The prediction model using consumer complaint type, easily determined consumer
characteristics (gender, age: young, middle-aged, or elderly, and dress), and complaint
expression style (language, tone, and mood) can help onsite service personnel make a correct
service response.
6. References
[1] R. L. Desatnick, Managing to Keep the Customer, Houghton Mifflin, USA, 1988
[2] F. F. Reichheld, W. E. Sasser, "Zero Defections: Quality Comes to Services", Harvard Business
Review, Vol. 68, No. 5, pp. 105 ~ 111, 1990
[3] C. Fornell, "A National Customer Satisfaction Barometer: The Swedish Experience", Journal of
Marketing, Vol. 56, No.1, pp. 6 ~ 21, 1992
[4] C. Goodwin, I Ross, "Consumer Response to Service Failure: Influence of Procedural and
Interactional Fairness Perceptions", Journal of Business Research, Vol. 25, No.2, pp. 149 ~ 163,
1992
[5] M. A. McCollough, S. G. Bharadwaj, "The Recovery Paradox: An Examination of Consumer
Satisfaction in Relation to Disconfirmation, Service Quality, and Attribution-Based Theories",
Marketing Theory and Application, Vol. 65, No. 4, pp. 102 ~ 107, 1992
[6] B. B. Holloway, S. E. Beatty, "Service Failure in Online Retailing: A Recovery Opportunity",
Journal of Service Research, Vol. 6, No. 1, pp. 92 ~ 105, 2003
[7] B B Chaudhuri, U. Bhattacharya, "Efficient Training and Improved Performance of Multilayer
Perceptrons in Pattern Classification", Neurocomputing, Vol. 34, No. 1, pp. 11 ~ 27, 2000
[8] Lingling Song, "Improved Intelligent Method for Traffic Flow Prediction Based on Artificial
Neural Networks and Ant Colony Optimization", JCIT, Vol. 7, No. 8, pp. 272 ~ 280, 2012
[9] Jun-Jun Cheng, Yun Liu, Hui Cheng, Yan-Chao Zhang, Xia-Meng Si, Chang-Lun Zhang, "Growth
Trends Prediction of Online Forum Topics Based on Artificial Neural Networks", JCIT, Vol. 6,
No. 10, pp. 87 ~ 95, 2011
321You can also read