Understanding the Influence of the Conowingo Reservoir Infill on Expectations for States' Nutrient and Sediment Pollutant Load Reductions
←
→
Page content transcription
If your browser does not render page correctly, please read the page content below
Understanding the Influence of
the Conowingo Reservoir Infill
  on Expectations for States’
    Nutrient and Sediment
  Pollutant Load Reductions

  Chesapeake Bay TMDL 2017 Midpoint Assessment Webinar Series
                       October 20, 2016

                                                     Chesapeake Bay Program
                                                      Science, Restoration, Partnership
Welcome to the Reservoir Conowingo
            Infill Webinar
• To Ask a Question
   – Submit your question in the
     chat box, located in the bottom
     left of the screen, at any time
     during the webinar. We will
     answer as many as possible
     during a Q&A session following
     the presentation.

• For A/V Help
   – For audio or visual questions,
     please use the “Audio Help” box
     in the center-left of the screen.

                                         2
Welcome to the Reservoir Conowingo
          Infill Webinar
• We ARE Recording this Session
   • The recording and related resources will be available on the
     Chesapeake Bay Program’s calendar page for today’s webinar.
   • http://www.chesapeakebay.net/calendar/event/24340/

                                                                    3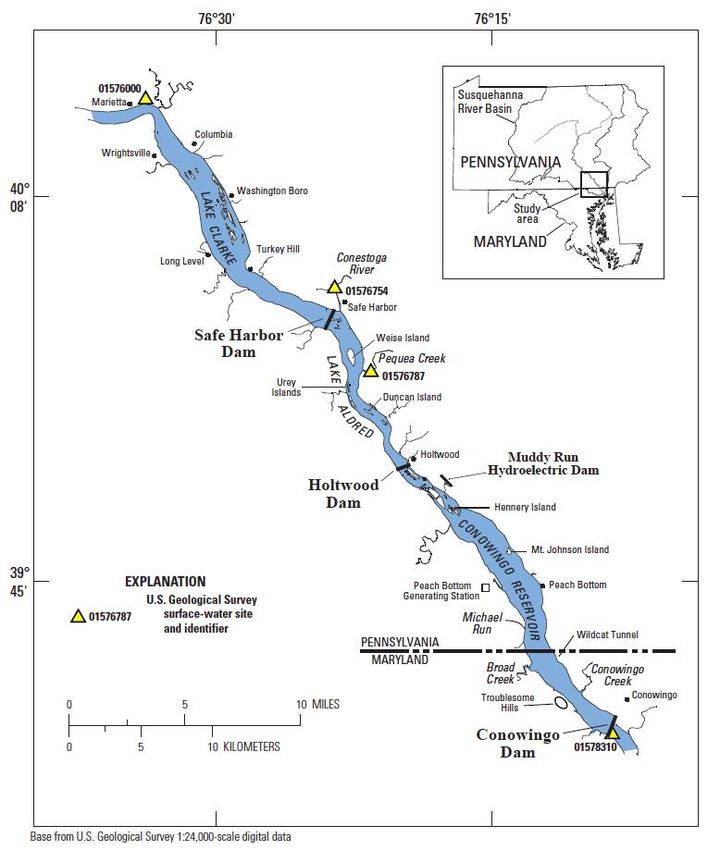
Goals for Today’s Webinar

• Increasing understanding of what current research,
  modeling and monitoring is telling us about changes
  in the lower Susquehanna reservoir system

• Insights on how these findings could influence
  expectations for the states’ nutrient and sediment
  pollutant load reductions between 2018 and 2025

• Partnership timeline for deciding on how much and
  who will be responsible for offsetting the additional
  loads coming through the reservoir system
                                                          4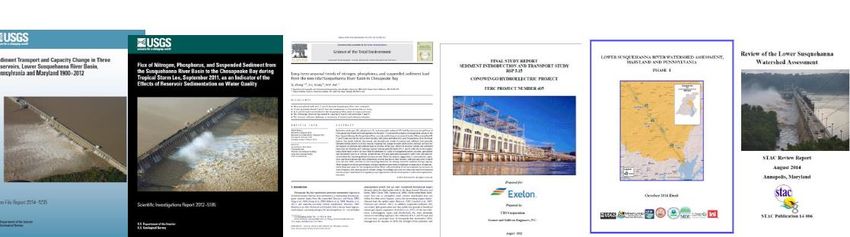
Today’s Speakers

            Lee Currey                                 Joel Blomquist                           Dr. Robert Hirsch
Maryland Department of the Environment                U.S. Geological Survey                    U.S. Geological Survey
  CBP Modeling Workgroup Co-Chair            CBP Integrated Trend Analysis Workgroup          CBP Scientific and Technical
                                                             Co-Chair                        Advisory Committee Member

                                  Lew Linker                                   David Wood
                       U.S. Environmental Protection Agency            Chesapeake Research Consortium
                       CBP Modeling Workgroup Coordinator                   CBP Water Quality Goal                           5
                                                                          Implementation Team Staff
Putting the Susquehanna
River Watershed and the
System of Reservoirs into
      Perspective
             Lee Currey
Maryland Department of the Environment
  CBP Modeling Workgroup Co-Chair

                                         6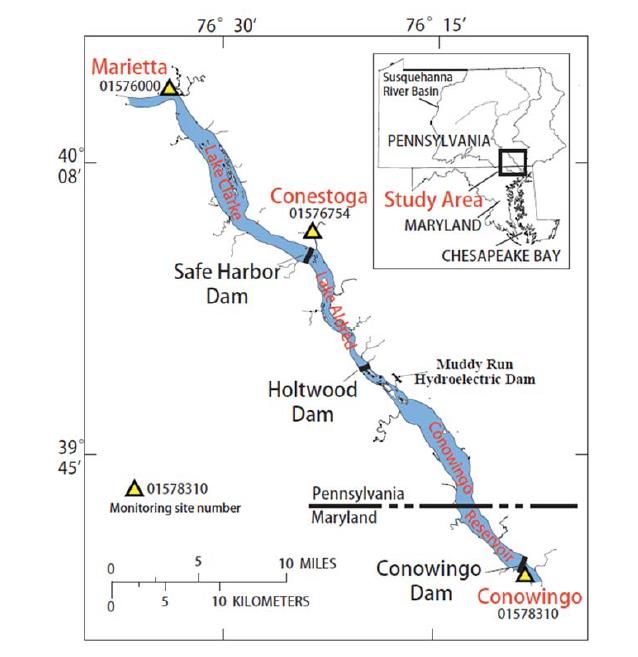
Susquehanna River Has a Major Influence on
      Chesapeake Bay Water Quality
                                           Susquehanna
                                              watershed
•   43% of Chesapeake Bay watershed
•   47% of freshwater flow into the Bay
•   41% of nitrogen loads to the Bay
•   25% of phosphorus loads to the Bay
•   27% of sediment loads to the Bay
•   Influences Bay water quality well Potomac
                                       watershed
    into Virginia’s portion of the Bay

                                                          7
Source: Linker (2014)
Three Reservoirs in the
       Lower Susquehanna

  The System of Reservoirs has
  been filling over time.

                                    Safe Harbor
                                        Dam

                              Lake Clark
                                                              Holtwood
                        1950-2015                               Dam

                                                     Lake Aldred

       Vertical Exaggeration 264x                 1920-2015                              Conowingo Dam

                                                                            Conowingo Reservoir

                                                                         1960    1990 2015

                                                                                                         8
Source: Langland and Blomquist, USGS, personal communication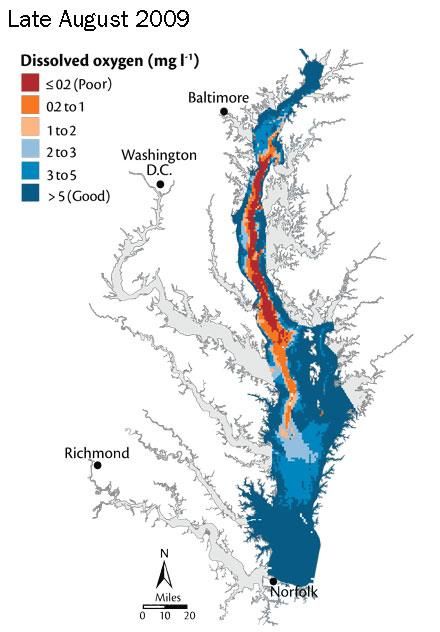
Timeline for Lower Susquehanna River Reservoirs: 1900-2020
1900
       1910 – Holtwood Dam constructed

1920   1920 – Holtwood Dam reaches equilibrium
       1928 – Conowingo Dam constructed
       1931 – Safe Harbor Dam constructed
1940
       1950 – Safe Harbor Dam reaches equilibrium

1960   1960s – Historical lowest flows in Susquehanna

       1972 – Tropical Storm Agnes

                                                                             Conowingo Dam
1980   1979 – Systematic water quality monitoring begins on the Susquehanna River at Conowingo Dam

       1996 – “Big Melt” flood event

2000   2001 – SRBC convenes “Susquehanna Sediment Task Force” Symposium; publishes report

       2010 – Chesapeake Bay TMDL established
       2012 – Hirsch 2012 scientific paper publishes clear evidence for Conowingo Reservoir at or near dynamic equilibrium
       2017 – Bay TMDL Midpoint Assessment
2020

Source: Langland, USGS, Personal Communication
Characteristics of Net Reservoir Trapping
                                       DN
                                              N2
                             PN

    Nitrogen
                                                   Key:
                                                   PN=    Particulate
                              PP                          Nitrogen
                                       DP
                                                   DN=    Dissolved
                                                          Nitrogen

Phosphorus                                         PP=    Particulate
                                                          Phosphorus
                                                   DP=    Dissolved
                                                          Phosphorus
                                                   SS=    Suspended
                                  SS                      Sediment

    Sediment
                                                                  10
Source: Currey, MDE, Personal Communication
Recent History of Working
to Understand
Conowingo/Bay
Interrelationships
Lee Currey
Maryland Department of the Environment
CBP Modeling Workgroup Co-Chair
11Significant New Monitoring, Research Since 2011 is
Guiding Modeling Advancements/Refinements
• U.S. Geological Survey (USGS) (2012, 2014, 2015)
• U.S. Army Corps of Engineers (2015)
• Johns Hopkins University (2013, 2015, 2016)
• CBP Scientific and Technical Advisory Committee (2014, 2016)
• Enhanced Monitoring and Modeling funded by Exelon and
conducted by Gomez and Sullivan, University of Maryland and
USGS (2014-2016)
122016 STAC Conowingo Workshop
Key Workshop Findings:
• Reservoir system has long been a trap for particulate nutrients
and sediment but is now at or near a condition of dynamic
equilibrium
• Ability of reservoir system to trap sediment and attached
nutrients has decreased compared to the first 90 years
because the deposited sediment has caused the reservoirs to
become shallower and thus less able to trap sediment and
more prone to scour
• To quantify the influence of infill conditions, the following
must be considered:
– Loss of trapping during low to moderate flow
– Change in scour threshold during higher flows
– Relatively rare extreme events
– Fate of particulate material to the Bay
13
Source: CBP Scientific and Technical Advisory Committee (2016)Observed Water Quality
Trends Throughout the
Susquehanna River
Watershed
Joel Blomquist
U.S. Geological Survey
CBP Integrated Trends Analysis Team Co-Chair
14Monitoring
Susquehanna River at Conowingo
3
Concentration in mg/L
Total Phosphorus
2
1
0
1985 1990 1995 2000 2005 2010 2015
800
Streamflow in 1,000 CFS
600
400
200
0
1985 1990 1995 2000 2005 2010 2015
15Total Phosphorus Annual Load
SUSQUEHANNA RIVER AT CONOWINGO, MD
Phosphorus
Susquehanna River at Conowingo
Water Year
Annual Flux Estimates
2500050
IN MILLION POUNDS PER YEAR
2000040
TOTAL PHOSPHORUS LOAD,
Flux in tons/year
1500030
1000020
500010
00
1985
1985 1990
1990 1995
1995 2000
2000 2005
2005 2010
2010 2015
2015
16Flow-Normalized Phosphorus Load
SUSQUEHANNA RIVER AT CONOWINGO, MD Phosphorus
Susquehanna River at Conowingo
Water Year
Flux Estimates (dots) & Flow Normalized Flux (line)
2000050
18000
IN MILLION POUNDS PER YEAR
1600040
TOTAL PHOSPHORUS LOAD,
14000
Flux in tons/year
1200030
10000 Change in Load 1985 to 2014 = +54%
800020
6000
Change in Load 2005 to 2014 = +44%
10
4000
2000
0
0
1985
1985 1990
1990 1995
1995 2000
2000 2005
2005 2010
2010 2015
2015
17Total Phosphorus
per Acre Loads and Trends:
2005-2014
Susquehanna
Watershed
Average Load (lbs/ac)
0.13- 0.50
0.51– 1.00
1.01– 2.31
Trend Direction
No Trend
Improving
Degrading
Chesapeake
Bay 18
Source: http://cbrim.er.usgs.gov/maps.html, Modified to highlight Susquehanna WatershedTotal Nitrogen
per Acre Loads and Trends:
2005-2014
Susquehanna
Watershed
Average Load (lbs/ac)
1.19 – 6.88
6.89– 13.75
13.76– 33.44
Trend Direction
No Trend
Improving
Degrading
Chesapeake
Bay 19
Source: http://cbrim.er.usgs.gov/maps.html, Modified to highlight Susquehanna WatershedSuspended Sediment
per Acre Loads and Trends:
2005-2014
Susquehanna
Watershed
Average Load (lbs/ac)
18 - 510
511 – 1,021
1,022 – 2,206
Trend Direction
No Trend
Improving
Degrading
Chesapeake
Bay 20
Source: Modified to highlight Susquehanna Watershed, results from http://cbrim.er.usgs.gov/maps.htmlBetter Understanding
What’s Happening in the
System of Reservoirs
Dr. Robert Hirsch
U.S. Geological Survey
CBP Scientific and Technical Advisory
Committee Member
21Trapping Significantly Decreased over Last Century-
Now Considered to be in Dynamic Equilibrium
Sediment Load (million tons)
22
Source: Langland 2016Nutrient and Sediment Loading Trends into and
Out of the Reservoir System (1985 to 2014)
Long-Term Monitoring Trends
Monitoring Station Total Total
Sediment
Name Nitrogen Phosphorus
Susquehanna at
Marietta
Conestoga River
Pequea Creek * * *
Susquehanna at
Conowingo
Source: USGS Trend Results published to internet in 2016
* WQ data record not long enough for establishing trends
- improving - degrading 23Nutrient and Sediment Loading Trends into and
Out of the Reservoir System (2005 to 2014)
Recent Monitoring Trends
Monitoring Station Total Total
Sediment
Name Nitrogen Phosphorus
Susquehanna at
Marietta
Conestoga River
Pequea Creek ?
Susquehanna at
Conowingo
? ?
Source: USGS Trend Results published to internet in 2016
? Indicates that trend analysis was inconclusive
- improving - degrading 24Nitrogen Loads Into, Trapped Within and
Exiting the Reservoir System: 1990s-2010s
Early 1990’s, about 20% of N trapped
~170 ~30 ~140
Loads Loads Out of
Into
Early 2000’s, about 10% of N trapped
Reservoir
Reservoir System -
System ~160 ~20 ~140 Conowingo
Long term long term
improving improving
trend trend
Early 2010’s, Approaching no net trapping
~130 ~0 ~130
Source: Data from USGS (2016), http://cbrim.er.usgs.gov/loads_query.html 25
loads are approximate and in units of million lbs/year using estimates for 1992, 2002, and 2012Phosphorus Loads Into, Trapped Within and
Exiting the Reservoir System: 1990s-2010s
Early 1990’s, about 50% of P trapped
~10 ~5 ~5
Loads Out of
Loads
Early 2000’s, about 40% of P trapped Reservoir
Into
System -
Reservoir
Conowingo
System ~11 ~5 ~6
Long term
Long term
degrading
improving
trend
trend
Early 2010’s, Approaching no net trapping
~8 ~0 ~8
Source: Data from USGS (2016), http://cbrim.er.usgs.gov/loads_query.html 26
loads are approximate and in units of million lbs/year using estimates for 1992, 2002, and 2012Sediment Loads Into, Trapped Within and
Exiting the Reservoir System: 1990s-2010s
Early 1990’s, about 60% of Sed trapped
~7 ~4 ~3
Loads Out of
Loads Reservoir
Into
Early 2000’s, about 40% of Sed trapped System -
Reservoir Conowingo
System ~8 ~3 ~5 Long term
Long term degrading
improving trend
trend
Early 2010’s, approaching no net Sed trapping
~6 ~0 ~6
Source: Data from USGS (2016), http://cbrim.er.usgs.gov/loads_query.html 27
loads are approximate and in units of billion lbs/year using estimates for 1992, 2002, and 2012What’s Happening in the System of
Reservoirs: A Summary
• For all three variables Total Nitrogen, Total Phosphorus, and
Suspended Sediments the net trapping by the reservoir system
has gone to approximately zero in the last decade or so.
• Net trapping is likely to remain at that level in the future.
• As a consequence the trends towards decreased loads in all three
variables for the inputs result in either level or increased loads at
the bottom of the system.
• Future decreases in loads into the system can be expected to lead
to decreases at the bottom of the system because in the future
long-term mean output is likely to equal long-term mean input.
• This history of changing system storage behavior provides a basis
for verifying the formulation of the reservoir reach processes in
the phase 6 watershed model.
28Reminder:
• To Ask a Question
• Submit your question in the chat box, located in the
bottom left of the screen.
29Implications for the
Jurisdictions’ Phase III
WIPs Planning Targets
Lee Currey
Maryland Department of the Environment
CBP Modeling Workgroup Co-Chair
30Nutrients Associated with Sediments No Longer Trapped
in the Conowingo Reservoir are Influencing Bay WQ
Modeling estimates from the
Modeling estimated
2015 Lower Susquehanna
23% deep-channel River Watershed Assessment
Dissolved Oxygen (LSRWA) report
(DO) standard indicate about 1 - 3%
nonattainment in additional water quality DO
Chesapeake Bay standards non-attainment
Segment 4-
Mesohaline
31
Source: Linker et al. (2016), LSRWA (2015)The 2010 Chesapeake Bay TMDL said… “EPA’s intention is to assume the current trapping capacity will continue through the planning horizon for the TMDL (through 2025). The Conowingo Reservoir is anticipated to reach a steady state in 15 – 30 years, depending on future loading rates, scour events and trapping efficiency.” Source: Appendix T. Sediments behind the Susquehanna Dams Technical Documentation: Assessment of the 32 Susquehanna River Reservoir Trapping Capacity and the Potential Effect on the Chesapeake Bay (U.S. EPA 2010)
The 2010 Chesapeake Bay TMDL said…

  “Under these assumptions, the waste load
  allocations (WLA) and load allocations (LA) would
  be based on the current conditions at the dam.”

Source: Appendix T. Sediments behind the Susquehanna Dams Technical Documentation: Assessment of the           33
Susquehanna River Reservoir Trapping Capacity and the Potential Effect on the Chesapeake Bay (U.S. EPA 2010)
The 2010 Chesapeake Bay TMDL said…

 “If future monitoring shows the trapping capacity of
 the dam is reduced, then EPA would consider
 adjusting the Pennsylvania, Maryland and New York
 2-year milestone loads based on the new delivered
 loads. The adjusted loads would be compared to the 2-
 year milestone commitments to determine if the states
 are meeting their target load obligations.”

Source: Appendix T. Sediments behind the Susquehanna Dams Technical Documentation: Assessment of the           34
Susquehanna River Reservoir Trapping Capacity and the Potential Effect on the Chesapeake Bay (U.S. EPA 2010)
How Does Infill Influence 2010 Bay TMDL
Allocation Principles to Set Jurisdiction Targets

 • Allocated loads will result in achievement of the
   states’ Chesapeake Bay water quality standards
 • Areas that contribute the most to the Bay water
   quality problems must do the most to resolve
   those problems (on a pound-per-pound basis)
 • All tracked and reported reductions in nitrogen
   and phosphorus loads are credited toward
   achieving final assigned loads
 • Special considerations for the headwater states
 • Principles implemented through modeling tools
                                                       35
Allocation Methodology Used to Divide the
Cap Loads Among Jurisdictions
Higher influence—
Assigned more implementation
Level of required
Effort
(based on
range
between
doing nothing
to doing
everything, Lower influence—
everywhere) less implementation
required
Basin/Jurisdiction Relative Influence on Mainstem Bay Dissolved Oxygen
36
Source: U.S. EPA 2010Relative Influence on Bay Dissolved Oxygen
Changing as a Result of Reservoir Infill
Less trapping and
more nutrient/
sediment loads
may translate to
higher relative
influence on Bay
water quality by
Susquehanna
River Watershed
loads
37
Source: U.S. EPA 2010Impact of Extreme Flow Events on Chesapeake
Bay Water Quality Standards Attainment
“[The Bay TMDL’s] 10-year return period captures a
good balance between guarding against extreme events
and ensuring attainment during more frequent critical
events”
• Extreme events have impacts but are relatively rare
• Timing of the events is important
• Water clarity recovers relatively quickly
• Resiliency between events important for recovery
Source: Appendix G. Determination of Critical Conditions for the Chesapeake Bay TMDL Introduction (U.S. EPA 2010)
38Improving our Decision
Support Tools to Better
Understand Reservoir
System Responses to
Management Actions
Lew Linker
U.S. Environmental Protection Agency
CBP Modeling Workgroup Coordinator
39Improving the Decision Support Tools
“The Models” for the 2017 Midpoint Assessment
• From STAC Workshop in Conowingo Infill:
– “Conowingo models should be evaluated based on the
ability to “hindcast” data from observations and
statistical analyses, simulate the full range of flows,
and address bioavailability of sediment nutrients”
• Applying multiple lines of evidence:
– Statistical model results (WRTDS)
– Physically based models (HEC-RAS2, Conowingo
Pool Model (CPM))
– Historic observations, measured bathymetry/infill,
etc. provide additional sediment data for
corroboration
40Multiple Lines of Evidence for Simulating More data
Conowingo and
new
Infill Conditions statistical
model
(WRTDS)
HEC-RAS2
Model of
Holtwood
and Safe
Physically based Harbor
Conowingo Pool
Model (CPM) Five historic
bathymetric
surveys &
recent core
More data and samples
new statistical
model
41
Source: Langland 2015New Phase 6
reservoir model TMDL Critical flow period
captures reservoir
behavior under
various flow &
infill conditions.
In addition, the
biogeochemical
reactivity of
scoured material
is represented.
42Chesapeake Bay
Model
• New reservoir model
provides improved
input into Bay model.
• Bay model used to
evaluate attainment
of State water quality
criteria.
• Refinements to
biogeochemistry and
factoring in recent
monitoring are
included.
43
Chesapeake Bay Water Quality and Sediment Transport ModelReview Process to Finalize the Modeling Tools
and Communication to Senior Leadership
Modeling Workgroup
CRC –
Reservoir
Review
44Take away Messages:
• The CBP Modeling Workgroup is factoring into the Phase 6 Model
the latest research on Conowingo infill from the Geologic Survey
(USGS), U. Maryland Center for Environmental Studies (UMCES),
Hydroqual Inc., WEST Inc., and other sources.
• Additional information from UMCES research will be used to better
represent the modeled Chesapeake tidal water response to
particulate nutrient and sediment loads scoured from Conowingo
sediment.
• Scientific peer reviews of the Conowingo infill research and its
simulation by the CBP models will be conducted by the CBP
Scientific and Technical Advisory Committee (STAC) and the
Chesapeake Research Consortium (CRC).
• The CBP Models are under development with the current (Beta 3)
version including most elements of the latest Conowingo research
and the December 2016 (Beta 4) version to include the detailed
Conowingo Pool Model. The results presented today will be refined
going forward.
45Key Findings to Date
and Next Steps To
Support Partnership
Decision-Making
Lee Currey
Maryland Department of the Environment
CBP Modeling Workgroup Co-Chair
46Take Away Messages
• Outputs from the Susquehanna basin has a significant influence
on Chesapeake Bay water quality.
• The net reservoir trapping ability is near zero.
• Loss of net trapping ability has an effect on outputs of TN, TP,
and SS, but the effect is greatest on SS and least on TN.
• New information available for factoring in the influence of
particulate nutrients on Bay WQ
47Take Away Messages
• The loss of net trapping has an impact on how upstream
pollution management practices will translate into downstream
impacts on water quality.
• The ability to model this change is challenging, but new data and
research will result in improved ability to predict how watershed
strategies will influence the ability to achieve the states’ water
quality standards.
• The majority of nutrients are transported to the Bay during
moderately high flow periods.
• The key issue is not just scour during flood events, but is rather
the net trapping over the entire range of hydrologic conditions
48Conowingo Reservoir Infill
Decision-Making Timeline
Three Key Sets of Partnership Decisions:
• December 2016*: Which jurisdictions will be responsible
for addressing the additional nutrient and sediment loads
resulting from infill of the Conowingo Reservoir
• May 2017*: How much additional nutrient and sediment
loads must be addressed resulting from infill of the
Conowingo Reservoir
• December 2017: Final Phase III WIP planning targets fully
reflect best understanding of additional loads from infill of the
Conowingo Reservoir
* Date of PSC approval – WQGIT and MB recommendations will be made in preceding months 49Questions and Answers
Session
David Wood
Chesapeake Research Consortium
CBP Water Quality Goal Implementation Team Staff
50Questions and Answers Session
• To Ask a Question
• Submit your question in the chat box, located in the
bottom left of the screen.
51Literature Cited
Cerco, C.F. 2016. Conowingo Reservoir Sedimentation and Chesapeake Bay: State of the Science. Journal of
Environmental Quality. 45: 3: 882-886 DOI:10.2134/jeq2015.05.0230
Exelon Corporation, “Sediment Introduction and Transport Study”, RSP 3.15, Conowingo Hydroelectric Project, FERC
No. 405, May 2011.
Friedrichs, C., T. Dillaha, J. Gray, R. Hirsch, A. Miller, D. Newburn, J. Pizzuto, L. Sanford, J. Testa, G. Van Houtven,
and P. Wilcock. 2014. Review of the Lower Susquehanna River Watershed Assessment. Chesapeake Bay Program
Scientific and Technical Advisory Committee Report. No. 14-006, Edgewater, MD. 40 pp.
http://www.chesapeake.org/stac/presentations/247_Final%20STAC%20
LSRWA%20Review%20Report%208.22.14.pdf
Hirsch, R.M., 2012, Flux of Nitrogen, Phosphorus, and Suspended Sediment from the Susquehanna River Basin to the
Chesapeake Bay during Tropical Storm Lee, September 2011, as an Indicator of the Effects of Reservoir Sedimentation
on Water Quality, U.S. Geological Survey, Scientific Investigations Report 2012-5185, 17 p.
Langland, M.J. 2015, Sediment transport and capacity change in three reservoirs, Lower Susquehanna River Basin,
Pennsylvania and Maryland, 1900–2012. US Geological Survey Open-File Rep. 2014-1235. USGS, Reston, VA.
Linker, L., R. Hirsch, W. Ball, J. Testa, K. Boomer, C. Cerco, L. Sanford, J. Cornwell, L. Currey, C. Friedrichs, R. Dixon.
2016. Conowingo Reservoir Infill and Its Influence on Chesapeake Bay Water Quality. STAC Publication Number 16-
004, Edgewater, MD. 51 pp.
Linker, L., R. Batuk, C. Cerco, G. Shenk, R. Tian, P. Wang, and G. Yactayo. 2016. Influence of Reservoir Infill on Coastal
Deep Water Hypoxia. Journal of Environmental Quality. 45:3: 887-893 DOI:10.2134/jeq2014.11.0461
52Literature Cited (Cont.)
USACE. 2015. Lower Susquehanna River watershed assessment report. US Army Corps of Engineers, Baltimore District,
Baltimore, MD. http://dnr2.maryland.gov/waters/bay/Documents/LSRWA/Reports/LSRWAFinalMain20160307.pdf
USEPA. 2010a. Chesapeake Bay total maximum daily load for nitrogen, phosphorus, and sediment: Appendix T.
Sediments behind the Susquehanna dams technical documentation—Assessment of the Susquehanna River reservoir
trapping capacity and the potential effect on the Chesapeake Bay. US Environmental Protection Agency Chesapeake Bay
Program Office, Annapolis MD. http://www.epa.gov/reg3wapd/tmdl/ChesapeakeBay/tmdlexec.html
USEPA. 2010b. Chesapeake Bay total maximum daily load for nitrogen, phosphorus, and sediment. US Environmental
Protection Agency Chesapeake Bay Program Office, Annapolis MD.
USGS. 2016. Water-Quality Loads and Trends at Nontidal Monitoring Stations in the Chesapeake Bay Watershed. Reston,
VA. [accessed 2016 October 5). http://cbrim.er.usgs.gov/index.html
Zhang, Q., R. Hirsch, W. Ball. 2016. Long-Term Changes in Sediment and Nutrient Delivery from Conowingo Dam to
Chesapeake Bay: Effects of Reservoir Sedimentation. Environ. Sci. Technol. 50 (4), pp 1877–1886: DOI:
10.1021/acs.est.5b04073.
Zhang, Q., D. Brady, and W. Ball. 2013. Long-term seasonal trends of nitrogen, phosphorus, and suspended sediment load
from the non-tidal Susquehanna River basin to Chesapeake Bay. Sci. Total Environ. 452–453:208–221.
doi:10.1016/j.scitotenv.2013.02.012
53Access to Conowingo Reservoir
Infill Webinar Recording
A recording of this webinar along with the presentation will be
posted to the following page on the Chesapeake Bay Program
Partnership’s website:
Conowingo Reservoir Infill Webinar Calendar Page:
http://www.chesapeakebay.net/calendar/event/24340/
Please Note: A second, follow-up Conowingo Reservoir Infill
Webinar will be scheduled for March 2017
54You can also read