Design and Development of Real Time ECG Monitoring System - sersc
←
→
Page content transcription
If your browser does not render page correctly, please read the page content below
International Journal of Advanced Science and Technology
                                                          Vol. 29, No.4, (2020), pp. 3617 – 3625

 Design and Development of Real Time ECG Monitoring System

                Rabiya Begum Mohd Saleem*, Ramesh .R.Manza
   Department of Computer Science & Information Technology, Dr.Babasaheb
           Ambedkar Marathwada University, Aurangabad. (M.S)
                *rabiya.altaf@gmail.com,manzaramesh@gmail.com

                                            Abstract
   ECG monitoring system is the vital and very important medical tool used for
monitoring the person’s cardiac health; it is non invasive and painless procedure. This
paper aimed to describe the Real time ECG monitoring system designed and developed
using microcontroller. The designed system is a portable device having a small analog
front end circuit, a microcontroller unit, a display and storage unit and software designed
in MATLAB for Analysis of the ECG signals. The major goal of the work is to develop a
prototype which is easy to use, portable, having very less cost and accurate. The
proposed system acquires the signals using electrodes placed on the surface of the skin
and display these real time signals on LCD screen with its heart rate. The device is also
equipped with a memory card that stores a person’s ECG data for analysis in MATLAB.

Keywords: ECG, Arduino Mega microcontroller, TFT LCD display, Signal processing,
MATLAB

1. Introduction

   Cardiovascular diseases (CVD) are the number one killer across the world, India has
also increased the CVD ratio over 50% and the highest deaths had noted across less
developed areas this is a major cause of concern. India is country having 68.86% rural
population and the main challenge is to provide cardiac solutions available. The
motivation towards this research work is to develop a portable, easy to use and low cost
ECG monitoring system with automated analysis. An electrocardiogram abbreviated
as ECG or EKG is a test that checks how your heart is functioning by measuring
the electrical activity of the heart. A cardiologist can determine if this activity is
normal or abnormal. ECG is used to detect abnormal heart rhythms called
arrhythmias, heart problems including a recent or ongoing heart attack, coronary
artery blockage, areas of damaged heart muscle from a prior heart
attack, enlargement of the heart, non-heart conditions such as electrolyte
imbalances and lung diseases, monitor recovery from a heart attack, progression of
heart disease, or the effectiveness of certain heart medications or a pacemaker and
to rule out hidden heart disease in patients about to undergo surgery. [1]The ECG
procedure is simple and painless, electrodes are placed on skin and the activity is recorded
on a graph paper and usually interpreted by a cardiologist.

     ISSN: 2005-4238 IJAST                                                                3617
     Copyright ⓒ 2020 SERSC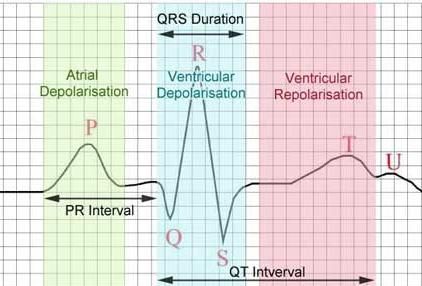
International Journal of Advanced Science and Technology
                                                         Vol. 29, No.4, (2020), pp. 3617 – 3625

                             Figure 1: ECG Normal Sinus Rhythm

   The normal ECG trace is a graph of amplitude versus time forming positive and
negative deflections called waves like p, QRS and T. these waves are the representation
of the electrical activities generated by hearts muscles P wave represents atrial
depolarization.QRS complex is having three closely related waves Q, R and S, it
represents ventricular depolarization. After QRS there is a small wave called T which
represents ventricular repolarizatin that is the ventricles are resetting electrically and
preparing for their next muscle contraction. Other clinically important features of ECG
are PR interval it is the time taken for electrical activity to move between atria and
ventricles. The ST segment shows when the ventricle is contracting but no electricity is
flowing through it, it appears as a straight, level line between the QRS complex and the T
wave. RR interval is the time between two QRS complexes. QT interval is the time taken
for the ventricles to depolarize and then repolarize. [2]

2. Methodology

                   Figure 2: ECG Monitoring System Block diagram

     ISSN: 2005-4238 IJAST                                                               3618
     Copyright ⓒ 2020 SERSC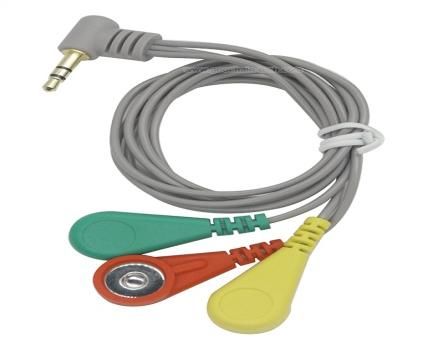
International Journal of Advanced Science and Technology
                                                               Vol. 29, No.4, (2020), pp. 3617 – 3625

   The proposed ECG monitoring system is a portable microcontroller based device
which acquires raw ECG signals through electrodes attached on the limbs of the person.
The major components of the system are AFE analog front end unit, Microcontroller unit,
Display unit and MATLAB program for analysis. The fetched signal is given input to the
AFE (analog front end) amplified and filtered here further it is digitized and processed at
the microcontroller unit (Arduino mega 2560) and visualized on the TFT LCD screen.
The display also shows Heart rate which is calculated real time at microcontrollers side
also a recording program is written in Arduino to record the signal. The signal can be
recorded up to 60 seconds but here we are storing only for thirty seconds. Normally
ECG’s are recorded for 10 seconds.

2.1 Electrodess

   Electrodes are the electrically conductive self adhesive pads that consist of
an electrically conductive electrolyte gel and a silver/silver chloride conductor. These are
sticked at the body surface and connected through the lead wires to AFE.

                          (a)                                              (b)

                            Figure 3: Electrodes (a), Lead Wires (b)

2.2 Analog Font End (AFE)

    It is an analog signal conditioning circuit comprise of Instrumentation amplifier and
operational amplifiers for analog signal amplification and filtering. As ECG signals are of
very low amplitude signals that require amplification, for this work we have used
Instrumentation amplifier Texas instruments IC INA 128P which is a differential
amplifier operates on very low power i.e. 2.25v, having very high common mode
rejection ratio up to 120 db. It offers variable gain that we can set any gain from 1 to
10,000 by using a signal external resistor the gain equation of INA 128 is shown in
equation 1. Here we have set the gain 1000.

         50KΩ
G=1+      Rg
                --------------------------- (1)

A point of concern while amplification of very low impedance signal is DC offset, DC
offset is a mean amplitude displacement from zero , it is a potential source of distortion
and loss of information hence adjustments are required. One way of adjusting the output
offset voltage is offset trimming it can be done through reference pin of the
Instrumentation amplifier. The voltage applied to the ref pin is summed with the output.
[3] The circuit below shows the offset trimming in INA 128P [4].

     ISSN: 2005-4238 IJAST                                                                     3619
     Copyright ⓒ 2020 SERSC
International Journal of Advanced Science and Technology
Vol. 29, No.4, (2020), pp. 3617 – 3625
Figure 4: Offset trimmer Circuit diagram
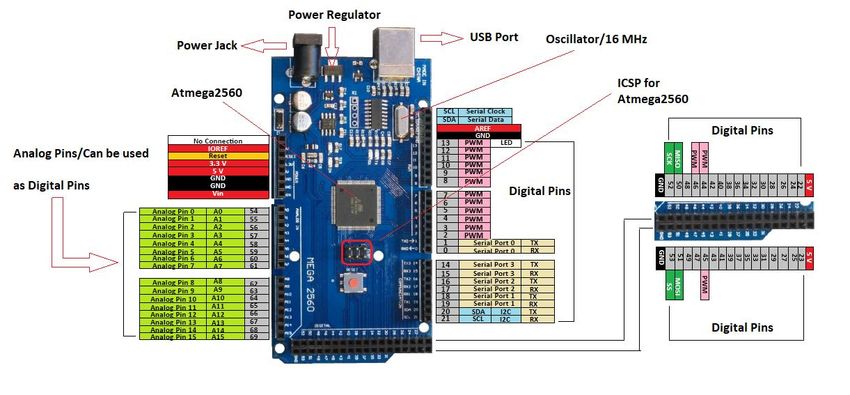
2.3 Microcontroller Unit
The purpose of the work is to make the device portable that requires an embedded
controller to control the actions and features of a devices altogether. For this work we
have used Arduino mega microcontroller board for its ease of availability, use, flexibility
of working with more memory space and processing power. The use of Arduino also
minimizes the components in a system like external ADC (analog to digital converter) is
not required as Arduino mega itself consists of 10 bit ADC. Moreover working with
Arduino is very simple and easy because of its programming software IDE available free
of cost and provides flexibility of language for writing program in it with a basic
knowledge of programming. The pin diagram of Arduino mega is shown in figure 5.
Figure 5: Arduino Mega 2560
2.4 Display and Storage Unit
Many embedded systems requires real time access to the output here in this work we
are acquiring the real time ECG signals and these signals are to be displayed real time
with no delay. The TFT LCD screen of 3.5 inch is used here to display the real time
signals. The touch screen provides ease of access and flexibility. This screen is interfaced
to Arduino mega using a shield which is just plugged in to Arduino board and also comes
with the micro SD card slot for storage of the real time signals. The display also shows
the real time heart rate of a person. The table 1 shows the direct plug in pin mapping of
TFT shield with Arduino mega2560.
ISSN: 2005-4238 IJAST 3620
Copyright ⓒ 2020 SERSCInternational Journal of Advanced Science and Technology
Vol. 29, No.4, (2020), pp. 3617 – 3625
Table 1: Direct Insertion Instructions for Arduino Mega2560
microcontroller test pins
Corresponding to Mega2560
Number Module Pin
development board direct plug pins
1 5V 5V
2 3V3 3.3V
3 GND GND
4 LCD_D0 8
5 LCD_D1 9
6 LCD_D2 2
7 LCD_D3 3
8 LCD_D4 4
9 LCD_D5 5
10 LCD_D6 6
11 LCD_D7 7
12 LCD_RST A4
13 LCD_CS A3
14 LCD_RS A2
15 LCD_WR A1
16 LCD_RD A0
17 SD_SS 10
18 SD_DI 11
19 SD_DO 12
20 SD_SCK 13
2.5 Power Supply Unit
Two 9v batteries are used to power the AFE unit as the In-amp needs dual power
supply +9v and -9v. Another 9v battery is used to power the Arduino board. The batteries
are rechargeable that makes the system power efficient.
2.6 Analysis Using MATLAB
The automated analysis of the recorded signals is very important. The software is
designed in MATLAB for automated analysis of ECG signals that is to determine whether
the signal is normal or suffering from arrhythmias. There are five steps involved in this
process.
2.6.1. Load CSV File: The live signals are recorded in the form of CSV file and stored
in the memory card. The GUI in MATLAB Initially loads these CSV files and after
selecting the recorded signal it goes for the next step.
2.6.2. Preprocessing: The raw signal is then applied with preprocessing techniques for
noise removal and refinement for the preparedness of feature extraction. The ECG signal
contains two major artifacts baseline defect and high frequency noise due to patient’s
movement and electromagnetic effects in the surroundings. As the baseline defect is
nearly eliminated at the device level here, we need to remove the high frequency noise.
ISSN: 2005-4238 IJAST 3621
Copyright ⓒ 2020 SERSCInternational Journal of Advanced Science and Technology
Vol. 29, No.4, (2020), pp. 3617 – 3625
The band pass filter of frequency 0.5 to 45 Hz is designed to make the signal smooth with
the valuable information for peaks detection. [15]
2.6.3. Detection of Waves: The adaptive Thresholding method is than applied to detect
the waves like P wave, QRS complex and T wave in the signal. Each wave is having
standard amplitude and morphology any change in the standard values has clinical
significance for finding abnormality. [15]
2.6.4. Calculation of Intervals: After Detection of waves the important step is
calculating the intervals of the waves. The PR, RR and QT intervals are major findings of
an ECG signal to classify the signal as normal and abnormal. [15]
2.6.5. Heart Rate: Heart rate is the number of times the heart beats in one minute. The
normal range of a heart rate is 60 to 100 bpm. Once the RR interval is found the heart rate
can be easily calculated with the formula,
Heart Rate=No of beats in 10 seconds*6.
3. Results and Discussion
Initially the AFE circuit is designed and tested on digital storage oscilloscope (DSO)
and virtual oscilloscope and confirms the ECG trace. For making the system portable and
compact work on microcontroller unit using Arduino mega 2560 is been done which also
results in some modifications in an AFE circuit. The prototype is also tested on serial
plotter of Arduino; finally the device is shielded in a box for avoiding interferences.
ECG’s are prone to noises and are sensitive in nature the challenging task while working
with such type of systems is to reduce and minimize the distortions and interferences. The
proposed system also acquires some high frequency noises which is eliminated using
digital filters designed in MATLAB. Figure 6 and 7 shows the device and the live ECG
on display with heart rate .the screen is having a ON button to start recording of ECG data
and stored in a CSV file that CSV files are uploaded in a MATLAB GUI for analysis. The
recorded raw ECG signal can be seen in figure 8 which includes some noises those are
removed using band pass filter in MATLAB shown in figure 9. Figure 10 shows the
screen of MATLAB GUI showing the raw and processed signal with detected waves and
the important parameters of ECG analysis PR interval, RR interval, QT interval and QRS
duration.
Figure 6: Proposed ECG Device
ISSN: 2005-4238 IJAST 3622
Copyright ⓒ 2020 SERSCInternational Journal of Advanced Science and Technology
Vol. 29, No.4, (2020), pp. 3617 – 3625
Figure 7: Real Time ECG Plot
Figure 8: Raw ECG signal
Figure 9: Filtered ECG signal
ISSN: 2005-4238 IJAST 3623
Copyright ⓒ 2020 SERSCInternational Journal of Advanced Science and Technology
Vol. 29, No.4, (2020), pp. 3617 – 3625
Figure 10: MATLAB GUI showing Analysis
4. Conclusion
The Enhanced ECG monitoring system designed and developed is real time, portable ,
compact , robust and having very low cost as compared to the systems available in the
market. It provides acquisition of ECG signals using electrodes placed on the body
surface. The touch screen LCD provides live monitoring of signals with heart rate. The
system is equipped with a SD card of 4GB to store records of patients. We can also
extend the capacity as per the requirement. The system also provides the automated
analysis of the recorded ECG signals using MATLAB GUI which classifies the signals as
normal and abnormal by finding the amplitudes and intervals of the ECG signals. The
proposed system can be used at homes and clinics in rural areas where emergency
services are not easily available as the cost of the system is very low. It is also safe to use
because it is operated on batteries and also have patient’s safety circuit.
Limitations and Future Scope
The proposed system is Real time hence it takes few second after starting to stable and
taking ECG needs a person to be stable, without any metallic things for acquiring signals
with minimal artifacts. The system is using 2 individual power supplies for Arduino and
for AFE that can be improved with a single supply unit for both. The proposed system can
be enhanced in terms of wireless data transfer by using Wi-Fi or Bluetooth technology.
Acknowledgments
We would like to express our special thanks to Department of Computer Science and
Information Technology, Dr.B.A.M University Aurangabad for research facilities and
Maulana Azad National Research fellowship for funding to accomplish the objectives.
ISSN: 2005-4238 IJAST 3624
Copyright ⓒ 2020 SERSCInternational Journal of Advanced Science and Technology
Vol. 29, No.4, (2020), pp. 3617 – 3625
References
[1] https://www.heartandstroke.ca/heart/tests/electrocardiogram.
[2] https://geekymedics.com/understanding-an-ecg/.
[3] INA 128 datasheet, http://www.ti.com/lit/ds/symlink/ina128.pdf
[4] http://www.learningaboutelectronics.com/Articles/Op-amp-offset-null-terminals.
[5] http://eprints.polsri.ac.id/4598/8/File%20VIII%20%28Lampiran%29.pdf.
[6] Jose J.Segura-Juarez, David Cuesta-Frau, Luis Samblas-pena, and Mateo Aboy “A
Microcontroller Based Portable Electrocardiograph Recorder “ IEEE transactions on Biomedical
Engineering, vol.51, no.9, September 2004.
[7] EI Mimouni EI Hassan and Karim Mohammed “Design and Implementation of an embedded
system for Ambulatory cardiac monitoring “Journal of Telecommunications and Information
Technology 2012.
[8] Pourus Mehta and sudheer KM “Development of a low cost ,portable,12 lead ECG machine for
health care centers across Rural India” Medical Diagnostic methods 2013.
[9] Byungkook Jeon ,Jundong Lee and Jaehong Choi” Design and Implementation of a Wearable
ECG system” International Journal of Smart Home ,vol-7, no-2, March 2013.
[10] Kiran Kumar Jembula, Prof G. Srinivasulu , Dr.Prasad K.S “Design of Electrocardiogram(ECG
or EKG) System on FPGA” International Journal of Engineering and Science ,vol.3, issu2, (May
2013), pp 21-27.
[11] Naazneen M.G.,Sumaya Fathima,Syeda Husna Mohammadi, Sarah Iram L.Indikar, Abdul saleem
, Mohammed Jebran” Design and Implementation of ECG Monitoring and Heart rate
Measurement System” International Journal of Engineering science and Innovative Technology
(IJESIT) vol.2, issue.3, May 2013.
[12] Abdul Qayoom Bhat ,Vineet Kumar , Sunil Kumar “Design of ECG data Acquisition System”
International Journal of Advanced Research in Computer Science and Software Engineering , vol-
3,issue-4,April 2013.
[13] Onuiri Ernest , Awodele Oludele, Adegbo Boluwatife O., Madu Nissi C., Jhonson Iniobong E.
“Design and construction of a microcontroller based heartbeat monitoring device with display”
International Journal of Engineering & Technology, vol.33, no.2,(2014),pp- 279-289..
[14] Ali Mohammed Jobayer, Shishir Bordhan, Md Towhidul Islam, Nipu Kumar Das “Design and
Implementation of 3-lead ECG machine for rural medification” International Conference on
Electrical Engineering and Information Communication Technology(ICEEICT),2015.
[15] Rabiya begum , Ramesh.R.Manza”Detection of Cardiomyopathy Using Support vector machine
and Artificial Neural Network” International Journal of Computer Applications , Vol. 133,no.14,
January 2016.
[16] R.A.D. Aruna Niresh , T.R Ariyarathne , R.Lelwala and K.D.I Wasudeva “Computerized ECG
machine” International Conference on Advances in ICT for Emerging Regions September 2016.
ISSN: 2005-4238 IJAST 3625
Copyright ⓒ 2020 SERSCYou can also read