2019 Atlantic Hurricane Season Outlook: June 6, 2019 - Willis Towers ...
←
→
Page content transcription
If your browser does not render page correctly, please read the page content below
eVENT
      Willis Research Network
      Hurricane Season Outlook

2019 Atlantic Hurricane Season Outlook: June 6, 2019
This seasonal forecast briefing is the first in this season’s series to be released as new information becomes
available. In this briefing, we provide an initial overview of how the season appears to be shaping up.

Current situation
The 2019 North Atlantic hurricane season started ahead of schedule, with Subtropical Storm Andrea. Andrea was weak
and short-lived, remaining out over the open North Atlantic during its short life-span. However, Andrea marks the fifth
consecutive year with a storm forming ahead of the official hurricane season start date of June 1. There are currently no
tropical disturbances to keep an eye on, but as the Atlantic Ocean follows its annual warming trend into the summer, what
levels of hurricane activity can we expect?

Forecasts
Available forecasts from the major forecasting centers call for a quieter season than last year, but still range from average
to slightly above average hurricane activity for 2019 (Table 1). The forecast numbers of named storms across the major
forecasting centers are confined to a fairly narrow range from 12 to 14.5 with an average of 13.6 (compared to an
historical average of 12). For hurricanes, the numbers also fall within a narrow range from 6 to 7 with an average of 6.2
(compared to an historical average number of 6.4), and for major hurricanes (Saffir-Simpson category 3-5) they range
from 2 to 3 (compared with an historical average of 2.7). The rather narrow ranges appear to be a result of a large amount
of agreement on the predicted environmental conditions for 2019. However, as discussed later, there still remains
substantial uncertainty and forecast agreement does not necessarily imply forecast accuracy.

The National Oceanic and Atmospheric Administration (NOAA)’s prediction for near-normal activity is based on a balance
of competing hurricane drivers. An expected continuation of the current El Niño is balanced by an expectation for
continued warmer-than-normal North Atlantic Ocean temperatures. Tropical Storm Risk (TSR) caution that their forecast
for near-normal conditions contains some uncertainty due to uncertainty in the progression of El Niño through the
hurricane season. In their early June forecast, Colorado State University (CSU) raised their expectations above their early
April forecast. This is based on their increased confidence for a weakening El Niño through the hurricane season and
additional anomalous Spring warming having occurred in the North Atlantic Ocean. Despite these forecasts for near-
normal activity, wunderground.com cautions that 2004 - one of the most active U.S. landfalling seasons - was also
preceded by weak El Niño conditions.
Atlantic seasonal hurricane forecasts as of June 6, 2019
Table 1. Summary of 2019 Atlantic Seasonal Hurricane Forecasts
# Named # Major
Date Storms # Hurricanes Hurricanes ACE1
Data Source Issued (% of normal) (% of normal) (% of normal) (% of normal)
1981-2010 average (Source CSU) 12.1 6.4 2.7 106
Average of 5 analog years (Source CSU) June 4, 2019 14.0 (116%) 6.0 (94%) 2.0 (74%) 100 (94%)
Colorado State University2 June 4, 2019 14.0 (116%) 6.0 (94%) 2.0 (74%) 100 (94%)
NOAA/CPC3 May 23, 2019 12.0 (99%) 6.0 (94%) 3.0 (111%) 109 (103%)
Tropical Storm Risk3 May 30, 2019 12.0 (99%) 6.0 (94%) 2.0 (74%) 88 (83%)
The Weather Company May 6, 2019 14.0 (116%) 7.0 (109%) 3.0 (111%) n/a
North Carolina State University3 Apr 16, 2019 14.5 (120%) 6.0 (94%) 2.5 (93%) n/a
Average of the all of the above 13.4 (111%) 6.2 (96%) 2.4 (90%) 99 (94%)
Analog years
An alternative view to forecast models is provided by hurricane activity in past years that had similar pre-season climate
conditions and forecast conditions to this year. CSU uses this approach to qualitatively correct the output from their
empirical forecast technique. CSU’s selected analog years — 1990, 1991, 2012, 2014 and 2018 — are characterized by
weak El Niño conditions and near-average North Atlantic sea surface temperatures for the peak of the hurricane season.
The average activity among these 5 analog years is shown in the above table and indicates about average numbers of
named storms, hurricanes and major hurricanes, the same as their official forecast.
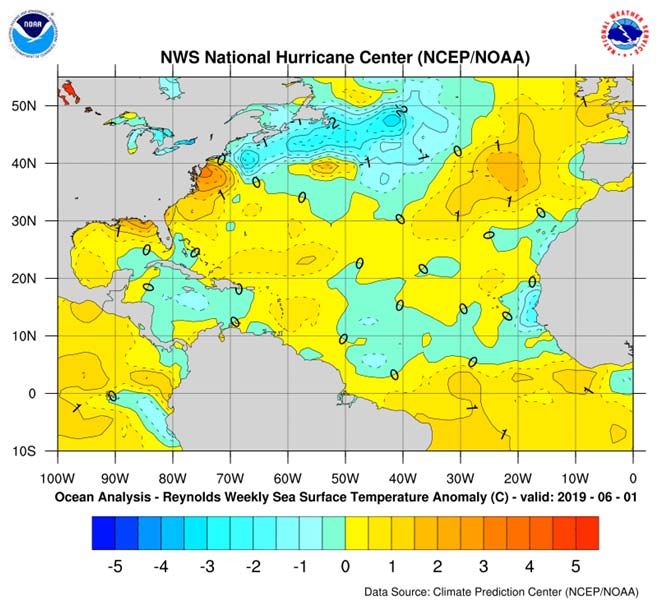
Climate signals: sea surface
temperatures
The formation and development of hurricanes is
highly dependent on the available energy in the
upper layers of the ocean. This is why ocean
temperatures are often used as a proxy for
available energy as a major factor in determining
seasonal activity. This year, waters across the
deep tropical North Atlantic are currently slightly
cooler than usual (Figure 1). However, NOAA
expects this cool anomaly to disappear for the
peak of the hurricane season.
Waters in the Gulf of Mexico and off the U.S. East
Coast are currently much warmer than normal.
Should this anomalous warmth persist it would
promote the development and maintenance of
‘homegrown’ hurricanes close to the U.S. coast. If
this occurs it would be a continuation of a shift of Figure 1. Departure of weekly average sea surface
temperature from a long-term average (°C) on June 1 2019.
activity away from the remote deep tropics and
Source: https://www.nhc.noaa.gov/tafb/atl_anom.gif:
closer to the U.S.
NCEP/NOAA
1 Accumulated Cyclone Energy (ACE) is a combined measure of hurricane intensity, duration and frequency. ACE is calculated as the sum of the square of the
maximum wind speed in each 6-hour period during the life of a tropical cyclone from the time it reaches tropical storm strength (wind speeds ≥ 65 kmph (39 mph)) in
units of 104; ACE = 10-4∑v2max, where v is measured in knots.
2 The CSU forecast includes named storm Andrea.
3 NOAA/CPC, TSR and NCSU forecast likely ranges rather than single values. The values presented here are the middle of the forecasted ranges.
2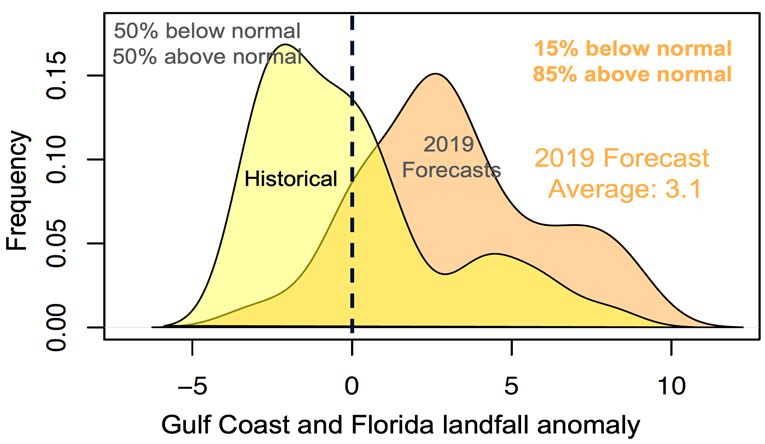
Climate signals: El Niño?
The cooling and warming of the equatorial
Pacific associated with El Niño Southern
Oscillation (ENSO) exerts the strongest
known control on Atlantic hurricane activity
by driving an overturning of the tropical
atmosphere; air rises over warm waters and
sinks over cool waters.

A weak El Niño emerged in late 2018 and
persists today. There is some uncertainty
whether this weak El Niño will endure into
the peak of the hurricane season, or
whether ENSO will slide into warm-neutral
conditions. The latest forecasts are about
evenly split on these two scenarios, with a
slight preference for continued weak El Niño
conditions (Figure 2).

Continued El Niño will damp down hurricane
activity by driving strong winds across the          Figure 2. The official CPC/IRI ENSO probability forecast, based on
Caribbean and the tropical North Atlantic.           a consensus of forecasters using human judgment and model
However, El Niño generally has less                  output.
influence over the Gulf of Mexico and off the        Source: International Research Institute for Climate and Society.
U.S. East Coast where the warmer-than-               Published May 20, 2019
normal waters may provide a breeding
ground for these homegrown storms.

New Experimental Landfall Forecasts for the Gulf of Mexico and Florida
Forecasting U.S. landfall is still an emerging science with much to learn about the drivers of hurricane landfall. The
challenge arises from the small number of historical events and the complex and highly sensitive interactions between
storm formation, track and coastal orientation that result in landfall.

The Willis Research Network has developed a new experimental landfall forecast product. This collaboration between the
National Center for Atmospheric Research and Willis Re is being tested for the first time this year and points to increased
likelihood of above average landfall activity for the Gulf Coast and Florida for 2019.

Our approach uses the predicted daily weather patterns to infer landfalling tropical cyclone activity. These weather
patterns are similar to weather maps seen in weather forecasts. They promote or inhibit landfall through their large-scale
wind patterns and also though surface pressure patterns that can sustain or weaken hurricane activity. Throughout the
hurricane season we tend to see repeating daily weather patterns. The more a favorable weather pattern repeats, the
higher the likelihood of a hurricane landfall. ENSO enters our forecasts through its control on the frequency of occurrence
of these weather patterns.

Our model predicted landfall rates compare favorably with historical observations (not shown), with a useful and
statistically significant correlation. Further details of the method and validation will be presented in a forthcoming
publication.

                                                               3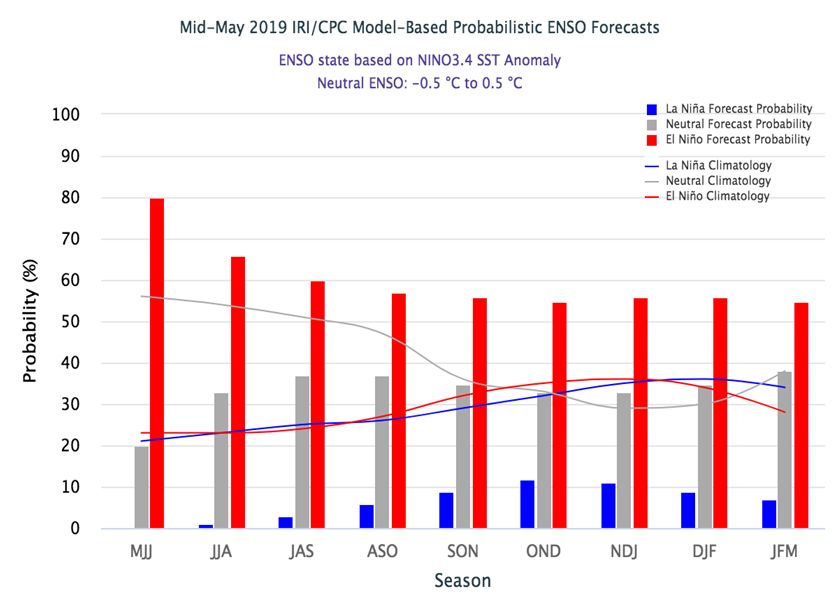
For the 2019 forecast, daily weather
patterns are taken from an ensemble of
dynamical model forecasts issued by
NOAA. Figure 3 shows the 2019 forecast
distribution of named storm landfall
anomalies compared to an historical
distribution. The forecast distribution is
shifted to the right of the historical
distribution, indicating increased likelihood
of above normal Gulf Coast and Florida
landfall activity for 2019. The forecast high
activity is due to a prediction of higher-than-
normal number of days of favorable weather
patterns.
                                                  Figure 3. Named storm landfall anomaly for the Gulf Coast and Florida.
                                                  The historical distribution is shown in yellow and the forecast
                                                  distribution for 2019 is shown in orange.

Confidence
The forecasts issued this early in the year tend to be relatively poor (all seasonal forecasts should be read with caution),
yet they generally outperform the standard benchmark of the so-called “persistence” forecast (a forecast of average
activity every year) and therefore provide useful guidance on likely scenarios. The reasons for the general low confidence
of actual numbers in these early forecasts are primarily uncertainty in the progression of ENSO, the timing and magnitude
of potential intra-seasonal variability, and also the range in the hurricane response to these conditions.

Summary
The latest forecasts for the 2019 hurricane season point to a quieter season than last year, but still point towards near
normal or slightly above normal activity. The main uncertainties are whether El Niño will persist and whether today’s
warmer-than-normal waters in the Gulf of Mexico and off the US East Coast will continue. We also note that while
forecasts for the North Atlantic are near-normal, forecasts for the East Pacific strongly point towards a very active season.
This would continue the run of active hurricane seasons for the region of Hawaii.

Next briefing and additional advice
This briefing will be updated late-June to include the latest round of seasonal forecasts. These forecasts are likely to offer
increased confidence as the predicted El Niño or neutral condition comes into focus. Further comments are provide in our
2019 Hurricane Season Webinar recording, available here – to view the recording, you will need to enter the password
WRe2019.

The Willis Re Analytics Team will report on all tropical storms and hurricanes in the North Atlantic and the Gulf of Mexico.
This includes briefings and updates to our clients during hurricane events. These will contain the latest information from
the National Hurricane Center, commentary on likely tracks and intensities and, when available, updates and modeling
guidance from the catastrophe modeling companies.

                                                              4
Forecast information sources
Klotzbach, P. J., Bell, M. M. and J. Jones: “Extended Range Forecast of Atlantic Seasonal Hurricane Activity and Landfall
Strike Probability for 2019”, June 4, 2019, Department of Atmospheric Science, Colorado State University, Fort Collins
CO, U.S.
Saunders, M. and A. Lea: “Pre-Season Forecast for North Atlantic Hurricane Activity in 2019”, May 30, 2019, Department
of Space and Climate Physics, University College London, London, U.K.
Contact us
Willis Research Network
Dr. James Done Geoff Saville Roy Cloutier
Willis Research Fellow WRN Senior Research Manager Executive Vice President, Willis Re
Capacity Center for Climate and Analytics Technology and Willis Research Catastrophe Analytics
Weather Extremes, National Center Network 8400 Normandale Lake Blvd. Suite 375
for Atmospheric Research 51 Lime Street, London, Minneapolis, MN 55437, U.S.
P.O. Box 3000, Boulder, CO, U.S. EC3M 7DQ. U.K. D: +1 952 841 6652
D: +1 303 497-8209 D: +44 203 1248858 E: roy.cloutier@willistowerswatson.com
E: done@ucar.edu E: geoffrey.saville@willistowerswatson.com
https://www.c3we.ucar.edu/c3we-staff
Willis Limited, Registered number: 181116 England and Wales.
Registered address: 51 Lime Street, London, EC3M 7DQ.
A Lloyd’s Broker. Authorised and regulated by the Financial Conduct Authority for its general insurance mediation activities only.
© Copyright 2019 Willis Limited / Willis Re Inc. All rights reserved: No part of this publication may be reproduced, disseminated, distributed, stored in a retrieval system, transmitted or otherwise transferred
in any form or by any means, whether electronic, mechanical, photocopying, recording, or otherwise, without the prior written permission of Willis Limited / Willis Re Inc. Some information contained in this
document may be compiled from third party sources and Willis Towers Watson (as defined below) does not guarantee and is not responsible for the accuracy of such. This document is for general
information only and is not intended to be relied upon. Any action based on or in connection with anything contained herein should be taken only after obtaining specific advice from independent
professional advisors of your choice. The views expressed in this document are not necessarily those of Willis Limited / Willis Re Inc., its parent companies, sister companies, subsidiaries or affiliates, Willis
Towers Watson PLC and all member companies thereof (hereinafter collectively, “Willis Towers Watson”). Willis Towers Watson is not responsible for the accuracy or completeness of the contents herein
and expressly disclaims any responsibility or liability, based on any legal theory, for damages in any form or amount, based upon, arising from or in connection with for the reader's application of any of the
contents herein to any analysis or other matter, or for any results or conclusions based upon, arising from or in connection with the contents herein, nor do the contents herein guarantee, and should not be
construed to guarantee, any particular result or outcome. Willis Towers Watson accepts no responsibility for the content or quality of any third party websites that are referenced.
The contents herein are provided for informational purposes only and do not constitute and should not be construed as professional advice. Any and all examples used herein are for illustrative purposes
only, are purely hypothetical in nature, and offered merely to describe concepts or ideas. They are not offered as solutions for actual issues or to produce specific results and are not to be relied upon. The
reader is cautioned to consult independent professional advisors of his/her choice and formulate independent conclusions and opinions regarding the subject matter discussed herein. Willis Towers Watson
is not responsible for the accuracy or completeness of the contents herein and expressly disclaims any responsibility or liability based on any legal theory or in any form or amount, based upon, arising from
or in connection with for the reader's application of any of the contents herein to any analysis or other matter, nor do the contents herein guarantee, and should not be construed to guarantee any particular
result or outcome.
5You can also read