2020 Atlantic Hurricane Season Outlook: July 16, 2020 - Willis ...
←
→
Page content transcription
If your browser does not render page correctly, please read the page content below

Catastrophe Analytics
      Briefing

2020 Atlantic Hurricane Season Outlook: July 16, 2020
As the hurricane season enters the months of peak activity, this briefing provides an
update on how the season appears to be shaping up.

Current situation
Early activity at the start of the season has continued over the past month. With 6 named storms (Arthur, Bertha,
Cristobal, Dolly, Edouard and Fay) the season is progressing at record pace. Tropical storm Fay was the earliest 6th
named storm on record by 12 days, and 56 days ahead of the typical date of the 6th named storm. The pace of this
season is even beating the highly active year of 2005. Conditions are clearly favorable for storm activity. However, not
one of these 6 named storms strengthened enough to become a hurricane. In fact, measuring the season by
Accumulated Cyclone Energy (a cumulative measure of the overall intensity and duration of all storms) this season is
pretty average so far. None of our 6 named storms to date formed in the deep tropical North Atlantic. This region was
closed off to hurricanes by the record-breaking African dust event that tracked all the way to the U.S. Now the dust has
cleared, what levels of hurricane activity can we expect?

Forecasts
Available forecasts from the major forecasting centers remain almost unanimous in calling for an active season, with
some forecasts pointing towards an extremely active season. Some forecasts have even nudged slightly higher than
their pre-season forecasts. An updated forecast summary from some of the major forecasting centers is presented in
(Table 1). We also highlight here a forecast issued by the University of Colorado Boulder based on a relatively new
forecasting technique that uses the relationship between the spatial distribution of thunderstorm activity over the African
continent and seasonal hurricane activity. Their forecast issued on June 2nd is consistent with other forecasts in calling
for above-average numbers of tropical storms with a range of 14 to 20.

The forecast numbers of named storms across the major forecasting centers fall within a range of 16 to 20 (compared
to an historical average of 12.1). For hurricanes the numbers fall within a range of 7.8 to 9.5 (compared to an historical
average number of 6.4), and for major hurricanes (Saffir-Simpson category 3-5) they range from 4 to 4.5 (compared
with an historical average of 2.7). In summary, forecasts are generally calling for activity levels at around 150% of the
long-term average across a number of hurricane metrics. Colorado State University (CSU) and Tropical Storm Risk also
issue guidance on landfall probability. Their latest forecasts again call for higher than normal landfall activity for the
continental U.S.

The forecast for favorable hurricane environments has not changed much from the early-season outlooks. However, we
now have greater confidence than we had at the beginning of the season. The major drivers of this season’s high
activity are i) expectation of continued cool conditions over the equatorial Pacific or possible emergence of a weak La
Niña, and ii) warmer than normal tropical North Atlantic Ocean temperatures.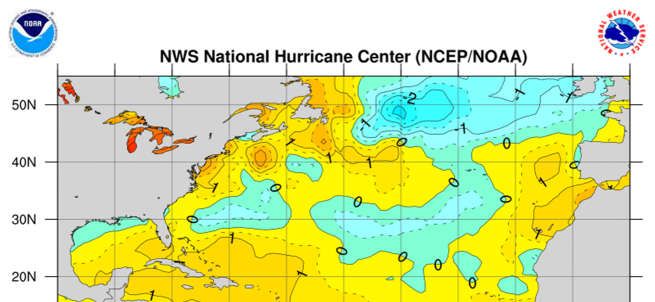
Atlantic seasonal hurricane forecasts as of July 15, 2020

  Table 1. Summary of 2020 Atlantic Seasonal Hurricane Forecasts
                                                                         # Named                                       # Major
                                                      Date                                      # Hurricanes                                   ACE1
  Data Source                                                            Storms                                        Hurricanes
                                                      Issued                                    (% of normal)                                  (% of normal)
                                                                         (% of normal)                                 (% of normal)

  1981-2010 average (Source CSU)                                                12.1                    6.4                     2.7                   106

  Average of 5 analog years (Source CSU)                 Jul 7, 2020         16 (132%)              7.8 (122%)              4 (148%)              160 (151%)

  Colorado State University2                             Jul 7, 2020         20 (165%)               9 (141%)               4 (148%)              160 (151%)

  NOAA/CPC3                                           May 21, 2020           16 (132%)               8 (125%)              4.5 (167%)             159 (150%)

  Tropical Storm Risk                                    Jul 7, 2020         18 (149%)               8 (125%)               4 (148%)              137 (129%)

  The Weather Company                                  Apr 16, 2020          18 (149%)               9 (141%)               4 (148%)                   n/a

  North Carolina State University3                     Apr 17, 2020          20 (165%)              9.5 (148%)              4 (148%)                   n/a

  Average of the all of the above                                            18 (149%)              8.6 (134%)             4.1 (152%)              154 (145%)

Analog years
An alternative view to forecast models is provided by hurricane activity in past years that had similar pre-season climate
conditions and forecast conditions to this year. CSU uses this approach to qualitatively correct the output from their
empirical forecast technique. CSU’s selected analog years – 1966, 1995, 2003, 2008, 2011, 2016 – are characterized
by cool neutral or weak La Niña conditions and slightly warmer than normal tropical North Atlantic sea surface
temperatures for the peak of the hurricane season. The average activity among these 6 analog years is shown in
Table 1 and indicates above normal numbers of named storms, hurricanes and major hurricanes, but slightly lower than
their official forecast.

1 Accumulated   Cyclone Energy (ACE) is a combined measure of hurricane intensity, duration and frequency. ACE is calculated as the sum of the square of the
maximum wind speed in each 6-hour period during the life of a tropical cyclone from the time it reaches tropical storm strength (wind speeds ≥ 65 kmph (39 mph)) in
units of 104; ACE = 10-4∑v2max, where v is measured in knots.
2 The CSU forecast includes named storms Arthur, Bertha, Cristobal, Dolly and Edouard.
3 NOAA/CPC and NCSU forecast likely ranges rather than single values. The values presented here are the middle of the forecasted ranges.

                                                                                2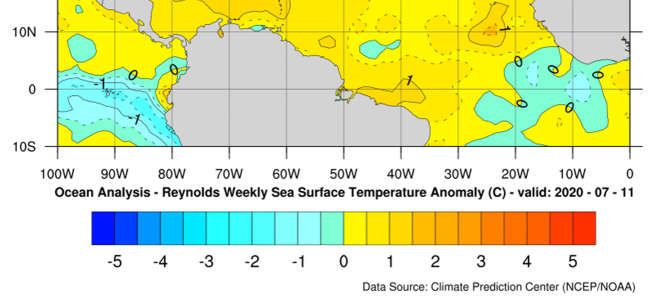
Climate signals: Ocean heat content and ocean surface temperatures
Ocean temperatures are used as a major
factor in determining seasonal activity.
This year, waters across almost the entire
tropical North Atlantic are currently warmer
than usual (Figure 1, top panel). Warmth
in the deep tropics creates favorable
conditions for storm formations from
African Easterly Waves – pulses of energy
in the atmosphere that track westward off
the coast of Africa. These formations are
known to produce almost all our strongest
hurricanes.

However, to sustain a strong hurricane the
ocean heat must extend down through the
top few hundred meters of the ocean. A
summary measure of this heat is known as
the Ocean Heat Content (OHC). Figure 1,
bottom panel shows that high OHC
extends across the main hurricane
breeding grounds.

The highest abnormal warmth extends
across parts of the Caribbean and into the
Gulf of Mexico. These departures from
normal, should they continue as expected,
are more than sufficient to raise hurricane
activity and promote ‘homegrown’
hurricanes close to the U.S. coast. Jeff
Masters’ Eye on the Storm blog post from
July 6, 2020 notes that the OHC in these
regions reached record levels during July
this year. He also noted that OHC this year
is very similar to the formidable 2005
season.

                                               Figure 1. (top panel) Departure of weekly average sea surface
                                               temperature from a long-term average (°C). (bottom panel) Ocean Heat
                                               Content (KJcm-2). Both images are on Jul 11 2020.
                                               Sources: https://www.nhc.noaa.gov/tafb/atl_anom.gif: NCEP/NOAA,
                                               and http://isotherm.rsmas.miami.edu/heat/weba/atlantic.php:
                                               University of Miami Rosenstiel School.

                                                           3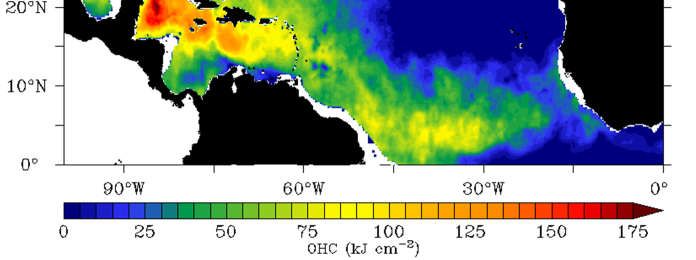
Climate signals: La Niña?
Our early-season outlook called for an
80% likelihood of cool neutral conditions or
La Niña phase of the El Niño Southern
Oscillation (ENSO, see below for an ENSO
explainer). During June, the central and
eastern equatorial Pacific continued to
cool. In response, the atmosphere is also
looking rather La Niña-like. The latest
round of predictions is consistent with
earlier predictions: Roughly half of the
dynamical models predict weak La Niña
conditions for the summer with most others
predicting neutral conditions (Figure 2).
The reluctance of the models to come into
agreement for La Niña is due, in part, to
the lack of a deep reservoir of cold sub-
surface water across the Pacific. There is a
stronger suggestion of a slide to La Niña
conditions as we enter the Autumn and
Winter. In response, NOAA recently issued      Figure 2. Recently observed and forecasted ENSO conditions, based
a La Niña Watch, which means that              on output from a collection of dynamical models. Source: Emily
forecasts favor the development of La Niña     Becker (NOAA/CPC)
within the next 6 months.

Explainer: El Niño Southern Oscillation (ENSO)
The sloshing back and forth of warm water across the equatorial Pacific associated with El Niño Southern Oscillation
(ENSO) exerts the strongest known control on Atlantic hurricane activity. The atmosphere responds with rising air
following the warm water across the Pacific. In turn, this shifts the entire global overturning circulation.

During El Niño, when warm waters slosh over to the central and eastern Pacific, the ascending air drives strong winds
aloft over the Western Atlantic. Such strong winds act to rip hurricanes apart. During La Niña, when warm waters slosh
over to the Western Pacific, these hostile winds aloft over the Atlantic dissipate, leaving favorable conditions for hurricane
activity.

Confidence
Forecasts issued in early to mid-July start to bring useful skill (all seasonal forecasts should be read with caution), and
therefore provide useful guidance on likely scenarios. The sources of enhanced skill arise from persistence of
temperature anomalies in the oceans and the fact we are past the April/May predictability barrier for ENSO.

Summary
The latest round of forecasts for the 2020 hurricane season indicates an active season. No forecasts call for an inactive
season. Things to watch as we enter the peak hurricane months of August and September are the potential emergence of
La Niña (strengthening the case for an active season), and the amount of Ocean Heat Content across the tropical North
Atlantic, Caribbean and Gulf of Mexico. The immediate next couple of weeks look to remain quiet across the North
Atlantic as we watch for the potential of a Madden Julian Oscillation event (a mode of sub-seasonal variability) to open a
window of more favorable atmospheric conditions.

                                                             4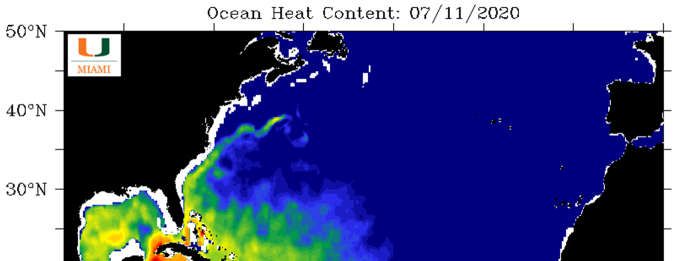
Additional advice
The Willis Re Analytics Team will report on all tropical storms and hurricanes in the North Atlantic and the Gulf of Mexico.
This includes briefings and updates to our clients during hurricane events. These will contain the latest information from
the National Hurricane Center, commentary on likely tracks and intensities and, when available, updates and modeling
guidance from the catastrophe modeling companies.

Information sources
Sam Lillo, @splillo, Phil Klotzbach, @philklotzbach
Becker, E. July 2020 ENSO update: La Niña Watch! Published July 9, 2020. Available at https://www.climate.gov/news-
features/blogs/enso/july-2020-enso-update-la-niña-watch

Klotzbach, P. J., Bell, M. M. and J. Jones: “Extended Range Forecast of Atlantic Seasonal Hurricane Activity and Landfall
Strike Probability for 2020”, July 7, 2020, Department of Atmospheric Science, Colorado State University, Fort Collins CO,
U.S.

Masters, J. Eye on the Storm blog, Yale Climate Connections. July 6, 2020. Available at:
https://www.yaleclimateconnections.org/2020/07/tropical-storm-edouard-is-fifth-named-storm-of-2020/

Saunders, M. and A. Lea: “July Forecast for North Atlantic Hurricane Activity in 2020”, Jul 7, 2020, Department of Space
and Climate Physics, University College London, London, U.K.

University of Colorado Boulder, Oceans and Climate Lab. 2020 Predictions. Available at:
https://www.colorado.edu/oclab/projects/atlantic-seasonal-hurricane-prediction/2020-predictions

Contact us
Willis Research Network
    Dr. James Done                                                      Geoff Saville                                                                 Roy Cloutier
    Willis Senior Academic Fellow                                       WRN Senior Research Manager                                                   Executive Vice President, Willis Re
    Capacity Center for Climate and                                     Analytics Technology and Willis Research                                      Catastrophe Analytics
       Weather Extremes,                                                  Network                                                                     8400 Normandale Lake Blvd
    National Center for Atmospheric                                     51 Lime Street, London,                                                       Minneapolis, MN 55437, U.S.
       Research                                                         EC3M 7DQ. U.K.                                                                T: +1 952 841 6652
    P.O. Box 3000, Boulder, CO, U.S.                                    D: +44 203 1248858                                                            E: roy.cloutier@willistowerswatson.com
    D: +1 303 497-8209                                                  E: geoffrey.saville@willistowerswatson.com
    E: done@ucar.edu
    https://www.c3we.ucar.edu/c3we-staff

 Willis Limited, Registered number: 181116 England and Wales.
 Registered address: 51 Lime Street, London, EC3M 7DQ.
 A Lloyd’s Broker. Authorised and regulated by the Financial Conduct Authority for its general insurance mediation activities only.

 © Copyright 2020 Willis Limited / Willis Re Inc. All rights reserved: No part of this publication may be reproduced, disseminated, distributed, stored in a retrieval system, transmitted or otherwise transferred
 in any form or by any means, whether electronic, mechanical, photocopying, recording, or otherwise, without the prior written permission of Willis Limited / Willis Re Inc. Some information contained in this
 document may be compiled from third party sources and Willis Towers Watson (as defined below) does not guarantee and is not responsible for the accuracy of such. This document is for general
 information only and is not intended to be relied upon. Any action based on or in connection with anything contained herein should be taken only after obtaining specific advice from independent
 professional advisors of your choice. The views expressed in this document are not necessarily those of Willis Limited / Willis Re Inc., its parent companies, sister companies, subsidiaries or affiliates, Willis
 Towers Watson PLC and all member companies thereof (hereinafter collectively, “Willis Towers Watson”). Willis Towers Watson is not responsible for the accuracy or completeness of the contents herein
 and expressly disclaims any responsibility or liability, based on any legal theory, for damages in any form or amount, based upon, arising from or in connection with for the reader's application of any of the
 contents herein to any analysis or other matter, or for any results or conclusions based upon, arising from or in connection with the contents herein, nor do the contents herein guarantee, and should not be
 construed to guarantee, any particular result or outcome. Willis Towers Watson accepts no responsibility for the content or quality of any third party websites that are referenced.

 The contents herein are provided for informational purposes only and do not constitute and should not be construed as professional advice. Any and all examples used herein are for illustrative purposes
 only, are purely hypothetical in nature, and offered merely to describe concepts or ideas. They are not offered as solutions for actual issues or to produce specific results and are not to be relied upon. The
 reader is cautioned to consult independent professional advisors of his/her choice and formulate independent conclusions and opinions regarding the subject matter discussed herein. Willis Towers Watson
 is not responsible for the accuracy or completeness of the contents herein and expressly disclaims any responsibility or liability based on any legal theory or in any form or amount, based upon, arising from
 or in connection with for the reader's application of any of the contents herein to any analysis or other matter, nor do the contents herein guarantee, and should not be construed to guarantee any particular

                                                                                                          5
You can also read