Clean Mobility Drives Metals Demand - Matthias Dohrn, Senior Vice President, BASF Precious & Base Metal Services Bank of America, Virtual ...

Page created by Gary Parker
 
CONTINUE READING
Clean Mobility Drives Metals Demand - Matthias Dohrn, Senior Vice President, BASF Precious & Base Metal Services Bank of America, Virtual ...
Clean Mobility Drives Metals Demand
                                                              Matthias Dohrn, Senior Vice President,
                                                              BASF Precious & Base Metal Services
                                                              Bank of America, Virtual Conference
                                                              November 10, 2020

1   November 10, 2020 I Clean Mobility Drives Metals Demand
Clean Mobility Drives Metals Demand - Matthias Dohrn, Senior Vice President, BASF Precious & Base Metal Services Bank of America, Virtual ...
Agenda

                                                              BASF – We Create Chemistry

                                                              BASF Catalysts Division Drives Sustainable Solutions

                                                              Precious Metals

                                                              Base Metals (Battery)

2   November 10, 2020 I Clean Mobility Drives Metals Demand
Clean Mobility Drives Metals Demand - Matthias Dohrn, Senior Vice President, BASF Precious & Base Metal Services Bank of America, Virtual ...
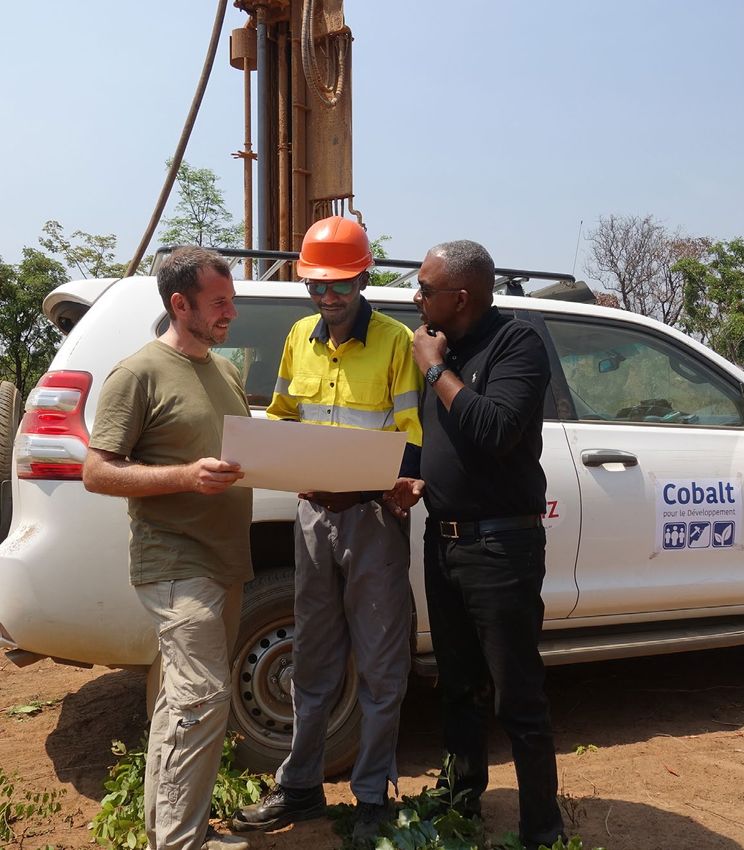
BASF – We create chemistry

 Our chemistry is used in almost all industries
 We combine economic success, social responsibility
     and environmental protection

 Sales 2019: €59.3 billion
 EBIT before special items 2019: €4.5 billion
 Employees (as of December 31, 2019): 117,628
 6 Verbund sites and 361 other production sites
 Around 100,000 customers from various sectors
     in almost every country in the world

3   November 10, 2020 I Clean Mobility Drives Metals Demand
Clean Mobility Drives Metals Demand - Matthias Dohrn, Senior Vice President, BASF Precious & Base Metal Services Bank of America, Virtual ...
BASF’s segments
Many of our segments and divisions supply the automotive industry

                                                                Surface
                                       Industrial             Technologies    Nutrition
                                       Solutions
                                                                 Catalysts,
                                                                 Coatings
                                                                               & Care
                                    Dispersions & Pigments,                   Care Chemicals,
                                    Performance Chemicals                     Nutrition & Health

                                                                                                   Agricultural
           Materials                                                                                Solutions
      Performance Materials,                                                                          Agricultural
            Monomers                                                                                   Solutions

Chemicals
Petrochemicals,
 Intermediates
                                                                                                                     Other

                                                               Verbund

4   November 10, 2020 I Clean Mobility Drives Metals Demand
Clean Mobility Drives Metals Demand - Matthias Dohrn, Senior Vice President, BASF Precious & Base Metal Services Bank of America, Virtual ...
Agenda

                                                              BASF – We Create Chemistry

                                                              BASF Catalysts Division Drives Sustainable Solutions

                                                              Precious Metals

                                                              Base Metals (Battery)

5   November 10, 2020 I Clean Mobility Drives Metals Demand
Clean Mobility Drives Metals Demand - Matthias Dohrn, Senior Vice President, BASF Precious & Base Metal Services Bank of America, Virtual ...
BASF Catalysts covers the whole value chain for catalysts
and battery materials production
       Precious metal                       Sourcing                        Production                   Catalyst / battery              Customer industries
    & base metal sources                    & trading                                                   material production

                                                                                                              Battery
            Primary                       PGM / Base
                                                                                                             materials /                                       e-Mobility
        sources (Mines)                     Trading                                                           fuel cell
                                           Iselin, London,
                                          Shanghai, Tokyo,                                                    Mobile                           Mobile
          Open market                         Moscow                                                         emissions                        emissions

         PGM / Base                                                        PGM / Base                         Process         Process
          Refining                                                           PMC*                             catalysts       industry

                                                                            Seneca, Rome,
          USA, Europe                                                         Shanghai

                                                                                                 Scrap
                                                                                               collectors

                                                                                              Black mass
                                                                                               collectors

6     November 10, 2020 I Clean Mobility Drives Metals Demand   * Precious Metal Chemicals Production
Primary sourcing of metals requires specific guardrails

 Enhanced sustainability in procurement management, including
     OECD Due Diligence Guidance for Responsible Sourcing of Minerals

 Dedicated task force and senior level committee
     to guide and decide on due-diligence action

 Comprehensive sustainability assessment tools through the chemical
     industry’s Together for Sustainability (TfS) initiative, including mining-
     specific audit commensurate with multi-stakeholder-based IRMA audit

 Participation in various topic-specific initiatives, e.g., “Cobalt for
     Development” (C4D) artisanal cobalt pilot mine in DRC, Global Battery
     Alliance (GBA), Responsible Minerals Alliance (RMI), International
     Platinum Group Metals Association (IPA), engagement in Atacama
     Lithium projects

7   November 10, 2020 I Clean Mobility Drives Metals Demand
PGMs from secondary sources are of increasing importance
to enable a circular economy with a lower CO2 footprint

                  Companies collect spent automotive
                  and chemical catalysts for recycling        1                              2   BASF recycles spent automotive and
                                                                                                 chemical catalysts to recover PGM

                                                                          Full loop

                                                              6                                  3
                                                                       Sustainable supply
              Automotive and chemical companies                         Global footprint            BASF uses the PGMs to produce
                        use and dispose catalysts                       Trusted partner             precious metal chemicals

                                                                  5                          4
            Automotive catalysts reduce vehicle tailpipe                                         BASF uses precious metal chemicals to produce
                 emissions and chemical catalysts more                                           new automotive and chemical catalysts
        efficiently produce fuels and chemical products

Recycling and recovery service for precious metal products provides a circular economy for which precious metal can be
reclaimed for use in producing fresh salts and solutions for industrial applications
 Recycled PGMs offer a sustainable and environmental benefit from end-of-life materials
 All of the recovered metal we generate is used to supply our mobile emissions catalyst and chemical and process catalyst businesses
 The auto catalyst recycling market is the second largest source of PGM supply and is expected to grow significantly in future years

8   November 10, 2020 I Clean Mobility Drives Metals Demand
Sustainable, low carbon mobility requires adoption of powertrains

Tightening emission regulations and technology advances to lead adoption

Conventional
Internal combustion
                                                  Hybrid
engine (ICE);
catalyst required                                 ICE and electric motor;              Battery
                                                  catalyst and battery
                                                  required                             Electric motor;
                                                                                       battery required
                                                                                                                          Fuel cell
                                                                               HEV
                                                                                                                          Electric motor
                                                                                                                          and hydrogen;
                                                                                                                          catalyst required

                        PGM loadings increasing                                                   Expanding                           Future
                   PGMs                                       PGMs / Base Metals                   Base Metals                         PGMs
       Platinum             Rhodium                    Platinum        Lithium           Lithium        Cobalt           Platinum         Iridium
       Palladium                                        Palladium       Nickel            Nickel         Manganese        Ruthenium
                                                         Rhodium         Cobalt
                                                                          Manganese

9   November 10, 2020 I Clean Mobility Drives Metals Demand
Agenda

                                                               BASF – We Create Chemistry

                                                               BASF Catalysts Division Drives Sustainable Solutions

                                                               Precious Metals

                                                               Base Metals (Battery)

10   November 10, 2020 I Clean Mobility Drives Metals Demand
Auto demand has developed into dominant demand driver for PGMs
PGM demand as a share of the automotive market

       100%

         80%
                                                                                                                          Palladium
         60%
                                                                                                                          Platinum
         40%                                                                                                              Rhodium

         20%

          0%
                          1980                          1990                           2000          2010   2019   2029

                       17%                          10%                            58%               69%    83%    88%

                       31%                          41%                            33%               38%    41%    50%

                           0%                       82%                            86%               78%    86%    90%
Percentages represent share of total yearly demand; 2029 includes Pt substitution in LDG catalysts

11   November 10, 2020 I Clean Mobility Drives Metals Demand         Source: BASF Market Insight
Tightening emission regulations are primary driver of metal demand

Timeline of current and future emission regulations
                                           2018                  2019                 2020               2021                2022            2023            2024              2025            2026              2027              2028                2029          2030
                                      Implemented Regulations                                                                    Set To Be Implemented                                                                          Anticipated Regulations
                      LD                                                                         US Tier 3
                                                                                                                                        CA LEV III
                      HDon                                              US2010 + CARB optional low NOx                                                    CA UL NOx Phase I (0.05g BSNOx FTP + LLC)                           CA UL NOx Phase II (0.02g BSNOx)
                                                                                                                                                                                                                                 EPA Clean Truck Initiative
           US
                                                                                                                                                                                   CARB Advanced Clean Truck Initiative (ZEV Mandate: 5% in 2025, 55% by 2035)
                      HDoff                                                                                         US Tier 4F
                                                                                                                           GHG Phase 2 N2O / CH4

                      LD                     Euro 6d tem p                          Euro 6d                  Euro 6d (all)                        Euro 6e CF=1.0                                                 Euro 7                                              Euro 8
                                                                                                                      CO2 95 g/km                                                                      CO2 81 g/km (-15%) vs. 2021                               -37.5% vs. 2021
                      HDon                                 Euro VI D                                                                                 Euro VI E                                                                              Euro VII
           EU
                                                                                                   HD CO2 review                                                                                              -15% vs. 2021                                      -30% vs. 2021
                      HDoff                       Stage IV                                                                                  Stage V

                      LD                           PL 5                                          PL 6                                         PL7                                           PL8 w / RDE
           Brazil     HDon                                             Euro V                                                    P8 / Euro VI

                      LD                           BS 4                               BS 6          CO2 113 g/km             BS 6         BS 6 w /RDE
                      HDon                         BS IV                                                BS VI                                                                  BS VI PEMS                                                              BS VII
           India
                      HDoff                                           TREM III                                                             TREM IV                                            TREM V

                      LD                                     NS 5                                                  NS 6a                                            NS 6b w /RDE                                                     NS 7
                      HDon                         NS V                           NS VIa (2020: 50% NG; 2021: 75% Urban; 2022: 100% All Diesel)                                   NS VIb (Full PEMS)                                                   NS VII
           China
                      HDoff                                           Stage III                                                                         Stage IV + PN (est.)

                      LD                          Euro 6c                                                                  Euro 6d                                             Euro 7
                      HDon                                 Euro VIc                                                          Euro VId w /PEMS                               Euro VII
           Korea
                      HDoff                                Global 4                                     Global 5

                      LD                                                                        2009 Post New Long Term
           Japan
                                                                                CO2 113 g/km                                                                               HDD GHG
                                           2018                  2019                 2020               2021                2022            2023            2024              2025            2026              2027              2028                2029          2030

     LD – Current             LD - set to be implemented                     LD - anticipated                                               HDoff – Current               HDoff - set to be implemented                       HDoff - anticipated
     HDon – Current           HDon - set to be implemented                   HDon - anticipated

12    November 10, 2020 I Clean Mobility Drives Metals Demand                                  Source: BASF Market Insight
Tighter regulations imply higher catalyst complexity

Increasing number of non-PGM catalyzed components in technology

                                2005                           2010   2015 - 2025

                                                                                    ▪   Real driving
     LDD                                                                                emissions testing

                                                                                    ▪   Worldwide harmonized
                                                                                        light vehicle test procedure

                                                                                    ▪   Advanced engine
     LDG                                                                                technologies
                                                                                        (multi-point injection,
                                                                                        turbocharge assisted,
                                                                                        lean burn, etc.)

                                                                                    ▪   Non-PGM components
     HDD                                                                                SCR, SCRoF,
                                                                                        SCRoF(V), SCR(Z)

13   November 10, 2020 I Clean Mobility Drives Metals Demand
Platinum market overview
Market surplus will persist through 2022 followed by declining output from South Africa and Pt substitution
in gasoline catalysts pushing the market to deficit position; high stock levels expected to keep price muted

Pt market supply 2020 (k toz)                                                                              Pt market demand 2020 (k toz)
                                                                                                                         15%
              27%                                                                                                                                                Autocat
                                                                        South Africa                                3%
                                                                                                                   3%                                            Jewelry
                                                                        Russia                                                                39%
                                                                                                                                                                 Chemical
                             6.8m toz            52%
                                                                        Zimbabwe                                 10%           5.8m toz
                                                                                                                                                                 Electrical
             5%                                                         North America
                                                                                                                                                                 Petroleum
                                                                        Recycling
              7%                                                   9%                                                                                            Other
                        9%                                                                                                     30%

Pt market balance forecast (k toz)*                                                                        Platinum missing out on the precious metals rally:
     1,165                    1,251                                                                        ▪   South African Pt supply severely impacted by COVID-19; to break
                  972                                                                                          below 4m toz by 2025 led by production cuts and mine depletion
                                         629
                                                                                                               – Elevated Pd and Rh prices delaying mine closures in South Africa
                                                                                                           ▪   Substantial surplus balances through 2022 due to:
                                                       -68                             -2,729                  – Automotive demand to decline again in 2020
                                                                 -626                                          – Light-duty diesel production declined 67% Q2 2020 vs. Q2 2019 in the EU
                                                                                                               – Chinese Pt jewelry market continues to decline
                                                                             -1,757                        ▪   Ample above ground stocks and investment holdings (~17m toz)
     2019         2020         2021     2022        2023         2024        2029                              to alleviate potential future market deficits
* Demand includes Pt substituted LDG catalysts beginning 2021 which will spur demand

14    November 10, 2020 I Clean Mobility Drives Metals Demand     Source: BASF, SFA Oxford, Metals Focus
Palladium market overview
Weak automotive outlook for 2020/2021 due to COVID-19 weighing heavy on demand; mid to long-term forecasted
Pt/Pd substitution in LDG and possible supply from announced Pd-rich mine projects

Pd market supply 2020 (k toz)                                                              Pd market demand 2020 (k toz)
                                                                                                                4%
                                                                                                          8%
                                           22%                                                       5%
             31%
                                                                       South Africa                                                               Autocat
                                                                                                   2%
                                                                       Russia                                                                     Jewelry
                        8.9m toz                                       Zimbabwe                                8.8m toz                           Chemical

                                                                       North America                                                              Electrical

                                                                       Recycling                                                                  Other
              12%                           31%                  9%                                                         81%

                        4%

Pd market balance forecast (k toz)                                                         Palladium price rallying despite market surplus
                                                                            851            ▪   2020 marks the first market surplus forecasted since 2010
                                                                                           ▪   Delays in Pd-rich mining projects due to COVID-19
                                                                                   +737
                             317                                                           ▪   Weak automotive sales continues to impact demand
                 114
                                                                                           ▪   Positive signs emerging as China auto market (largest gasoline market)
                                                                -64                            rebounds, with sales above 2019 for April – July 2020
                                                    -340                                   ▪   Higher Pd loadings on autocats due to tighter emission regulations
     -586                               -581                                               ▪   Pt substituted LDG catalysts to lessen future Pd demand
     2019       2020         2021       2022        2023        2024        2029

15    November 10, 2020 I Clean Mobility Drives Metals Demand   Source: BASF, SFA Oxford
Rhodium market overview
Market remains tight driven by the recovery in Chinese automotive production and reduction of output
from South Africa due to COVID-19 shutdown; severe shortages of rhodium projected in the future

Rh market supply 2020 (k toz)                                                             Rh market demand 2020 (k toz)
                                                                                                            7%

            31%                                                                                       8%
                                                                      South Africa                                                              Autocat

                                                                      Russia                                                                    Chemical
                        0.9m toz                                      Zimbabwe                              0.9m toz                            Other
                                               54%
                                                                      North America
            2%
                                                                      Recycling
             5%                                                 9%
                   8%                                                                                                     85%

Rh market balance forecast (k toz)                                                        Rhodium market deficits to remain through FC period
                                                                                          ▪   South African Rh supply severely impacted by COVID-19 (-22% YoY)
                                                                                          ▪   South African supply expected to decline over the forecast period as
                -47
     -86                                                                                      conventional mines begin to shutter
                           -162                                                   -351    ▪   Higher Rh loadings on autocatalysts due to tighter emission regulations
                                                                                              – Continued gain in LDG market share at the expense of LDD
                                       -335        -342
                                                                                          ▪   Rh has higher activity for NOx reduction compared to Pt and Pd
                                                                                              making it difficult to substitute in an autocatalyst
                                                               -411        -398
     2019      2020        2021        2022       2023         2024        2029

16   November 10, 2020 I Clean Mobility Drives Metals Demand   Source: BASF, SFA Oxford
Hydrogen economy: Decarbonizing industry/transport offers long-term
PGM demand growth from electrocatalysts for hydrogen applications

         Hydrogen                   Ir      Pt                                                               Pt        Pd       Ru                       Pt   Ru     Ir
                                                                                 Distribution                                              End uses
         generation

                                                                                                                                                FCEV
                                                                                                                                                              FCEV
                                                                           LOHC*                         LOHC* Pt
                                                                           production                    conversion
                                                                                                                                      H2        Fertilizer
                                                                                                                                                Steel
         Electrolyzers
                                                  H2
         for H2 production
                                                                                                                                                Green
                                                                                                                                                syngas

                                                                                                                                                Heat /
                                                                                                                                                Power
        Even a moderate emergence of the hydrogen economy could already consume a
        significant portion of today’s Pt and Ir production.

                                                               * Liquid organic hydrogen carriers (LOHC) are organic compounds that
17   November 10, 2020 I Clean Mobility Drives Metals Demand     can absorb and release hydrogen through chemical reactions
Agenda

                                                               BASF – We Create Chemistry

                                                               BASF Catalysts Division Drives Sustainable Solutions

                                                               Precious Metals

                                                               Base Metals (Battery)

18   November 10, 2020 I Clean Mobility Drives Metals Demand
EV forecast will have a major impact on Ni and Co demand
for lithium-ion batteries
EV forecast comparison BEV plus PHEV                                                                Ni and Co demand sensitivity to EV forecast in 2030
(million vehicles)                                                                                  (kt)

                                                                               39                                                                  +54%
40                                                                                                  1,500

                                                                                         >20
                                                                               31
30                                                                                  28                             +59%
                                                                                          million   1,000
                                                                                         vehicles
20                                                                             17
                                          12
                                                                                                     500
10
                                                                                                                                                   +36%
                                                                                                                   +33%
       3                                    8
 0                                                                                                     0
      2020          2022           2024          2026          2028           2030                      15m           20m         25m        30m          35m         40m   EV sales

                                                                                                            WoodMac                 BASF                        Bernstein
           Bernstein        Benchmark           BNEF
           WoodMac          LMCA                BASF                                                          2030 NiSO4 demand     2030 CoSO4 demand

 Broad range of opinions on policy impact, infrastructure challenges, total cost of ownership parity, range anxiety, and consumer preferences
 Cobalt is less sensitive due to its position in consumer electronics market and deemphasis in EV applications
Consensus of 8-12 million EVs by 2025, but 2030 deviates by >20 million vehicles

19   November 10, 2020 I Clean Mobility Drives Metals Demand   Source: BASF Market Insight
Shift towards high-Ni CAM will spur demand for nickel
at the expense of cobalt
Chemistry mix forecast                                                                                      Typical metal content
(%)                                                                                                         (% CAM)

100%                                                                                                                                         48%
                                                                                                            NCM 811
                                                                                              LFP/LMO                  6%
90%
                                                                                                                                       36%
                                                                                              LCO           NCM 622
80%                                                                                                                        12%
                                                                                                                                 20%                                      Ni       Co
70%                                                                                                         NCM 111
                                                                                              NCA                                20%
                                                                                                                      0%
60%                                                                                                             LCO
                                                                                              Low-Ni NCM                                           60%
50%                                                                                                         LFP and   0%
                                                                                              Mid-Ni NCM
                                                                                                               LMO    0%
40%                                                                                                                                             54%
                                                                                                                NCA
                                                                                                                      5%
30%

20%                                                                                           High-Ni NCM
                                                                                                               High-Ni CAM will result in higher energy density leading to increased
10%                                                                                                             performance and range
                                                                                              Other
     0%
                                                                                                               China will dominate production for LFP driven by demand from
            2016      2018       2020       2022       2024     2026       2028       2030                      auto producers while vast majority of NCA will derive from Japan

High-Ni NCM expected to become the dominant battery technology,
impacted in the short-term by LFP
20    November 10, 2020 I Clean Mobility Drives Metals Demand   Source: BASF Market Insight
Nickel market overview
Use of nickel within Li batteries to increase as cell manufacturers continue technology shift toward high-nickel
cathode chemistries to increase vehicle range and battery energy-density

Ni market supply 2020 (kt)                                                         Class 1 vs. class 2 Ni supply 2020                                    Ni market demand 2020 (kt)
                                                                                                                                                                     5%

                                                          Indonesia                                                                                      26%
                                      29%
                                                          Philippines                                                 48%
38%
                                                                                                                                   Class 1                                                Battery
                                                          New Caledonia
                2,313 kt                                                                                                           Class 2                      2,292 kt                  Stainless steel
                                                          Russia
                                                                                                                                                                                          Other
                                                          Other                   52%

                                     15%
                                                     9%
                                                                                                                                                                            69%
          9%
                      9%

Class 1 Ni supply / demand (kt)*                                                                                 Class 1 nickel market expected to face a deficit 2026
4,000           Demand forecast total (class 1)                                                                     Demand from the EV sector expected to triple by 2025 and exceed
                Demand forecast battery                                                                              950 kt by the end of the forecast
                Supply deficit
3,000                                                                     Forecasted deficits                       Expect BEVs to utilize >55% of high-Ni battery chemistry by 2030
                Flexible class 1 supply
                Current supply (nameplate capacity)                                                                 Majority of supply growth will be from class 2 nickel as a result of
2,000                                                                                                                Nickel Pig Iron (NPI) producing mines in the Philippines and Indonesia
                                                                                                                    Innovations in HPAL nickel refining have the potential to meet class 1
1,000
                                                                                                                     nickel demand from batteries by the mid-2020s

     0
           2019 2020 2021 2022 2023 2024 2025 2026 2027 2028 2029 2030

* Supply includes flexible supply of class 1 nickel (~300 kt)

21   November 10, 2020 I Clean Mobility Drives Metals Demand            Source: BASF Market Insights, Wood Mackenzie, Benchmark Minerals, BloombergNEF
Cobalt market overview
Cobalt contained in high-nickel cathode chemistry batteries still implies a significant growth trajectory,
with cobalt demand from Li batteries forecasted to grow by over three times by 2030

Co market supply 2020 (kt)                                                                                     Co market demand 2020 (kt)
                            7%

                   9%                                                      Africa                                                                                         Battery
                                                                                                                        33%
               3%                                                          Russia                                                                                         Superalloys
                                                                                                                                                       37%
              2%
              4%                                                           Indonesia                                                                                      Hard materials
                                 120 kt                                                                                               89 kt
                                                                           North America                                                                                  Catalysts

                                                                           Other                                                                                          Other
                                                 75%                  9% Recycling                                        6%

                                                                                                                                8%               16%

Co supply / demand (kt)                                                                                        Cobalt to shift to a deficit position beginning in 2028,
500                                                                                                            driven by continued growth from batteries
                                                                                 Forecasted deficits
                Demand forecast total
                Demand forecast battery
                                                                                                                  Cobalt has two innate properties that make it ideal for battery applications:
400                                                                                                                thermal stability and high energy density
                Supply deficit
300             Current supply (nameplate capacity)                                                               DRC expected to account for ~70% of the global cobalt mined in 2020

200
                                                                                                                  Artisanal miners in the DRC account for an estimated 15% of global
                                                                                                                   cobalt supply
100                                                                                                               Demand forecasted to grow by 12% CAGR through 2030 propelled
                                                                                                                   by battery
     0
           2019    2020   2021     2022   2023    2024   2025      2026   2027   2028   2029   2030

22       November 10, 2020 I Clean Mobility Drives Metals Demand      Source: BASF Market Insights, Wood Mackenzie, Benchmark Minerals, BloombergNEF
Summary

                                   Evolution of new powertrain concepts and transformation of the automotive industry in full swing
Market                             Automotive industry being driven by tightening emission regulations and lower CO2 footprint
                                   Strong growth momentum projected for battery electric vehicles (BEVs) and hybrids

                                   Precious and base metals are vital to achieving the performance and needs of the automotive industry
Performance                        Electromobility creates opportunity for BASF; positioned to secure demand for emissions catalysts
                                   BASF poised to enhance clean mobility through sustainably sourced metals

                                   BASF is well positioned with its metal recycling and relationships with mines to support clean mobility
BASF’s                             Largest chemical supplier to automotive industry, unparalleled access and market knowledge
competitive                        Market leader in mobile emissions catalysts and battery materials with a strong technology position
advantage                          Global presence and regional R&D and production capabilities
                                   Financial power to grow asset base and capitalize on market trends

23   November 10, 2020 I Clean Mobility Drives Metals Demand
You can also read