COMPARATIVE STUDY OF INDIAN STOCK EXCHANGES WITH INTERNATIONAL STOCK EXCHANGES - IJCRT
←
→
Page content transcription
If your browser does not render page correctly, please read the page content below
www.ijcrt.org                            © 2021 IJCRT | Volume 9, Issue 2 February 2021 | ISSN: 2320-2882

  COMPARATIVE STUDY OF INDIAN STOCK
    EXCHANGES WITH INTERNATIONAL
          STOCK EXCHANGES
                                            KARTIKEY RANA

                                             ROBIN SINGH

                                            SAHIL THAKUR

                                            AASTHA GUPTA

                            Student, Lovely Professional University.

ABSTRACT
Indian Stock Market at Global Stage holds a predominant place in world’s economy. Bombay Stock
Exchange and National Stock Exchange are two stock exchanges with advance technologies. Globally
India’s stock Exchange holds a great significance when it comes to comparison of all stock exchanges. In
this research paper we will compare major world’s stock exchange in terms of both qualitative and
quantitative terms. The stock market is witnessing heightened activities and is increasingly gaining
importance. In the current context of globalization and the subsequent integration of the global markets
this paper captures the trends, similarities and patterns in the activities and movements of the Indian
Stock Market in comparison to its international counterparts. This study covers New York Stock Exchange
(NYSE), Hong Kong Stock exchange (HSE), Tokyo Stock exchange (TSE), from various socio politico-
economic backgrounds. Both the Bombay Stock exchange (BSE) and the National Stock Exchange of
Indian Limited (NSE) have been used in the study as a part of Indian Stock Market. The time period has
been divided into various eras to test the correlation between the various exchanges to prove that the
Indian markets have become more integrated with its global counterparts and its reaction are in tandem
with that are seen globally.

INTRODUCTION
Stock market of any country is considered a market parameter of the country’s economy. It acts as a
bridge in procuring funds from the interested investors and therefore the same is employed for the aim
of commercial growth which successively leads to corporate growth.In terms of growth measurement of
stock market, the index is used as proxy to determine the level of the growth over the period of the
years. Normally stock market indices show ups and downs with reference to their movement due to the
price fluctuation and the price of the script is operated under market condition i.e. demand and supply
   IJCRT2102461     International Journal of Creative Research Thoughts (IJCRT) www.ijcrt.org   3874
www.ijcrt.org                             © 2021 IJCRT | Volume 9, Issue 2 February 2021 | ISSN: 2320-2882
factors. As long as the influx of investment is at the larger extent, the indices of the stock market react
positively showing upward trend. The stock market is one of the most vital components of a free-market
economy, as it provides companies with access to capital in exchange for giving investors a slice of
ownership in the company. The stock market makes it possible to grow small initial sums of money into
large ones, and to become wealthy without taking the risk of starting a business or making the sacrifices
that often accompany a high-paying career.
Stock Market integration is usually perceived as a true barometer for the economic growth. This
integration is due to globalization and liberalization. With financial integration, emerging economies have
become increasing attractive place for the portfolio investors who generally seek marginal amount of
return than what available in other developed countries. There are several benefits related to financial
integration like real price discovery, market efficiency, higher savings and investments, low transaction
costs which would cause overall economic development.

STOCK MARKET OF INDIA

Focusing now on the Indian stock market, most of the trading in the Indian Stock Market takes place on
its two stock exchanges: the Bombay Stock Exchange (BSE) and the National Stock Exchange (NSE). The
BSE has been in existence since 1875 and has about 4700 listed firms whereas NSE was founded in 1992
and began trading in 1994 and has about 1900 listed firms. The two prominent Indian market indexes are
Sensex and Nifty. Sensex is the oldest market index for the equities; it includes shares of 30 firms listed
on the BSE, which represent about 47% of the index's free-float market capitalization. It was created in
1986 and provides time series data from April 1979, onward.The Indian stock market is the engines that
drive the vehicle of Indian economy by generating much capital needed. The Indian stock market is one of
the most developed markets in the world. The origin of Indian stock market in India can be traced to the
later part of the Eighteenth century. It is one of the oldest and fastest growing in the world.

RELATIONSHIP BETWEEN INTERNATIONAL AND INDIAN STOCK EXCHANGE.

The study pertains to comparative analysis of the Indian Stock Market with respect to various
international counterparts. Exchanges are now crossing national boundaries to extend their service areas
and this has led to cross-border integration. Also, exchanges have begun to offer cross-border trading to
facilitate overseas investment options for investors. This not only increased the appeal of the exchange
for investors but also attracts more volume.

Exchanges regularly solicit companies outside their home territory and encourage them to list on their
exchange and global competition has put pressure on corporations to seek capital outside their home
country. The Indian stock market is the world third largest stock market on the basis of investor base and
has a collective pool of about 20 million investors. There are over 9,000 companies listed on the stock
exchanges of the country. The Bombay Stock Exchange, established in 1875, is the oldest in Asia. National
Stock Exchange, a more recent establishment which came into existence in 1992, is the largest and most
advanced stock market in India is also the third biggest stock exchange in Asia in terms of transactions. It
is among the five biggest stock exchanges within the world in terms of transactions volume.

Presently, the fluctuations within the Indian market are attributed heavily to cross border capital flows in
the form of FDI, FII and to reaction of Indian market to global market cues. In this context, understanding
the relationship and influence of various exchanges on each other is very important. This study compares
global exchanges which are from different geo politico- socio-economic areas. With the cross-border
movements of capital like never before in the form of FDI and FII, coupled with the easing of restrictions
bringing various stock exchanges at par in terms of system and regulations, it can be assumed
reasonablythat a particular stock exchange will have some impact on different exchanges.
   IJCRT2102461      International Journal of Creative Research Thoughts (IJCRT) www.ijcrt.org    3875
www.ijcrt.org                             © 2021 IJCRT | Volume 9, Issue 2 February 2021 | ISSN: 2320-2882
   LITERARTURE REVIEW
   Arumugam and Soundararajan (2013) investigated the seasonality and time varying volatility in the
   Indian stock markets. The Chi-square and ANOVA statistical test were applied to obtain the results. The
   study concluded that there was seasonality and volatilityin the days of the week and months of the year.

   Chander and Kumar (2016) studied the Seasonality Effect in BSE SENSEX. The secondary data was used
   from daily closing prices of BSE SENSEX from 1st April 2005 to 31st March 2015. Descriptive statistics
   were used to complied the data. The paper suggested that BSE SENSEX in India was not free from
   seasonal anomalies despite increased use of advanced information technology and numerous regulatory
   frameworks.

   Pathak Manish (2013) highlighted the stock market seasonality effect. The secondary data used in the
   study were collected from closing prices of the NSE index during the period from 1st april 2002 to 31st
   March 2012. Kruskal Walis test and one-way ANOVA test were used toachieve the objective. The result of
   this study revealed that there was no seasonality present in the daily and monthly return of the market.

   Rajput et al. (2013) focused the futures trading and its impact on volatility of Indian stock market. Bi-
   Variate EGARCH and Unit root technique were used to fetch the results. The paper found the uni-
   directional relationship between future trading and spot market. Finally, the study concluded that spot
   and future market were improve the riskmanagement and investment decision of the agent.

   OBJECTIVE OF THE STUDY
(1) To evaluate the closing prices of the index of BSE and NSE and find out therelationship between them.

(2) To analyze the movement of Indian stock exchanges with International stockexchanges.

(3) To explore the relationship between Indian stock exchanges and International stockexchanges.
   RESEARCH METHODOLOGY

   The method of collecting the data used here is the secondary. The above listed and the following data is
   available on the various stock exchanges of the different countries. In this research paper we are covering
   nine major stock exchanges for 10 years data from 2009- 2019. The following is table of stock exchange of
   nine global stock exchanges with their major Index.

      IJCRT2102461     International Journal of Creative Research Thoughts (IJCRT) www.ijcrt.org    3876
www.ijcrt.org © 2021 IJCRT | Volume 9, Issue 2 February 2021 | ISSN: 2320-2882
ANALYSIS AND INTERPRETATION
Descriptive Statistics
Mean Std. Deviation N
BSE 24710.283595 7896.7721852 132
NSE 7471.367804 2398.4745150 132
TSE 13740.949257 1896.5065563 132
NYSE 9846.400435 2264.3891103 132
SSE 2780.679278 511.1054436 132
HSE 174.913258 53.1258086 132
LSE 2303.763789 1704.2111924 132
ASE 5200.025779 760.3252891 132
TOSE 13740.949257 1896.5065563 132
Correlations
BSE NSE
BSE Pearson Correlation 1 .999**
Sig. (2-tailed) .000
N 132 132
NSE Pearson Correlation .999** 1
Sig. (2-tailed) .000
N 132 132
**. Correlation is significant at the 0.01 level (2-tailed).
Here, we have observed that is a high correlation between the BSE and NSE data figures. It means that
whenever stocks in the BSE were positive, the stocks in the NSE were positive too. In other words,
whenever stocks in the BSE were negative, the stocks in the NSE were negative.
Correlation between NSE and BSE is 0.999 that is highly correlated with each other.
IJCRT2102461 International Journal of Creative Research Thoughts (IJCRT) www.ijcrt.org 3877www.ijcrt.org © 2021 IJCRT | Volume 9, Issue 2 February 2021 | ISSN: 2320-2882
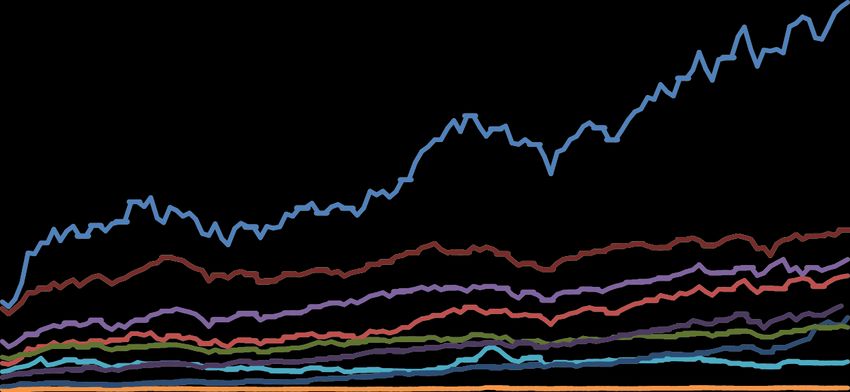
10 stock exchanges yearly chart
45000
40000
35000
30000
25000
20000
15000
10000
5000
0
BSE NSE TSE NYSE SSE HSE LSE TSX ASE NASDAQ
1/1/2009
5/1/2009
9/1/2009
1/1/2010
5/1/2010
9/1/2010
1/1/2011
5/1/2011
9/1/2011
1/1/2012
5/1/2012
9/1/2012
1/1/2013
5/1/2013
9/1/2013
1/1/2014
5/1/2014
9/1/2014
1/1/2015
5/1/2015
9/1/2015
1/1/2016
5/1/2016
9/1/2016
1/1/2017
5/1/2017
9/1/2017
1/1/2018
5/1/2018
9/1/2018
1/1/2019
5/1/2019
9/1/2019
The comparative analysis of the Stock Indices of the world’s top Stock Exchanges has been presented in
the above graphical representation. The top position is of BSE, TSX and NYSE. The current lowest position
is of SSE, LSE, TSE, ASE, HSE, NSE, and NASDAQ.
In the above Fig, the TEN stock exchanges have moved in a narrow range. The volatility is much higher in
the BSE than in the other 9 stock exchanges. There seemed to be low connectivity between the 10
exchanges. The Bombay stock exchange had seen a good growth year by year. But at the same time,
other 9 stock exchanges did not show so much variation as shown by Bombay stock exchange. BSE shows
a very good growth from year 2014 as it increases sharply and from year 2014 it keeps on increasing but
fall down a littlein 2016 for a while and then again jumps back to upward direction and the never fall that
much. TSX is also at top position but moved in a very narrow range. As we can see TSX did not go much
higher but also didn’t fall and was holding a neutral position in a chart and not shown much variations as
shown by BSE and on the other 8 stock exchanges did not showso much variations.
IJCRT2102461 International Journal of Creative Research Thoughts (IJCRT) www.ijcrt.org 3878www.ijcrt.org © 2021 IJCRT | Volume 9, Issue 2 February 2021 | ISSN: 2320-2882
REGRESSION
Model Summary
Std. Error of the
Model R R Square Adjusted R Square Estimate
1 .999a .999 .999 250.0530083
a. Predictors: (Constant), NASDAQ, SSE, TOSE, HSE, ASE, NSE, NYSE, LSE
This table provides the R and R2 values. The R value represents the simple correlation and is 0.999 (the
"R" Column), which indicates a high degree of correlation. The R2 value (the "R Square" column) indicates
how much of the total variation in the dependent variable, Price can be explained by the independent
variable, Income. In this case, 99.9% can be explained, which is very large.
R denotes the correlation between predicted and observed stock exchanges. In our case, R = 0.99. Since
this is a very high correlation, our model predicts stock exchanges rather precisely.
r square is simply the square of R. It indicates the proportion of variance in various stock exchanges that
can be “explained” by our three predictors.
Because regression maximizes R square for our sample, it will be somewhat lower for the entire
population, a phenomenon known as shrinkage. The adjusted r-square estimates the population R
square for our model and thus gives a more realistic indication of its predictive power.
The next table is the ANOVA table, which reports how well the regression equation fits the data (i.e.,
predicts the dependent variable) and is shown below:
ANOVAa
Model Sum of Squares df Mean Square F Sig.
1 Regression 5860625754.83 8 732578219.354 11716.283 .000b
0
Residual 7065495.284 113 62526.507
Total 5867691250.11 121
4
a. Dependent Variable: BSE
b. Predictors: (Constant), NASDAQ, SSE, TOSE, HSE, ASE, NSE, NYSE, LSE
This table indicates that the regression model predicts the dependent variable significantly well. Look at
the "Regression" row and go to the "Sig." column. This indicates the statistical significance of the
regression model that was run. Here, p < 0.0005, which is less than 0.05, and indicates that, overall, the
regression model statistically significantly predicts the outcome variable (i.e., it is a good fit for the data).
IJCRT2102461 International Journal of Creative Research Thoughts (IJCRT) www.ijcrt.org 3879www.ijcrt.org © 2021 IJCRT | Volume 9, Issue 2 February 2021 | ISSN: 2320-2882
a
Coefficients
Standardized
Unstandardized Coefficients Coefficients
Model B Std. Error Beta t Sig.
1 (Constant) 34.757 333.910 .104 .917
NSE 3.315 .064 1.025 52.049 .000
NYSE .047 .071 .014 .663 .509
SSE -.495 .088 -.038 -5.604 .000
HSE 6.303 1.440 .045 4.376 .000
LSE -.131 .136 -.024 -.965 .337
TOSE -.135 .049 -.035 -2.758 .007
ASE .533 .131 .051 4.066 .000
NASDAQ -.214 .121 -.055 -1.774 .079
a. Dependent Variable: BSE
The Coefficients table provides us with the necessary information to predict price from income, as well as
determine whether income contributes statistically significantly to the model (by looking at the "Sig."
column). Furthermore, we can use the values in the "B" column under the "Unstandardized Coefficients"
column.
The column “Sig.” holds the p-values for our predictors. As a rule of thumb, we say that a b coefficient is
statistically significant if its p-value is smaller than 0.05. All of our b coefficients are not statistically
significant as there are values which are greater than 0.05.
The beta coefficients allow us to compare the relative strengths of our predictors. NSE is contributing
significantly with SSE, HSE, BSE and have an impact on stock market. Whereas NYSE, LSE, NASDQ have no
impact on Indian Stock market.
CONCLUSION
The results of this study strongly support the view that, there is a substantial integration between Indian
and International financial markets. BSE has witnessed a greater fluctuation which has been indicated by
a very high Co-efficient of variation compared to other select indices. BSE, the Indian bench mark index,
has shown strong association with China, Japan and Taiwan’s Composite Index. The study reveals that,
there is a poor integration of BSE with SSE, LSE, TSE, ASE, HSE, NSE, and NASDAQ and. Indian stock
market exhibited strong positive correlation and perfect price correlation with global stock markets. In
Asia pacific region, when compared to Hang Kong, correlation of the Indian market with global markets is
not so attractive.
The study conclude that Indian stock market which has linked with stock markets of all the countries is
globally integrated over the next 10-15 years, need to move towards far greater integrated global
financial world and policy maker in India need to rethink the framework for such integration.
IJCRT2102461 International Journal of Creative Research Thoughts (IJCRT) www.ijcrt.org 3880www.ijcrt.org © 2021 IJCRT | Volume 9, Issue 2 February 2021 | ISSN: 2320-2882
REFRERENCE
http://www.bseindia.com/
https://www.nseindia.com/
http://www.world-stock-exchanges.net
COMPARING GLOBAL STOCK EXCHANGES - Stock Market Listing Standards and Fees.Retrieved 12
September 2017, fromhttp://www.ey.com/Publication/vwLUAssets/Comparing-global-stock-
exchangesEng/$FILE/Comparing-global-stock-exchanges-Eng.pdf
Gupta, N., & Agarwal, D. (2011). COMPARATIVE STUDY OF DISTRIBUTION OF INDIAN STOCK MARKET
WITH OTHER ASIAN MARKETS. Retrieved 12 September 2017, from
http://www.ijecbs.com/July2011/43.pdf
IPO Insights: Comparing Global Stock Exchanges. (2017). Retrieved 12 September 2017, from
http://www.ey.com/Publication/vwLUAssets/IPO_Insights:_Comparing_global_stock
_exchanges/$FILE/IPO_comp aringglobalstockexchanges.pdf
Mukharjee, K.N. and Mishra , R.K (2005), “Stock Market Interlink ages: A study of Indian and World Equity
Markets”, Indian journal of Commerce, 58(1),17-42
Sharma JL and Kennedy RE (1977) “A comparative analysis of stock price behaviour on the Bombay,
London and New York stock exchanges”. Journal of Financial and Quantitative Analysis. 12:391–413.
IJCRT2102461 International Journal of Creative Research Thoughts (IJCRT) www.ijcrt.org 3881You can also read