Evaluation of Fragile Forest Ecosystem of Uttarakhand and Assessment of Associated Disaster
←
→
Page content transcription
If your browser does not render page correctly, please read the page content below
Scientific Society of Advanced Research and Social Change
SSARSC International Journal of Geo Science and Geo Informatics
ISSN 2348-6198
Volume 1 Issue 1, March 2014
Evaluation of Fragile Forest Ecosystem of Uttarakhand and
Assessment of Associated Disaster
Tajinder Kaur
IT Cell, Office of PCCF, Uttarakhand Forest Department, 85, Rajpur Road, Dehradun, Uttarakhand, India
Email: taji.ahuja1@gmail.com
Abstract: The flash flooding in the northern Indian and magnitude of landslides since 1970[1]. Landslides
state of Uttarakhand devastated the region with deadly may occur as a consequence of a number of
landslides and caused an unprecedented disaster determining and triggering factors [4][5]. Main
resulting in loss of lives and property. The heavy objective of the study is to determine optimal
rainfall created havoc by affecting the fragile nature sampling procedure in the presence of different
ecosystem of the Himalayan range, which is variables and to extract the information for the impact
characterised with problems of poor soil stability and of landslide on different variables such as forest cover,
steep slopes compounded by man-made factors like aspect, slope, altitude and forest types of Uttarakhand
indiscriminate deforestation and mindless construction and also to evaluate accuracy of the study and its
and lack of land use policy. The present paper variability on temporal dataset. Present paper tries to
explores the extent of damage in terms of find the loss of area during land slide in the monsoon
vegetation/forest cover through digital image season of 2013 when a serious disaster of the country
interpretation of Landsat-8 data for pre and post after Tsunami has occurred using Remote Sensing and
monsoon period, simultaneously carrying out GIS technologies.
sensitivity analysis of fragile ecosystem of the region.
The landslide map datasets so generated were verified 2. Study Area
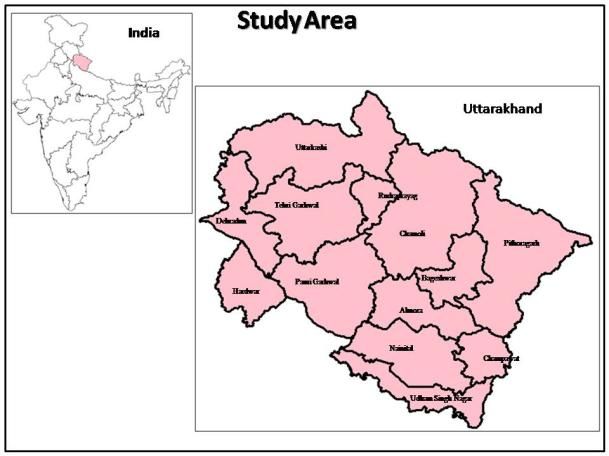
using Google Earth high resolution data. The paper Study area consists of all the 13 districts of
analyses landslide affected forest types, forest Uttarakhand state. Uttarakhand, a state of northern
densities, slope, aspect and altitude using multi- part of India have a geographical area of 53,483 km2
layered datasets. The findings of the paper have high which constitutes 1.63% of the country’s total area.
utility in preparing forest management plans and The state lies between lat 28°43’N and 31°28’ N and
carrying out development of the region, besides long 77°34’E and 81°03’E. About 19% of the total
stabilising the mountains. geographical area remains under permanent snow
[Key words: Landslides, DEM, forest types, forest cover, cover. Topographically, Uttarakhand can be divided
aspect, landsat-8.] into three zones namely, the Himalayas, the Shiwaliks
and the Terrai region. The temperature in the state
ranges from sub-zero to 43oC. The average annual
1. Introduction rainfall is 1,550 mm [2]. The forest cover in the state,
Undesired effects on ecosystem, human life as per ISFR 2011, is 24,496 km2 which is 45.80% of
and economic activity resulting from landslides due to the state’s geographical area [2].
flash flood and heavy rainfall are observed throughout
the Uttarakhand state. Loss of forest cover is a major
concern worldwide. Anthropogenic pressures are the
principal causes of such loss, although natural causes
(e.g. fire, flash flood etc.) may have locally significant
effects.[6] State received heavy rains in the months of
June 2013 onwards which created havoc in the state
by taking the lives of thousand people and damage the
ecosystem by landslides and flash floods. Hill slopes
in the Himalaya are known for their instability due to
ongoing tectonic activity. However, increasing
anthropogenic intervention in the recent times appears
to be contributing to terrain instability in addition to
natural factors, as observed by increasing frequency
www.ssarsc.org Page 1Scientific Society of Advanced Research and Social Change
SSARSC International Journal of Geo Science and Geo Informatics
ISSN 2348-6198
Volume 1 Issue 1, March 2014
various density classes such as very dense forest,
moderately dense forests, open forest, scrub and non
forests. Landslide classification has been done using
visual interpretation of the post monsoon satellite data.
The important aspects for identification of the
landslides in satellite imagery may include its spectral
characteristics, size, shape, contrast, and
morphological expression. Interpretability is
influenced by the contrast that results from the
spectral difference between the landslide and its
surroundings [14]. Because the landslides were mainly
bare of vegetation, elliptical or circular in shape
therefore visual interpretation of the imagery is the
most suitable and accurate method for the
identification of the landslide areas. Figure 4.1
Figure 2.1: Location map of the Study Area showing the map of landslide areas in Uttarakhand
state. Secondary data such as Forest cover map from
3. Data and Material FSI has been taken to find the accuracy assessment of
To carry out the study of the landslide the forest cover map generated using LANDSAT data
affected areas various kinds of spatial remote sensing during this study, editing has been done wherever the
data required. The data used in this study were doubt has been found using this map. Forest type map
LANDSAT-8 satellite data for pre and post monsoon of FSI was used to find the impact of landslide on
period of the year 2013, topographic maps of the various forest type groups. Post classification change
Survey of India 1:2,50,000 and 1:50,000 scale), detection technique was applied to extract change in
ASTER DEM, Forest cover map and Forest type maps different land cover classes. The change detection
from the Forest Survey of India. ArcGIS 9.0 and matrix was calculated to find the proportion of each
ERDAS Imagine 9.1, GIS and image processing class which has undergone change during landslides.
software have been used in the study. Forest Type-Group map has been used to find the
impact of landslide. Altitude zone, Slope map and
4. Methodology Aspect maps has been generated using ASTER DEM.
Satellite data 30 m spatial resolution of Altitude zone has been generated using rule based
Landsat-8, pre monsoon as well as post monsoon knowledge engineering tool of the ERDAS Imagine
season has been downloaded from USGS website. 9.1 software. Slope map was generated directly from
Similarly ASTER DEM 30m interval has also been ASTER digital elevation model by applying following
downloaded. The LANDSAT images were registered algorithms in ERDAS Imagine software.
with reference to topographic maps by taking input
ground control points (GCPs) from LANDSAT and
reference from toposheet maps. For the most part,
intersections of drainages, roads and sharp
meandering points of river were considered as the Similarly, Aspect was also generated directly from
GCPs. More than 150 GCPs were selected for ASTER digital elevation model by applying following
georeferencing, and resampling was done using the algorithms in ERDAS Imagine software.
nearest neighbour interpolation method. The
registered satellite images then reprojected from
geographic latitude longitude to UTM projection on
WGS84 datum. Similarly from the projected pre
monsoon satellite data, post monsoon satellite data
were georeferenced using AUTOSYNC module of the Where x, y represent a pixel having elevation value.
ERDAS imagine. Pre processing such as radiometric
corrections and image enhancement has been done for
each temporal satellite data. Derived thematic data
from the satellite data such as forest cover map has
been generated using NDVI and unsupervised
Classification as per the FSI methodology showing
www.ssarsc.org Page 2Scientific Society of Advanced Research and Social Change
SSARSC International Journal of Geo Science and Geo Informatics
ISSN 2348-6198
Volume 1 Issue 1, March 2014
non forested area due to landslide. It has been found
that total 8 districts out of 13 have been reported
landslide and forest loss due to flood in rivers. Figure
6.1, shows that the Rudraprayag is worst affected
district by landslide during this monsoon season
followed by Uttarkashi and Tehri.
Figure 4.1 Landslide areas in Uttarakhand during
2013 monsoon
5. Accuracy Assessment
Accuracy assessment is performed by
comparing the map created by remote sensing analysis
to a reference map from some other source of spatial
higher resolution. For the purpose of the accuracy Figure 6.1 District wise landslide areas
assessment cluster sampling technique was applied to
generate test sample on landslide class of classified 6.2 Impact of landslide on forest cover
image. Testing sites selected from classified map were When landslides do occur on forested slopes,
compared with the reference image of Google Earth in extreme rainfall and wind events, they may be
and LISS III data. The overall accuracy for the larger and more destructive than on non forested
landslide sites was 79.55% slopes. In particular, they are likely to evolve in to
debris flows which deliver large volumes of sediment
6. Result & Discussion and woody debris on the channel network [6] [7] [8].
In the present study, remote sensing and GIS An attempt has been made to find the impact of
were extensively used. Application of GIS was found rainfall induced landslides in different forest density
immensely useful for thematic data layer generation classes in each the districts of Uttarakhand Table 6.2.
and for their spatial data analysis, which involved It has been observed that moderately dense forest is
complex operations. the most affected forest cover followed by open forest.
Total landslide area in the state was observed to be Uttarkashi is showing highest forest loss among the
1092 ha, out of which 653 ha landslide was found to districts in moderately dense forests as well as open
be in forested area where as remaining area is the non forests, but it is observed that very dense forests has
forest area including pastures as well as grassland been badly affected in Rudraprayag district of
areas which was not analysed in the present study. Uttarakhand followed by Pithoragarh.
Information below gives the statistical analysis of the
landslide affected districts, forest cover, forest types
as well as the altitude zone, aspects and slop where the
maximum landslide had happened.
6.1 Impact of landslide in the districts of
Uttarakhand state
Study tries to find the information regarding
landslide area in different districts to find the most
affected districts in terms of loss of forest as well as
www.ssarsc.org Page 3Scientific Society of Advanced Research and Social Change
SSARSC International Journal of Geo Science and Geo Informatics
ISSN 2348-6198
Volume 1 Issue 1, March 2014
Table 6.2 District wise impact of landslide on
forest cover
Open Moderately Dense Very Dense
District Non Forest Scrub Total
Forest Forest Forest
Uttarkashi 106.65 141.48 5.48 128.76 1.5 383.87
Chamoli 14.94 14.76 1.92 24.19 0 55.81
Dehradun 3.83 0 0 23.08 0 26.91
Tehri 31.7 9.87 0 52.66 8.57 102.8
Rudraprayag 82.75 125.38 16.8 166.27 0 391.2
Pithoragarh 8.97 24.82 9.67 23.71 0 67.17
Pauri 11.84 17.64 0.12 15.38 3.83 48.81
Almora 0.19 10.73 0 4.9 0 15.82
Total 260.87 344.68 33.99 438.95 13.9 1092.39
6.4. Loss of Forest Cover in different aspects due to
6.3 Impact of landslide over different forest type landslide
groups Aspect is also considered as a landslide conditioning
As per Champion and Seth’s classification of forest factor and has been considered in many studies.
types Uttarakhand state have 8 forest type groups [9], Therefore present study also tried to find the
right from tropical to subtropical, temperate and sub- relationship between forest cover loss, aspect and
alpine to alpine forests. An attempt has been made by landslides. There is some association of land sliding
using change detection technique from different forest with slope aspect, with a tendency for landslides to
type group classes to landslide class and the area was develop preferentially on southeast to east facing
calculated for the loss in different forest type groups. slopes [10]. On north-facing slopes the landslide
Table 6.3 reveals that Group 12 Himalayan Moist frequency is relatively low, and it increases with the
Temperate Forests followed by Group 9 Subtropical orientation angle, reaching the maximum on south
Pine Forests are worst affected forest type groups of facing slopes, and then declines [11]. Same pattern has
the state. Group 5 Tropical Dry Deciduous Forests and been observed in the present study. Highest landslide
Group 14 Sub-Alpine Forests have also reported has been observed in South aspect followed by east
landslides during monsoon season. and west (Table 6.4). Northern aspect has been found
less affected by landslide event. However forest cover
Table 6.3 Area showing impact of landslide on in the south aspect found to be highly damaged
forest type groups followed by Eastern and Northern aspects.
S.No Forest Type Group Area
Group 3 Tropical Moist Table 6.4 Table showing loss of forest type groups
1 Deciduous Forests 11.83 due to landslide
Group 5 Tropical Dry Total
No Eas Sou We
2 Deciduous Forests 37.26 Forest Cover Landslid
rth t th st
Group 9 Subtropical Pine e
3 Forests 248.96 12. 84. 127 36.
Group 12 Himalayan Moist Open Forest 54 47 .82 04 260.87
4 Temperate Forests 284.94 Moderately 101 90. 67. 84.
Group 13 Himalayan Dry Dense Forest .96 37 97 38 344.68
5 Temperate Forests 31.45 Very Dense 12. 18. 1.9
Forest 26 37 6 1.4 33.99
6 Group 14 Sub-Alpine Forests 34.18 1.9 10. 1.2
Group 15 Moist Alpine Scrub 0 2 76 2 13.9
7 Scrub 4.82 40. 100 219 78.
Total 653.44 Non-Forest 37 .75 .33 5 438.95
Total 167 295 427 201
Landslide .13 .88 .84 .54 1092.39
www.ssarsc.org Page 4Scientific Society of Advanced Research and Social Change
SSARSC International Journal of Geo Science and Geo Informatics
ISSN 2348-6198
Volume 1 Issue 1, March 2014
nature’s fury or human folly, Current Science, Vol.
6.5. Impact of landslide in different Altitude Zones 100, No. 11, 10 June 2011
Altitude is a significant factor for the landslides. To
assess the landslide affected altitude zone an overlay 2. FSI, India State of Forest Report, Forest
analysis of altitude zone map and landslide area map Survey of India, Ministry of Environment and forests,
has been done using ASTER DEM of 30 m interval. It 2011.
has been observed that the maximum landslide
occurred between 1000-1500 m altitude zone followed 3. Government of Uttarakhand, Uttarakhand
by 1500-2000m and 2000-2500m altitude zones State Action Plan for Climate Change, Revised
(Table 6.5). Version June 2012
Table 6.5 Table showing altitude zones wise loss of 4. Varnes, D.J., “Slope movement types and
area in landslide process”, In: Schuster, R.L. and Krizek, R.J. (eds)
Landslides Analysis and control, Transportation
S.No. Altitude Zone Area Research Board Special Report 176, Washington DC:
National Academy Press, pp. 11-33,1978.
1 0-500 33.68
2 500-1000 124.25 5. Popescu, M.E., “A suggested method for
reporting landslide causes”, Bulletin IAEG, No. 50,
3 1000-1500 344.56
pp. 71-74,1994.
4 1500-2000 274.36
5 2000-2500 190.97 6. James C. Bathurst, Modelling the impact of
6 2500-3000 96.7 forest loss on shallow landslide sediment yield, Ijuez
river catchmtent, Spanish Pyrenees, Hydrol.Earth
7 3000-3500 25.55
Syst.Sci., 11(1), 569-583,2007
8 >3500 2.32
Total 1092.39 7. Eschner,A.R. and Patrick, J.H., Debris
avalanches in eastern upland forests. J. Forestry,
6.6. Impact of landslide in different Slopes 80,343-347., 1982
The most important parameter in the slope stability
analysis is the slope angle [12]. About 96 percent of 8. DeGraff J.V., Bryce, R.,Jibson, R.W., Mora,
the landslides initiated from slopes between 16° and S. And Rogers, C.T., landslides: their extent and
44° [13].Slope angle has been derived from ASTER significance in the Caribbean. In: Landslides: Extent
DEM. Present study reveals that the maximum and Economic significance, E.E. Brabb and B.L.
landslide in the state is between 15o and 35o followed Harrod (Eds), Balkema, Rorrerdam, The Netherlands,
by 35o to 50o and 0o to 15o slope angle (Table 6.6). 68, 1989.
Table 6.6 Table showing impact of landslide on 9. FSI, Atlas: Forest Types of India, Forest
different Slope Survey of India, Ministry of Environment and forests,
S.N Slope Area in 2011.
o. Slope Angle ha.
o o 10. M. S. Rawat, B.S.Rawat, V. Joshi and
1 Gentle 0 -15 202.76 M.M.Kimothi, Statistical analysis of Landslide in
2 Moderately High 15 o -35 o 585.12 South district, Sikkim, India:using Remote Sensing
3 High o
35 -50 o
279.69 and GIS, Journal Of Environmental Science,
Toxicology And Food Technology, Volume 2, Issue 3,
4 Steep > 50 o 24.82 PP 47-61, Nov. - Dec. 2012.
Total 1092.39
11. F.C. Dai, C.F. Lee, Landslide characteristics
7. References and slope instability modeling using GIS, Lantau
Island, Hong Kong, Geomorphology 42, 213– 228,
1. Sati S. P., Sundriyal Y. P., Rana Naresh and 2002.
Dangwal Surekha, Recent landslides in Uttarakhand:
www.ssarsc.org Page 5Scientific Society of Advanced Research and Social Change
SSARSC International Journal of Geo Science and Geo Informatics
ISSN 2348-6198
Volume 1 Issue 1, March 2014
12. Lee S, Min K, Statistical analysis of
landslide susceptibility at Yongin, Korea. Environ
Geol 40:1095–1113, 2001.
13. Coe J.A., Godt J.W., Baum R.L., Bucknam
R.C. & Michael J.A. Landslide susceptibility from
topography in Guatemala, W.A., Erlich, M., Fontoura,
S.A.B., and Sayao, A.S.F., eds., Landslides-evaluation
and stabilization, Proceedings of the 9th International
Symposium on Landslides: London, A.A. Balkema
Publishers, v. 1, p. 69-78, 2004.
14. Sarkar S. and Kanungo D.P., “An Integrated
Approach for Landslide Susceptibility Mapping Using
Remote Sensing and GIS”. Photogrammetric
Engineering & Remote Sensing Vol. 70, No. 5, p.
617–625. 2004
www.ssarsc.org Page 6You can also read