CHECKERS 15-YEAR NNN SALE-LEASEBACK - OFFERING MEMORANDUM 81 Northside Dr E, Statesboro, GA 30458

Page created by Evelyn Sherman
 
CONTINUE READING
CHECKERS 15-YEAR NNN SALE-LEASEBACK - OFFERING MEMORANDUM 81 Northside Dr E, Statesboro, GA 30458
VERY HIGH SALES | ABOVE CHECKERS NATIONAL AVERAGE

                                             LOW RENT TO SALES RATIO | RELOCATION STORE

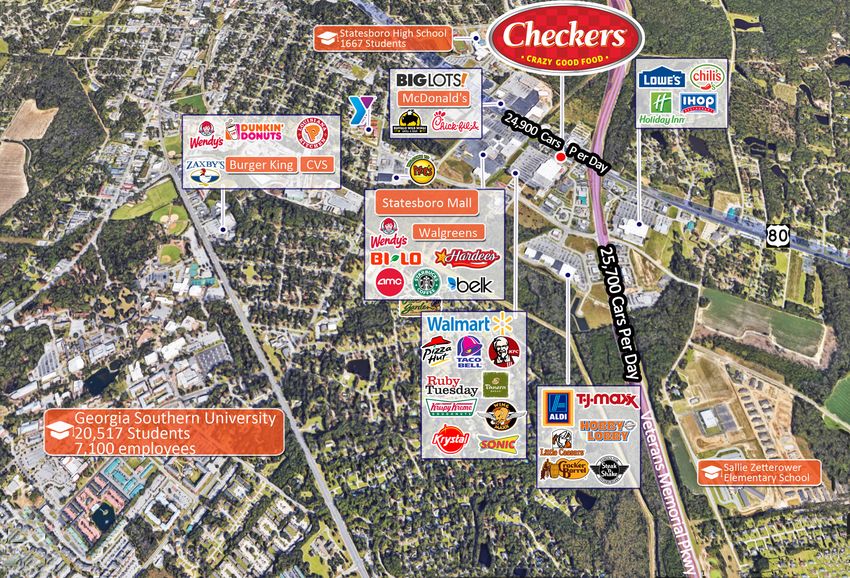
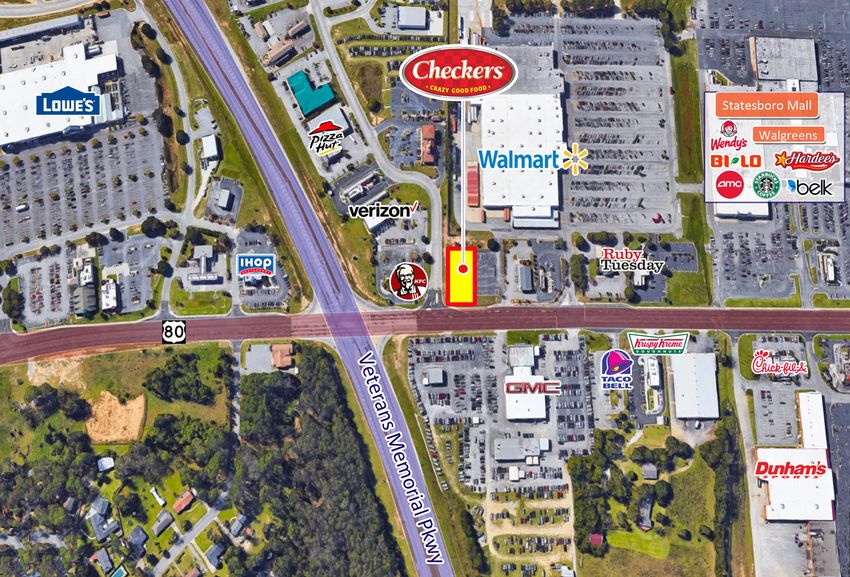
                                          ADJACENT TO WALMART SUPERCENTER WITH HIGH TRAFFIC

        SINCE OPENING
        APRIL 14TH, 2020
      THROUGH JAN 20TH,
      2021 CHECKERS HAS
      ACHIEVED $1.66M IN
      SALES (LESS THAN 10
           MONTHS)

Representative Photo

CHECKERS 15-YEAR NNN SALE-LEASEBACK
81 Northside Dr E, Statesboro, GA 30458

OFFERING MEMORANDUM
CHECKERS 15-YEAR NNN SALE-LEASEBACK - OFFERING MEMORANDUM 81 Northside Dr E, Statesboro, GA 30458
CONFIDENTIALITY & DISCLAIMER STATEMENT

The information contained in the following Marketing Brochure is proprietary and strictly confidential. It is intended to be reviewed only by the party receiving it from Marcus &
Millichap and should not be made available to any other person or entity without the written consent of Marcus & Millichap. This Marketing Brochure has been prepared to provide
summary, unverified information to prospective purchasers, and to establish only a preliminary level of interest in the subject property. The information contained herein is not a
substitute for a thorough due diligence investigation. Marcus & Millichap has not made any investigation, and makes no warranty or representation, with respect to the income or
expenses for the subject property, the future projected financial performance of the property, the size and square footage of the property and improvements, the presence or
absence of contaminating substances, PCB's or asbestos, the compliance with State and Federal regulations, the physical condition of the improvements thereon, or the financial
condition or business prospects of any tenant, or any tenant’s plans or intentions to continue its occupancy of the subject property. The information contained in this Marketing
Brochure has been obtained from sources we believe to be reliable; however, Marcus & Millichap has not verified, and will not verify, any of the information contained herein, nor
has Marcus & Millichap conducted any investigation regarding these matters and makes no warranty or representation whatsoever regarding the accuracy or completeness of the
information provided. All potential buyers must take appropriate measures to verify all of the information set forth herein.

Marcus & Millichap is not affiliated with, sponsored by, or endorsed by any commercial tenant or lessee identified in this marketing package. The presence of any corporation’s logo
or name is not intended to indicate or imply affiliation with, or sponsorship or endorsement by, said corporation of Marcus & Millichap, its affiliates or subsidiaries, or any agent,
product, service, or commercial listing of Marcus & Millichap, and is solely included for the purpose of providing tenant lessee information about this listing to prospective
customers.

Marcus & Millichap hereby advises all prospective purchasers of Net Leased property as follows:

The information contained in this Marketing Brochure has been obtained from sources we believe to be reliable. However, Marcus & Millichap has not and will not verify any of this
information, nor has Marcus & Millichap conducted any investigation regarding these matters. Marcus & Millichap makes no guarantee, warranty or representation whatsoever
about the accuracy or completeness of any information provided.

As the Buyer of a net leased property, it is the Buyer’s responsibility to independently confirm the accuracy and completeness of all material information before completing any
purchase. This Marketing Brochure is not a substitute for your thorough due diligence investigation of this investment opportunity. Marcus & Millichap expressly denies any
obligation to conduct a due diligence examination of this Property for Buyer. Any projections, opinions, assumptions or estimates used in this Marketing Brochure are for example
only and do not represent the current or future performance of this property. The value of a net leased property to you depends on factors that should be evaluated by you and
your tax, financial and legal advisors. Buyer and Buyer’s tax, financial, legal, and construction advisors should conduct a careful, independent investigation of any net leased property
to determine to your satisfaction with the suitability of the property for your needs.
CHECKERS 15-YEAR NNN SALE-LEASEBACK - OFFERING MEMORANDUM 81 Northside Dr E, Statesboro, GA 30458
CONFIDENTIALITY & DISCLAIMER STATEMENT

As the Buyer of a net leased property, it is the Buyer’s responsibility to independently confirm the accuracy and completeness of all material information before completing any
purchase. This Marketing Brochure is not a substitute for your thorough due diligence investigation of this investment opportunity. Marcus & Millichap expressly denies any
obligation to conduct a due diligence examination of this Property for Buyer. Any projections, opinions, assumptions or estimates used in this Marketing Brochure are for example
only and do not represent the current or future performance of this property. The value of a net leased property to you depends on factors that should be evaluated by you and
your tax, financial and legal advisors. Buyer and Buyer’s tax, financial, legal, and construction advisors should conduct a careful, independent investigation of any net leased
property to determine to your satisfaction with the suitability of the property for your needs.

Like all real estate investments, this investment carries significant risks. Buyer and Buyer’s legal and financial advisors must request and carefully review all legal and financial
documents related to the property and tenant. While the tenant’s past performance at this or other locations is an important consideration, it is not a guarantee of future success.
Similarly, the lease rate for some properties, including newly-constructed facilities or newly-acquired locations, may be set based on a tenant’s projected sales with little or no
record of actual performance, or comparable rents for the area. Returns are not guaranteed; the tenant and any guarantors may fail to pay the lease rent or property taxes, or may
fail to comply with other material terms of the lease; cash flow may be interrupted in part or in whole due to market, economic, environmental or other conditions. Regardless of
tenant history and lease guarantees, Buyer is responsible for conducting his/her own investigation of all matters affecting the intrinsic value of the property and the value of any
long-term lease, including the likelihood of locating a replacement tenant if the current tenant should default or abandon the property, and the lease terms that Buyer may be able
to negotiate with a potential replacement tenant considering the location of the property, and Buyer’s legal ability to make alternate use of the property. By accepting this
Marketing Brochure you agree to release Marcus & Millichap Real Estate Investment Services and hold it harmless from any kind of claim, cost, expense, or liability arising out of
your investigation and/or purchase of this net leased property.

SPECIAL COVID-19 NOTICE

All potential buyers are strongly advised to take advantage of their opportunities and obligations to conduct thorough due diligence and seek expert opinions as they may deem
necessary, especially given the unpredictable changes resulting from the continuing COVID-19 pandemic. Marcus & Millichap has not been retained to perform, and cannot
conduct, due diligence on behalf of any prospective purchaser. Marcus & Millichap’s principal expertise is in marketing investment properties and acting as intermediaries
between buyers and sellers. Marcus & Millichap and its investment professionals cannot and will not act as lawyers, accountants, contractors, or engineers. All potential buyers
are admonished and advised to engage other professionals on legal issues, tax, regulatory, financial, and accounting matters, and for questions involving the property’s physical
condition or financial outlook. Projections and pro forma financial statements are not guarantees and, given the potential volatility created by COVID-19, all potential buyers
should be comfortable with and rely solely on their own projections, analyses, and decision-making.)
CHECKERS 15-YEAR NNN SALE-LEASEBACK - OFFERING MEMORANDUM 81 Northside Dr E, Statesboro, GA 30458
OFFERING INCLUDES
    PRICING & FINANCIAL ANALYSIS
•    Investment Highlights
•    Executive Summary

    COMPANY OVERVIEW

    TENANT OVERVIEW

    PROPERTY OVERVIEW
•    Aerial Maps

    LOCATION OVERVIEW
•    City Overview
•    Economic Overview
•    Demographic Analysis
CHECKERS 15-YEAR NNN SALE-LEASEBACK - OFFERING MEMORANDUM 81 Northside Dr E, Statesboro, GA 30458
$776 Million System Wide Sales
   Over 841 Locations Nationwide
                  Established 1986
CHECKERS 15-YEAR NNN SALE-LEASEBACK - OFFERING MEMORANDUM 81 Northside Dr E, Statesboro, GA 30458
SINCE OPENING
                                                                                                                           APRIL 14TH, 2020
                                                                                                                         THROUGH JAN 20TH,
                                                                                                                         2021 CHECKERS HAS                                                               •        LOCATION! LOCATION! LOCATION! WALMART OUTPARCEL
                                                                                                                         ACHIEVED $1.66M IN
                                                                                                                         SALES (LESS THAN 10
                                                                                                                                                                                                         •        BRAND NEW 15-YEAR NNN LEASE COMMENCES AT CLOSING
                                                                                                                              MONTHS)                                                                    •        SALE-LEASEBACK WITH LOW RENT TO SALES RATIO
                                                                                                                                                                                                         •        VERY HIGH SALES OF $1.66M IN LESS THAN 10 MONTHS
                                                                                                                                                                                                         •        CHECKERS FRANCHISEE SINCE 1993 WITH MULTIPLE LOCATIONS
                                                                                                                                                                                                         •        BRAND NEW CONSTRUCTION WITH LATEST CHECKER’S PROTOTYPE
                                                                                                                                                                                                         •        RELOCATION STORE IN STATESBORO
                                                                                                                                                                                                         •        LOCATED IN QUALIFIED OPPORTUNITY ZONE
                                                                                                                                                                                                         •        LOCATED ON MAIN RETAIL CORRIDOR
                                                                                                                                                                                                         •        DIRECTLY OFF OF VETERANS MEMORIAL PARKWAY
                                                                                                                                                                                                         •        GEORGIA SOUTHERN UNIVERSITY –20,000 STUDENTS
                                                                                                                                                                                                         •        HIGH TRAFFIC COUNTS
                                                                                                                                                                                                         •        WALKING DISTANCE FROM STATESBORO MALL
                                                                                                                                                                                                         •        OVER 30% POPULATION INCREASE SINCE 2000
                                                                                                                                                                                                         •        SINGLE TENANT NET LEASED ASSET

                                                                                                                                                                                                               Marcus & Millichap is pleased to offer this Checkers restaurant
                                                                                                                                                                                                               property paired with an absolute net long term lease with zero
                                                                                                                                                                                                               landlord responsibilities.

This information has been secured from sources we believe to be reliable, but we make no representations or warranties, expressed or implied, as to the accuracy of the information. References to square footage or age are approximate. Buyer must verify the information and bears all risk for any inaccuracies. Any projections, opinions, assumptions or
estimates used herein are for example purposes only and do not represent the current or future performance of the property. Marcus & Millichap Real Estate Investment Services is a service mark of Marcus & Millichap Real Estate Investment Services, Inc. © 2021,2022 Marcus & Millichap Activity ID ZAB0390071
CHECKERS 15-YEAR NNN SALE-LEASEBACK - OFFERING MEMORANDUM 81 Northside Dr E, Statesboro, GA 30458
RENT SCHEDULE                                                                                   MONTHLY RENT                             ANNUAL RENT
                                                                                                                                                                              YEAR 1                                                                                          $7,500                                  $90,000
                                                                                                                                                                              YEAR 2                                                                                          $7,500                                  $90,000
 LIST PRICE                                                                                    $1,500,000                                                                     YEAR 3                                                                                          $7,500                                  $90,000
 CAP RATE                                                                                           6.00%                                                                     YEAR 4                                                                                          $7,500                                  $90,000
                                                                                                                                                                              YEAR 5                                                                                          $7,500                                  $90,000
                                                                                                                                                                              YEAR 6                                                                                          $7,875                                 $94,500
 INCREASES                                                                               5% Every 5 Years                                                                     YEAR 7                                                                                          $7,875                                  $94,500
 BASE LEASE TERM                                                                                 15 Years                                                                     YEAR 8                                                                                          $7,875                                  $94,500
 OPTIONS                                                                              Four 5-Year Options                                                                     YEAR 9                                                                                          $7,875                                  $94,500
 LOT SIZE                                                                                     0.56 ACRES                                                                     YEAR 10                                                                                          $7,875                                  $94,500
 TYPE OF OWNERSHIP                                                                             Fee Simple                                                                    YEAR 11                                                                                          $8,269                                 $99,225
 TENANT                                                                           Franchisee (Since 1993)                                                                    YEAR 12                                                                                          $8,269                                  $99,225
                                                                                                                                                                             YEAR 13                                                                                          $8,269                                  $99,225
                                                                                                                                                                             YEAR 14                                                                                          $8,269                                  $99,225
                                                                                                                                                                             YEAR 15                                                                                          $8,269                                  $99,225

                                                                                                                                                                                 NET OPERATING INCOME                                                                                                              $90,000

This information has been secured from sources we believe to be reliable, but we make no representations or warranties, expressed or implied, as to the accuracy of the information. References to square footage or age are approximate. Buyer must verify the information and bears all risk for any inaccuracies. Any projections, opinions, assumptions or
estimates used herein are for example purposes only and do not represent the current or future performance of the property. Marcus & Millichap Real Estate Investment Services is a service mark of Marcus & Millichap Real Estate Investment Services, Inc. © 2021,2022 Marcus & Millichap Activity ID ZAB0390071
CHECKERS 15-YEAR NNN SALE-LEASEBACK - OFFERING MEMORANDUM 81 Northside Dr E, Statesboro, GA 30458
Corporate HQ | Tampa, FL
Checkers Drive-In Restaurants, Inc., is one of the largest chains of double drive-thru restaurants in the United States. The                                                                                                    OWNERSHIP                                                                       PRIVATE
company operates Checkers and Rally's restaurants in 28 states and the District of Columbia. They specialize in hamburgers,                                                                                                     FOUNDED                                                                          1985
hot dogs, french fries, and milkshakes.
                                                                                                                                                                                                                                OWNER                                                                  OAK HILL CAPITAL
Checkers and Rally's had similar concepts, being almost exclusively drive-thru with very little seating. After the merger,
Rally's began redesigning its restaurants to follow the Checkers look. Today, Checkers and Rally's restaurants look nearly
                                                                                                                                                                                                                                NUMBER OF LOCATIONS                                                              800+
identical, the only major difference being the name on the sign. In June 2006, the company went private through a merger                                                                                                        HEADQUARTERED                                                           TAMPA, FLORIDA
with Taxi Holdings Corp., an affiliate of Wellspring Capital Management, a private equity firm. In 2014, Wellspring sold                                                                                                        WEBSITE                                             WWW.CHECKERS.COM / WWW.RALLYS.COM
Checkers to another private equity firm, Sentinel Capital Partners.

 This information has been secured from sources we believe to be reliable, but we make no representations or warranties, expressed or implied, as to the accuracy of the information. References to square footage or age are approximate. Buyer must verify the information and bears all risk for any inaccuracies. Any projections, opinions, assumptions or
 estimates used herein are for example purposes only and do not represent the current or future performance of the property. Marcus & Millichap Real Estate Investment Services is a service mark of Marcus & Millichap Real Estate Investment Services, Inc. © 2021,2022 Marcus & Millichap Activity ID ZAB0390071
Statesboro, Georgia
Statesboro is the largest city and county seat of Bulloch County, Georgia, United States, located in the southeastern part of the state. Statesboro is
home to the flagship campus of Georgia Southern University and is part of the Savannah–Hinesville–Statesboro Combined Statistical Area. As of                                                                                                                      COUNTY                          BULLOCH
2018, the Statesboro Micropolitan Statistical Area, which consists of Bulloch County, had an estimated population of 74,722. Statesboro is the
largest Micropolitan Statistical Area in Georgia. It is the largest city in the Magnolia Midlands Region.
                                                                                                                                                                                                                                                                   COUNTY POPULATION                74,722
                                                                                                                                                                                                                                                                   DENSITY                     2,105/SQ MI
The city was chartered in 1803, starting as a small trading community providing basic essentials for surrounding cotton plantations. This drove the
                                                                                                                                                                                                                                                                   ZIP CODES                  30458-30461
economy throughout the 19th century, both before and after the U.S. Civil War. In 2017, Statesboro was selected in the top three of the national                                                                                                                   AREA CODE                           912
America's Best Communities competition and was named one of nine Georgia "live, work, play" cities by the Georgia Municipal Association.                                                                                                                           WEBSITE           WWW.STATESBOROGA.GOV
Statesboro's was named one of eight "Renaissance Cities" by Georgia Trend magazine.

    This information has been secured from sources we believe to be reliable, but we make no representations or warranties, expressed or implied, as to the accuracy of the information. References to square footage or age are approximate. Buyer must verify the information and bears all risk for any inaccuracies. Any projections, opinions, assumptions or
    estimates used herein are for example purposes only and do not represent the current or future performance of the property. Marcus & Millichap Real Estate Investment Services is a service mark of Marcus & Millichap Real Estate Investment Services, Inc. © 2021,2022 Marcus & Millichap Activity ID ZAB0390071
STATESBORO’S TOP EMPLOYERS ARE:

Georgia Southern University – 7,129
Bulloch County Board of Education – 1,493
Bulloch County – 1,146
East Georgia Regional Medical Center – 800                                                                                        In recent years, employment in Statesboro, GA grew at a rate of 2.35%, from 31.9k employees to 32.7k
Walmart Distribution Center – 563                                                                                                 employees. The most common job groups, by number of people living in Statesboro, GA, are Sales & Related
Walmart Supercenter – 525                                                                                                         Occupations (3,672 people), Office & Administrative Support Occupations (3,436 people), and Management
Pineland Area Community Service Board – 500                                                                                       Occupations (2,857 people). This chart illustrates the share breakdown of the primary jobs held by residents
Viracon – 415                                                                                                                     of Statesboro, GA.
Great Dane – 480
Briggs & Stratton – 350
City of Statesboro – 314
H.A. Sack Company – 300
Ogeechee Technical College – 268 (Sept 2017)
Lowe's Home Improvement – 200
Claude Howard Lumber – 130
WM Sheppard Lumber – 100
Braswell Foods – 99
Southeast Roofing Systems – 91
Georgia Living – 90
MD Building Products – 80
Brodie International – 78
East Georgia State College – 62
GAF – 40

   This information has been secured from sources we believe to be reliable, but we make no representations or warranties, expressed or implied, as to the accuracy of the information. References to square footage or age are approximate. Buyer must verify the information and bears all risk for any inaccuracies. Any projections, opinions, assumptions or
   estimates used herein are for example purposes only and do not represent the current or future performance of the property. Marcus & Millichap Real Estate Investment Services is a service mark of Marcus & Millichap Real Estate Investment Services, Inc. © 2021,2022 Marcus & Millichap Activity ID ZAB0390071
HOUSEHOLDS BY EXPENDITURE                                                                3 Miles                      4 Miles                       5 Miles
             POPULATION                                                                               3 Miles                       4 Miles                      5 Miles                    Total Average Household Retail Expenditure                                              $38,921                       $42,483                      $45,183
             2023 Projection
                                                                                                                                                                                            Consumer Expenditure Top 10 Categories
                 Total Population                                                                      35,717                        42,511                        48,252
                                                                                                                                                                                                Housing                                                                             $10,604                       $11,462                      $12,151
             2018 Estimate
                                                                                                                                                                                                Transportation                                                                        $8,066                        $8,826                       $9,397
                 Total Population                                                                      33,315                        39,466                        44,665
             2010 Census                                                                                                                                                                       Shelter                                                                               $5,962                        $6,384                       $6,711
                 Total Population                                                                      31,874                        37,410                        42,245                       Food                                                                                  $4,025                        $4,325                       $4,553
             2000 Census                                                                                                                                                                       Personal Insurance and Pensions                                                       $2,712                        $3,102                       $3,419
                 Total Population                                                                      25,486                        29,489                        33,146                       Utilities                                                                             $2,685                        $2,902                       $3,068
             Current Daytime Population                                                                                                                                                        Health Care                                                                           $2,310                        $2,575                       $2,807
                 2018 Estimate                                                                         54,489                        59,207                        62,567
                                                                                                                                                                                                Entertainment                                                                         $1,433                        $1,589                       $1,716
             HOUSEHOLDS                                                                               3 Miles                       4 Miles                      5 Miles
                                                                                                                                                                                                Apparel                                                                               $1,018                        $1,105                       $1,185
             2023 Projection
                                                                                                                                                                                                Household Furnishings and Equipment                                                      $939                       $1,059                       $1,170
                 Total Households                                                                      12,698                        15,386                        17,562
             2018 Estimate                                                                                                                                                                 POPULATION PROFILE                                                                       3 Miles                      4 Miles                       5 Miles
                 Total Households                                                                      11,695                        14,102                        16,056                   Population By Age
                 Average (Mean) Household Size                                                             2.40                         2.44                          2.46                      2018 Estimate Total Population                                                        33,315                        39,466                       44,665
             2010 Census                                                                                                                                                                       Under 20                                                                             29.66%                        28.89%                       28.52%
                 Total Households                                                                      11,323                        13,499                        15,313                       20 to 34 Years                                                                       42.81%                        40.91%                       38.59%
             2000 Census
                                                                                                                                                                                                35 to 39 Years                                                                         3.87%                        4.29%                         4.57%
                 Total Households                                                                        9,518                       11,127                        12,503
                                                                                                                                                                                                40 to 49 Years                                                                         6.70%                        7.40%                         8.01%
             Occupied Units
                                                                                                                                                                                                50 to 64 Years                                                                         9.43%                       10.46%                       11.55%
                 2023 Projection                                                                       12,698                        15,386                        17,562
                 2018 Estimate                                                                         13,157                        15,846                        18,047                       Age 65+                                                                                7.54%                        8.06%                         8.72%

             HOUSEHOLDS BY INCOME                                                                     3 Miles                       4 Miles                      5 Miles                        Median Age                                                                              22.90                        23.54                         24.25
             2018 Estimate                                                                                                                                                                 Population 25+ by Education Level
                 $150,000 or More                                                                       2.84%                         3.29%                        4.02%                        2018 Estimate Population Age 25+                                                      14,147                        17,903                       21,384
                 $100,000 - $149,000                                                                    5.55%                         6.66%                        7.58%                        Elementary (0-8)                                                                       3.81%                        3.97%                         3.92%
                 $75,000 - $99,999                                                                      5.85%                         7.04%                        7.68%
                                                                                                                                                                                                Some High School (9-11)                                                                9.16%                        9.02%                         8.74%
                 $50,000 - $74,999                                                                    12.23%                        12.96%                        13.36%
                                                                                                                                                                                                High School Graduate (12)                                                            27.39%                        27.40%                       27.02%
                 $35,000 - $49,999                                                                    11.54%                        12.13%                        12.54%
                                                                                                                                                                                                Some College (13-15)                                                                 23.58%                        23.12%                       22.93%
                 Under $35,000                                                                        61.98%                        57.92%                        54.80%
             Average Household Income                                                                $42,270                       $45,699                       $49,553                        Associate Degree Only                                                                  5.78%                        6.04%                         6.09%

             Median Household Income                                                                 $25,453                       $28,742                       $31,080                        Bachelors Degree Only                                                                16.87%                        16.75%                       16.87%
             Per Capita Income                                                                       $16,857                       $18,086                       $19,375                        Graduate Degree                                                                      12.39%                        12.66%                       13.42%

This information has been secured from sources we believe to be reliable, but we make no representations or warranties, expressed or implied, as to the accuracy of the information. References to square footage or age are approximate. Buyer must verify the information and bears all risk for any inaccuracies. Any projections, opinions, assumptions or
estimates used herein are for example purposes only and do not represent the current or future performance of the property. Marcus & Millichap Real Estate Investment Services is a service mark of Marcus & Millichap Real Estate Investment Services, Inc. © 2021,2022 Marcus & Millichap Activity ID ZAB0390071
Population                                                                                                                                                                    Race and Ethnicity
                                    In 2019, the population in your selected geography is 33,315. The population has                                                                                              The current year racial makeup of your selected area is as follows: 51.84%
                                    changed by 30.72% since 2000. It is estimated that the population in your area will                                                                                           White, 41.57% Black, 0.16% Native American and 2.19% Asian/Pacific Islander.
                                    be 35,717.00 five years from now, which represents a change of 7.21% from the                                                                                                 Compare these to US averages which are: 70.20% White, 12.89% Black, 0.19%
                                    current year. The current population is 49.40% male and 50.60% female. The                                                                                                    Native American and 5.59% Asian/Pacific Islander. People of Hispanic origin are
                                    median age of the population in your area is 22.90, compare this to the US average                                                                                            counted independently of race.
                                    which is 37.95. The population density in your area is 1,178.51 people per square
                                    mile.                                                                                                                                                                         People of Hispanic origin make up 3.91% of the current year population in your
                                                                                                                                                                                                                  selected area. Compare this to the US average of 18.01%.

                                    Households
                                    There are currently 11,695 households in your selected geography. The number of
                                    households has changed by 22.87% since 2000. It is estimated that the number of                                                                                               Housing
                                    households in your area will be 12,698 five years from now, which represents a
                                                                                                                                                                                                                  The median housing value in your area was $135,609 in 2019, compare this to
                                    change of 8.58% from the current year. The average household size in your area is
                                                                                                                                                                                                                  the US average of $201,842. In 2000, there were 3,398 owner occupied housing
                                    2.40 persons.
                                                                                                                                                                                                                  units in your area and there were 6,120 renter occupied housing units in your
                                                                                                                                                                                                                  area. The median rent at the time was $346.

                                    Income
                                    In 2019, the median household income for your selected geography is $25,453,
                                    compare this to the US average which is currently $58,754. The median household                                                                                               Employment
                                    income for your area has changed by 17.91% since 2000. It is estimated that the                                                                                               In 2019, there are 21,284 employees in your selected area, this is also known as
                                    median household income in your area will be $29,137 five years from now, which                                                                                               the daytime population. The 2000 Census revealed that 59.08% of employees
                                    represents a change of 14.47% from the current year.                                                                                                                          are employed in white-collar occupations in this geography, and 40.84% are
                                                                                                                                                                                                                  employed in blue-collar occupations. In 2019, unemployment in this area is
                                    The current year per capita income in your area is $16,857, compare this to the US                                                                                            8.37%. In 2000, the average time traveled to work was 19.00 minutes.
                                    average, which is $32,356. The current year average household income in your
                                    area is $42,270, compare this to the US average which is $84,609.

This information has been secured from sources we believe to be reliable, but we make no representations or warranties, expressed or implied, as to the accuracy of the information. References to square footage or age are approximate. Buyer must verify the information and bears all risk for any inaccuracies. Any projections, opinions, assumptions or
estimates used herein are for example purposes only and do not represent the current or future performance of the property. Marcus & Millichap Real Estate Investment Services is a service mark of Marcus & Millichap Real Estate Investment Services, Inc. © 2021,2022 Marcus & Millichap Activity ID ZAB0390071
John Leonard
Atlanta Lic.# 252904
P: 0232750
You can also read