LA CIRCULAON THERMOHALINE DE 1800 À NOS JOURS - CASIMIR DE LAVERGNE MATHSINFLUIDS, FÉVRIER 2021
←
→
Page content transcription
If your browser does not render page correctly, please read the page content below
La circula)on thermohaline
     de 1800 à nos jours

      Casimir de Lavergne
     MathsInFluids, février 2021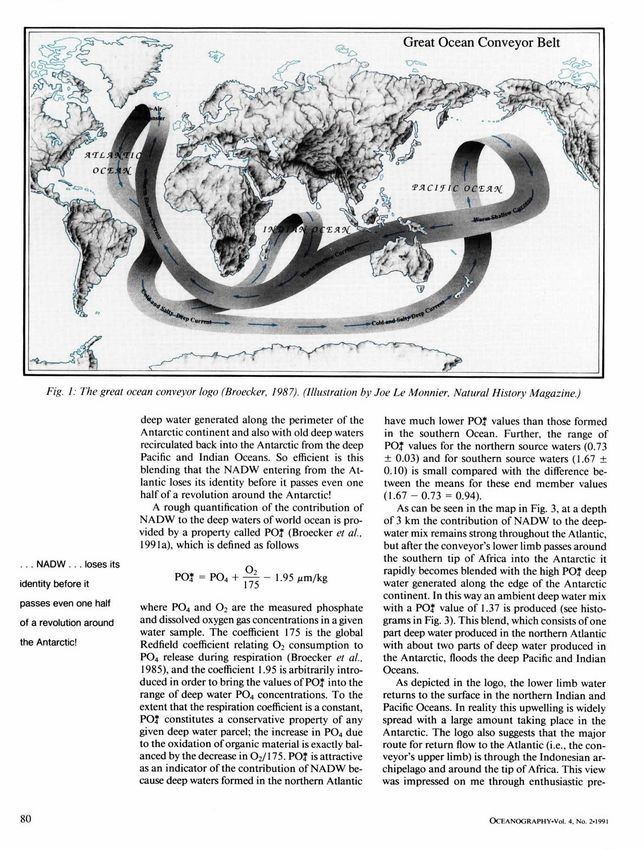
La circulation thermohaline aujourd’hui

                                                                                         TalleyRed
Figure 1. Schematic of the global overturning circulation. Purple = upper ocean and thermocline. 2013
                                                                                                   =
Plan

       I. Découverte de la circula)on
          thermohaline

       II. Moteurs de la circula)on
           thermohaline

       III. Une strate exclue de la circula)on
I. Découverte de la circula)on
   thermohaline

II. Moteurs de la circula)on
    thermohaline

III. Une strate exclue de la circula)on
Benjamin Thomson (1798)
              The propaga*on of heat in fluids (1798).

                                                        Température (ºC)
                                                        Salinité (g/kg)
Benjamin Thomson (1798)

                Capitaine Ellis (1750) : T ~ 10 ºC

                                                     Température (ºC)
                                                     Salinité (g/kg)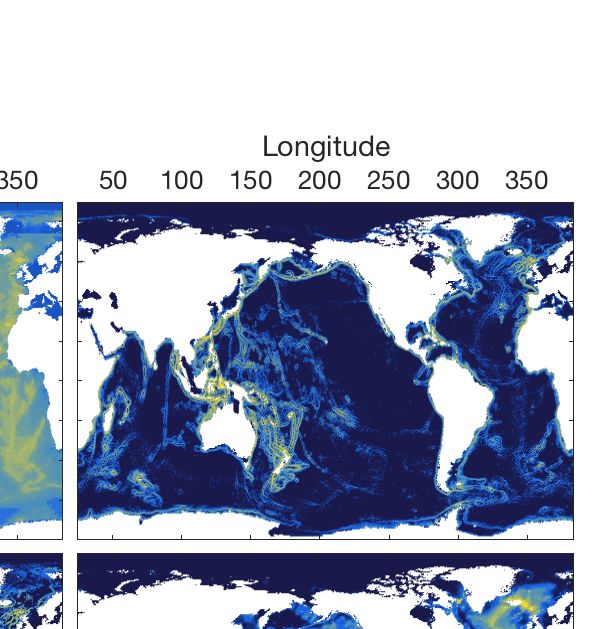
Benjamin Thomson (1798)
   La circulaIon n’est pas mesurée mais déduite des traceurs.

                                                                Température (ºC)
                                                                Salinité (g/kg)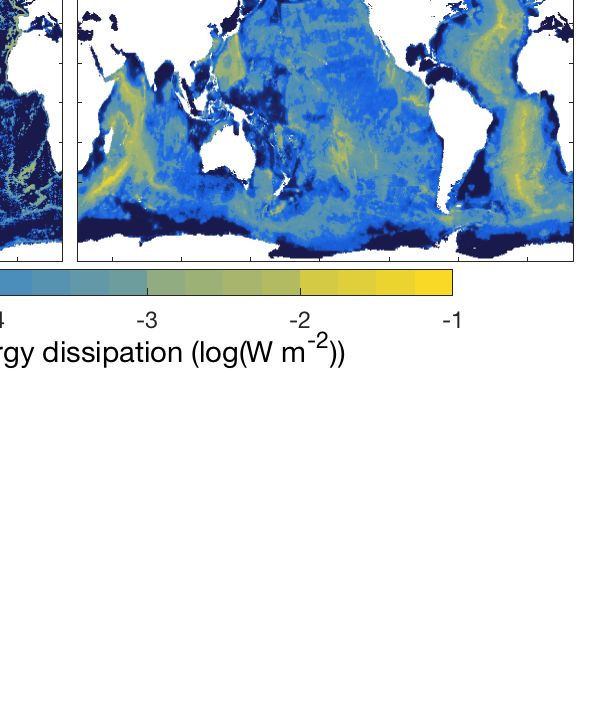
Benjamin Thomson (1798)
   La circulaIon n’est pas mesurée mais déduite des traceurs.

                                                                Température (ºC)
                                                                Salinité (g/kg)
??
                              ??
                                     Benjamin Thomson (1798)

Salinité (g/kg)   Température (ºC)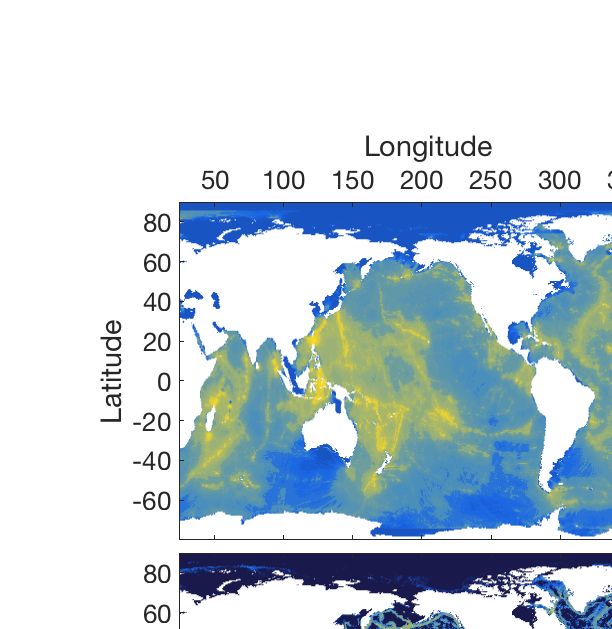
Stommel (1958)
                                   T h e a b y s s a l circulation

                                  (Received 18 February, 1958)

     « It seems
y survey            likely that
          of the theories          the low
                             of ocean        temperature
                                        currents  (Deep-Sea of   deep
                                                             Res.,       waters
                                                                     1957,          in theseveral
                                                                            4, 149-184)     worldschem
     oceanofisocean
pretations       maintained      in the
                        circulatory       faceare
                                     patterns  of presented.
                                                   downwardIndiffusion
                                                                   this letterofI heat
                                                                                  wish tofrom
                                                                                           showthehow, u
 me warm     surface
     principles,         layers by
                 it is possible      a veryinslow
                                 to sketch         upward
                                               broad outline component
                                                              the flow patternof velocity   in thecircul
                                                                                  for the abyssal
e world
     deepocean.
            water. »
 eems likely that the low temperature of deep waters in the world ocean is maintained in
of downward diffusion of heat from the warm surface layers by a very slow upward compo
     La circulaIon et la straIficaIon sont maintenus par le mélange des eaux
locity in the deep water. An adequate theory of the thermocline would, presumably, de
     profondes
 pward             avec
         velocity as       des eaux
                       a function   of plus légères.
                                       surface       MathémaIquement
                                               heating, turbulence parameters,    : etc. We might re
 ermocline as a " p u m p i n g mechanism " which slowly draws up deep water and hence act
mines the rate of flow of the abyssal circulation. An estimate of the maximum upward
nt of velocity under the thermocline, Wmax, is given in terms of the depth of the thermoc
  the equation.

                 Vitesse diapycnale              Diffusivité              Densité
Stommel (1958)
T h e a b y s s a l circulation
(Received 18 February, 1958)
« It seems
y survey likely that
of the theories the low
of ocean temperature
currents (Deep-Sea of deep
Res., waters
1957, in theseveral
4, 149-184) worldschem
oceanofisocean
pretations maintained in the
circulatory faceare
patterns of presented.
downwardIndiffusion
this letterofI heat
wish tofrom
showthehow, u
me warm surface
principles, layers by
it is possible a veryinslow
to sketch upward
broad outline component
the flow patternof velocity in thecircul
for the abyssal
e world
deepocean.
water. »
eems likely that the low temperature of deep waters in the world ocean is maintained in
of downward diffusion of heat from the warm surface layers by a very slow upward compo
La circulaIon et la straIficaIon sont maintenus par le mélange des eaux
locity in the deep water. An adequate theory of the thermocline would, presumably, de
profondes
pward avec
velocity as des eaux
a function of plus légères.
surface MathémaIquement
heating, turbulence parameters, : etc. We might re
ermocline as a " p u m p i n g mechanism " which slowly draws up deep water and hence act
mines the rate of flow of the abyssal circulation. An estimate of the maximum upward
nt of velocity under the thermocline, Wmax, is given in terms of the depth of the thermoc
the equation.
Flux de floCabilité
γ
γ+Δγ
VitesseMunk (1966)
Abyssal recipes
WALTER H. MUNK*
0 . . . . . I - - - I + I i - - - - - T - - I v+ I- " - i - -I ......... I - - - I . . . . . . 7 . . . . . . I --
( Received 31 January 1966)
Abstract--Vertical distributions in the , 7 interior Pacific (excluding tbe top and bottom kilometer) I
are not inzonsistent with a simple model involvinga constant upward vertical velozity w~ 1-2 c m clu y - t
and eddy diffusivity ,¢ ~ 1.3 cm ~-sec-1. Thus temperature and salinity can be fitted by exponential-
like solutions to [,¢- d"-/dz: -- w. d/d:] T, S = 0, with ,c/w ~ 1 km the appropriate "' scale height."
/
For Carbon 14 a decay term must be included, [ ] :~C = ~ 1~C; a fitting of the solution to the ob-
%"
served 1~C distribution yields ,,/w2 ~ 200 years for the appropriate "' scale time," and permits w and
,~ to be separately determined. Using the foregoing values, the upward flux of Radium in deep water
is found to be roughly 1.5 x 10-~-~gcm-~-sec-L as compared to 3 x 10-Z~gcm--~sec -I from
.l
sedimentary measurements by GOLOaF.RG and KOtDE (1963). Oxygen consumption is computed at
0-004 (ml/I) year-L The vertical distributions of 7', S, t4C and O: are consistent with the corresponding
south-north
4-f
i. gradients in the deep Pacific, provided thereI• is an average northward drift of at least a f
few millimetres per second.
How can one meaningfully interpret the inferred rates of upwelling and diffusion ? The annual
I
freezing of 2.1 x 10to g of Antarctic pack ice is associated I with bottom water formation in the ratio
i
43 : 1, yielding an estimated 4 × 10:0 g year-t of Pacific I-
bottom water; the value w = 1"2 cm day -t
5 "
implies 6 x 10~0
t
io 2 ° g year-L
I I I
I3! have
° attempted,
I I
4° without
•
.70much success,
I,,, t
. 6 0 to interpret x.50
I I
from a variety
I
3 4 . 4 0of
I
%+
viewpoints: from Fig. mixing
3. P o l c nalong
tial tcmp the
c r a t ocean
u r e a n d boundaries, fromo l 'thermodynamic
s a l i n i t y as ft,,Ictions d c p t h ( k i n ) a! s t a t i o nand
# 00.190, 33 ° 17"]'4, 132042-5'W ( s a l i n i t y at d c p t h I B S ? m was q u c s l i o , l c d i n Ihe o r i g i l l a l
biological
('~#('o/i 1964: processes,
and from internal tides. Following the work of Cox and SA,'qr~STROM(1962), it is found that surface
nh~rv~lion~l (:Lirvt'_~ I~heJ~(I w / x ( i n i m i l ~ Icm - 1 ) nre, h~c:e~l ('m e+111:lllc)l~ (1~Munk (1966)
Abyssal recipes
WALTER H. MUNK*
( Received 31 January 1966)
Abstract--Vertical distributions in the interior Pacific (excluding tbe top and bottom kilometer)
are not inzonsistent with a simple model involvinga constant upward vertical velozity w~ 1-2 c m clu y - t
and eddy diffusivity ,¢ ~ 1.3 cm ~-sec-1. Thus temperature and salinity can be fitted by exponential-
like solutions to [,¢- d"-/dz: -- w. d/d:] T, S = 0, with ,c/w ~ 1 km the appropriate "' scale height."
For Carbon 14 a decay term must be included, [ ] :~C = ~ 1~C; a fitting of the solution to the ob-
served 1~C distribution yields ,,/w2 ~ 200 years for the appropriate "' scale time," and permits w and
,~ to be separately determined. Using the foregoing values, the upward flux of Radium in deep water
is found to be roughly 1.5 x 10-~-~gcm-~-sec-L as compared to 3 x 10-Z~gcm--~sec -I from
sedimentary measurements by GOLOaF.RG and KOtDE (1963). Oxygen consumption is computed at
0-004 (ml/I) year-L The vertical distributions of 7', S, t4C and O: are consistent with the corresponding
south-north gradients in the deep Pacific, provided there is an average northward drift of at least a
few millimetres per second.
How can one meaningfully interpret the inferred rates of upwelling and diffusion ? The annual
freezing of 2.1 x 10to g of Antarctic pack ice is associated with bottom water formation in the ratio
43 : 1, yielding an estimated 4 × 10:0 g year-t of Pacific bottom water; the value w = 1"2 cm day -t
implies 6 x 10~0g year-L I have attempted, without much success, to interpret x from a variety of
viewpoints: from mixing along the ocean boundaries, from thermodynamic and biological processes,
and from internal tides. Following the work of Cox and SA,'qr~STROM(1962), it is found that surfaceMunk (1966)
Abyssal recipes
WALTER H. MUNK*
( Received 31 January 1966)
Abstract--Vertical distributions in the interior Pacific (excluding tbe top and bottom kilometer)
are not inzonsistent with a simple model involvinga constant upward vertical velozity w~ 1-2 c m clu y - t
and eddy diffusivity ,¢ ~ 1.3 cm ~-sec-1. Thus temperature
1 cm2/s and salinity can be fitted by exponential-
1 cm/jour
like solutions to [,¢- d"-/dz: -- w. d/d:] T, S = 0, with ,c/w ~ 1 km the appropriate "' scale height."
For Carbon 14 a decay term must be included, [ ] :~C = ~ 1~C; a fitting of the solution to the ob-
served 1~C distribution yields ,,/w2 ~ 200 years for the appropriate "' scale time," and permits w and
,~ to be separately determined. Using the foregoing values, the upward flux of Radium in deep water
is found to be roughly 1.5 x 10-~-~gcm-~-sec-L as compared to 3 x 10-Z~gcm--~sec -I from
sedimentary measurements by GOLOaF.RG and KOtDE (1963). Oxygen consumption is computed at
0-004 (ml/I) year-L The vertical distributions of 7', S, t4C and O: are consistent with the corresponding
south-north gradients in the deep Pacific, provided there is an average northward drift of at least a
few millimetres per second.
How can one meaningfully interpret the inferred rates of upwelling and diffusion ? The annual
freezing of 2.1 x 10to g of Antarctic pack ice is associated with bottom water formation in the ratio
43 : 1, yielding an estimated 4 × 10:0 g year-t of Pacific bottom water; the value w = 1"2 cm day -t
implies 6 x 10~0g year-L I have attempted, without much success, to interpret x from a variety of
viewpoints: from mixing along the ocean boundaries, from thermodynamic and biological processes,
and from internal tides. Following the work of Cox and SA,'qr~STROM(1962), it is found that surfaceJOURNAL OF GEOPHYSICAL RESEARCH, VOL. 91, NO. C4, PAGES 5037-5046, APRIL 15, 1986
Gordon (1986)
Interocean Exchange of Thermocline Water
ARNOLD L. GORDON
5040 Lamont-DohertyGeolo•Tical
GORDON' Observatory
INTEROCEAN of Columbia
EXCHANGE University,Palisades,
OF THERMOCLINE WATER New York
Formation of North Atlantic
180øW
Deep Water
120 ø
(NADW) 120
60 ø 0 ø 60 ø
represents
ø
a transfer of upper layer water to
180 ø E
abyssaldepthsat a rate of 15 to 20 x 106 m3/s. NADW spreadsthroughoutthe Atlantic Ocean and is
exported to the Indian and Pacific Oceans by the Antarctic Circumpolar Current }øN and deep western
boundary currents. Naturally, there must be a compensating flow of upper layer water toward (•) UPWELLING
the
• SINKING
northern North Atlantic to feed NADW production. It is proposed that this return flow is accomplished
primarily within the ocean's warm water thermocline layer. In this way the main thermoclinesof the
ocean are linked as they participate in a thermohaline-drivenglobal scalecirculation cell associatedwith
NADW formation. The path of the return flow of warm water is as follows: Pacific to Indian flow within
the Indonesian Seas, advection across the Indian Ocean in the 10ø-15øS latitude belt, southward transfer
in the Mozambique Channel, entry into the South Atlantic by a branch of the Agulhas Current that does
not complete the retroflection pattern, northward advection within the subtropical gyre of the South
Atlantic (which on balance with the southward flux of colder North Atlantic Deep Water supportsthe
20"
northward oceanic heat flux characteristic of the South Atlantic), and cross-equatorial flow into the
western North Atlantic. The magnitude of the return flow increasesalong its path as more NADW is
incorporated into the upper layer of the ocean.Additionally, the water masscharacteristicsof the return
0o
flow are gradually altered by regional ocean-atmosphereinteraction and mixing processes.Within the
Indonesian
b seasthere is evidenceof strong vertical mixing acrossthe thermocline. The cold water route,
Pacific to Atlantic transport of Subantarctic water within the Drake Passage,is of secondaryimportance,
amounting to perhaps 25% of the warm water route transport. The continuity or vigor of the warm
water route is vulnerable to change not onlyb7 as the thermohaline forcing in the northern North Atlantic
i
varies but also as the larger-scalewind-driven criculation factors vary. The interocean links within the
Indonesian
\
\
seas and at the Agulhas retroflection may be particularly responsiveto such variability.
Changesin the warn: water route continuitymay in turn influenceformation characteristics of NADW.
/b'
DEEPWATERFLOW
INTRODUCTION tern in the meridionalplane associated
.•.
with the NADW for-
"COLD"WATER TRANSFER
'? )oS
Warm salty water spreadsinto the northern North Atlantic, mation is one of a negative estuary [Stommel,
INTO 1956;
ATLANTIC Reid,
OCEAN
where it is cooled primarily by evaporation. Ironically, this is 1961; Worthington, 1981; Gordon and Piola, 1983]:
"WARM"UPPER upper
LAYER FLOW
a consequenceof its anomalously high temperature relative to layer water movesto the north, while deeperwater movestoBroecker (1987)
The biggest chill (1987).
Great Ocean Conveyor Belt
Q
\ ~ °' oo~
OCt:
PA CtYit~
Fig. 1." The great ocean conveyor logo (Broecker, 1987). (Illustration by Joe Le Monnier, Natural History Magazine.)Toggweiler et Samuels (1993)
• Deux cellules.
• Rôle pivot de l’océan austral.
Est
Océan Austral
Indo-Pacifique Atlantique
Indo-Pacifique Cellule pilotée
par le vent
Antarctique
Profondeur
Atlantique
Cellule
thermohaline Atlantique +
Indo-Pacifique
NordToggweiler et Samuels (1993)
Dans le canal ré-entrant :
Est
Vents
Océan Austral d’ouest
Indo-Pacifique Atlantique
Indo-Pacifique Cellule pilotée
par le vent
Antarctique
Profondeur
Atlantique
Cellule
thermohaline Atlantique +
Indo-Pacifique
NordTalley (2013) Indo-Pacifique
• Deux cellules imbriquées : circulaIon
Nord en huit.
Eaux superficielles
Océan Austral : tropicales/subtropicales
action du vent
et flux de flottabilité Réchauffement en surface
Mers Atlantique Nord :
re indonésiennes formation
m remo d’eaux denses
on
Profondeur
tée ntée s
ans al
sa légem
nsa ent
llé
g em Indo-Pacifique :
Antarctique : en remontée par
formation t allégement
d’eaux denses
Eaux denses
Eaux denses antarctiques nord-atlantiques
NordTalley
5500(2013)
6000
• Deux
−60 cellules
−50 −40 imbriquées : circulaIon
−30 −20 −10 0 10 en huit.
(c) Oxygen (µmol kg–1): Pacific Ocean at 165°–170°W
0 240
210 200 Figur
500 220 210 80
60 (b) In
220 230
200
40 The 3
1000 210
190
180
180 20 maxi
1500 160 North
40
100
2000 170 150 60
the o
110 80
S Ocea
2500 >
34 150 140 130 120
salini
3000 220 .7 110
γN =
3 160
120
130
180
3500 210 170
140 cores
150
200 190 160 Wate
4000
nents
170
4500 180
150 maps
210 190
5000 mark
160
inform
5500 200
prop
190
6000 Exper
−70 −60 −50 −40 −30 −20 −10 0 10 20 30 40 50
2011;Talley (2013) Indo-Pacifique
• Deux cellules imbriquées : circulaIon
Nord en huit.
Eaux superficielles
Océan Austral : tropicales/subtropicales
action du vent
et flux de flottabilité Réchauffement en surface
1Atlantique
km Nord :
?
Mers
re indonésiennes formation
m remo d’eaux denses
on
Profondeur
tée ntée s
ans al
?
sa légem
n ent
sa 2.5 km
X
llé
g em Indo-Pacifique :
Antarctique : en remontée par
formation t allégement
d’eaux denses
4 km
Eaux denses
Eaux denses antarctiques nord-atlantiques
NordI. Découverte de la circula)on
thermohaline
II. Moteurs de la circula)on
thermohaline
III. Une strate exclue de la circula)onLes courants océaniques proviennent de…
1. L’acIon du vent sur la surface
2. Les échanges d’eau et de chaleur à la surface
3. Le chauffage géothermal
4. L’a`racIon gravitaIonnelle de la Lune et du Soleil
Source : NASASource : NASA
(a)        1. L’ac)on
      Mean wind stress anddu vent sur
                           momentum fluxla1984–2006
                                           surface (N/m2)                    (b
                                                                0.2 N/m2

      -0.2 -0.15 -0.1 -0.05   0   0.05    0.1    0.15     0.2
                    Tension de vent (N/m2)
                                  Source : Ocean circulaIon and climate,
                                                             Source : NASA 2014
Le moteur essen)el des courants superficiels…
Source : NASA…et de l’ascendance australe
Source : NASA2. Les échanges d’eau et de chaleur à la surface
Sea&surface&density&
Sea&surface&density&
Densité à la surface (kg/m3)
Source : World
SourceOcean
: NASA AtlasUn moteur des courants descendants
Source : NASA3. Le chauffage géothermal
Flux de chaleur au fond de l’océan (mW/m2)
Source Source
: Lucazeau
: NASA 2019Un moteur de l’allégement abyssal
Source : NASA4. L’aCrac)on gravita)onnelle de la Lune et du Soleil
Ondes
de marée Courant
de marée
Turbulence
Source : NASAUn moteur de l’allégement en profondeur
Source : NASAFebruary, 1996, a period encompassing both in this region, we estimate that K between instability and breaking of such waves
Le mélange dû à la marée interne
spring and neap tides. Turbulent diffusivity 3960 and 4060 m was 0.3 3 1024 to 0.6 3 would provide an energy source for the tur-
bulent mixing. Consistent with this idea,
enhanced fine-scale shear and strain (17)
Fig. 1. Distribution of HRP were observed above rough bathymetry. We
stations (triangles) in the Bra- wave
propose that the energy break
source for the inter-
internal Ide
zil Basin of the South Atlantic nal waves supporting the mixing near the
Ocean. Isobaths greater than MAR is the barotropic tides impinging on
ρ1
2000-m depth are depicted
with a contour interval of local mixing the rough bathymetry of the ridge. (Mean
1000 m. The expanded scale )dal flow
plot to right shows the ship Diffusivity (m 2 s-1 ) 10-5 >10-4 >10-3
tracks during injection of the 10-5 10-2
0
SF6 tracer (solid lines). The
remote mixing
dashed lines mark the sam-
pling tracks of the initial trac- ρ2 500
er survey.
1000
P HYSICAL PROBLEM
Brazil Basin 1500
0 2000
Tracer injection level
Pressure (dbar)
-500
2500
-1000
-1500 3000
-2000
Transect of turbulent diffusivity
Water depth (m)
3500
-2500
-3000 across the Brazil Basin.
4000
-3500 4500
-4000
From Polzin et al. (1997).
5000
-4500
5500
-5000 24 28 32 36 40 44
Minutes latitude (+21° S)
-5500
Fig. 3. Profiles of average cross-isopycnal diffu-
-6000 sivity versus depth as a function of position rel-
-38 -36 -34 -32 -30 -28 -26 -24 -22 -20 -18 -16 ative to a spur of the MAR (whose bathymetry is
Longitude
shown versus latitude). Diffusivity profiles have
been offset horizontally to roughly correspond to
their physical position relative to the spur and are
0 0.1 0.2 0.3 0.4 0.5 0.6 0.7 0.8 0.9 2.0 5.0 8.0 22.0
plotted on a logarithmic axis. The tick marks and
Diffusivity (10-4 m2s-1)
color scheme denote decadal intervals, and theMethodologie d’une cartographie
Mode-by-mode tracking of energy from sources to sinks
GENERATION PROPAGATION DISSIPATION
2D 3D
Lagrangian
modes 1-5 energy critical slopes
tracker
shoaling
wave-wave
interactions
modes 6-10
scattering by
abyssal hills
abyssal hills
(modes 50)
[Falahat et al. 2014b] [Ocean Modelling 2019] [JAMES 2020]
[Melet et al. 2013a]Methodologie d’une cartographie
StaIc 2D maps of depth-integrated dissipaIon VerIcal structures
GENERATION PROPAGATION DISSIPATION
2D 3D
Lagrangian
modes 1-5 energy critical slopes
tracker
shoaling
wave-wave
interactions
modes 6-10
scattering by
abyssal hills
abyssal hills
(modes 50)
[Falahat et al. 2014b] [Ocean Modelling 2019] [JAMES 2020]
[Melet et al. 2013a]4 cartes staIques…
4 cartes staIques…

Wave-wave             Shoaling
interacIons            95 GW
  636 GW                (9%)
   (61%)

 CriIcal              Abyssal
  slopes                hills
 128 GW               185 GW
  (12%)                (18%)
…et 4 structures verIcales

            N2
  Gregg 1989                            N
  Polzin et al. 1995               Legg 2014
  Kunze 2017

 exp(-hab/Hcri)            rbot:        (1+hab/Hbot)-2
St Laurent et al. 2002
                         1-rbot:        N2
                                      Polzin 2004
Une carte 3D réaliste de la diffusivité
de Lavergne et al. 2019, 2020Une carte 3D réaliste de la diffusivité
Munk
1966
scarce seafloor, weak mixing
abundant seafloor, strong mixing
de Lavergne et al. 2019, 2020flows. Budget de densité à la Walin (1982)
Gouretski & Koltermann 2004 de Lavergne et al. 2020
g ? stand
Kflows to respectively
incrop areas,for
wethe
firstvelocity
set out and turbulent
the link diffus
between c
to
caldensity surfaces,
structure referred
of diffusive to asfluxes.
density the dianeutral direction.
Within the 40 S-4
y-state density of
inear equation budget
state, reduces to a vertical
an assumption advective-diffu
that will be relaxed b
d as a vertical coordinate, we can rewrite the dianeutral vel
Local density balance
e of the
! diffusive
@z = @z (Kdensity
? @z flux:
).
! = @ (K? @z ) .
4flows. Budget de densité à la Walin (1982)
Gouretski & Koltermann 2004 de Lavergne et al. 2020
Geochemistry, Geophysics, Geosystems 10.1029/2019GC00
g ? stand
Kflows to respectively
incrop areas,for
wethe
firstvelocity
set out and turbulent
the link diffus
between c
to
caldensity surfaces,
structure referred
of diffusive to asfluxes.
density the dianeutral direction.
Within the 40 S-4
y-state density of
inear equation budget
state, reduces to a vertical
an assumption advective-diffu
that will be relaxed b
d as a vertical coordinate,
Local density balance
we can rewrite the
Lucazeaudianeutral
2019 vel
e of the
! diffusive
@z = @z (Kdensity
? @z flux:
).
! = @ (K? @z ) .
Geothermal heat flux (mW/m2)
4 Figure 8. Global heat flow map based on similarities with (a) 2 observables, (b) 14 observablApplication à l’océan mondial
Tidal mixing + geothermal heaIng
27
27.2 Upper
Neutral density (kg m -3 )
(0-1 km)
27.4
27.6
Mid-depth
27.8 (1-2.5 km)
28
Abyssal
28.2
(> 2.5 km)
28.4
0 5 10 15 20
Dianeutral upwelling (Sv)Application à l’océan mondial
Tidal mixing + geothermal heaIng
27
27.2 Upper
Neutral density (kg m -3 )
(0-1 km)
27.4
27.6
Mid-depth
27.8 (1-2.5 km)
28
Abyssal
28.2
(> 2.5 km)
28.4
0 5 10 15 20
Dianeutral upwelling (Sv)Trois régimes océaniques
Ventilated pycnocline
Munk regime
Topographic regime
Munk 1966, de Lavergne et al. 2017Trois régimes océaniques
Ventilated pycnocline
Munk regime
Topographic regime
Munk 1966, de Lavergne et al. 2017I. Découverte de la circula)on
thermohaline
II. Moteurs de la circula)on
thermohaline
III. Une strate exclue de la circula)onLa circulation thermohaline en 2013
Southern Ocean Indian and Pacific Oceans Atlantic Ocean
27.5 1
UC
DW
LC
2
D
Depth (km)
Antarctica
W
28
Mixing-driven
lightening 3
NADW
28.11 4
AABW
5
60ºS 40ºS 20ºS Eq. 20ºN 40ºN
Southern Ocean Indian and Pacific Oceans Atlantic OceanLa circulation thermohaline en 2013
Southern Ocean Indian and Pacific Oceans Atlantic Ocean
27.5 1
UC
DW
LC
2
D
Depth (km)
Antarctica
W
28
Mixing-driven
lightening 3
NADW
28.11 4
AABW
5
60ºS 40ºS 20ºS Eq. 20ºN 40ºN
Southern Ocean Indian and Pacific Oceans Atlantic OceanAABW
La circulation thermohaline en 2022 ? 5
60ºS 40ºS 20ºS Eq. 20ºN 40ºN
Southern Ocean Indian and Pacific Oceans Atlantic Ocean
27.5 1
Diffusion/Recirculation
2
Depth (km)
Antarctica
28
3
NADW
28.11 Lightening 4
(mixing+geothermal)
AABW
5
60ºS 40ºS 20ºS Eq. 20ºN 40ºNIllustration : une section à travers le Pacifique
Illustration : une section à travers le Pacifique
Illustration : zoom sur l’océan austral

Subpolar seas   ACC              Pacific (210ºE)

                               Indo-Pacific

   Current
    view

                               Atlan)c

                               Talley 2013; Gouretski & Koltermann 2004
Illustration : zoom sur l’océan austral
Subpolar seas ACC Pacific (210ºE)
Hypothesis:
weak net
upwelling
Atlan)c + Indo-PacificIndice : distribution du volume de l’océan austral
Indice : vorticité potentielle dans l’océan austral
Conclusions
• La circula)on thermohaline est un concept fluctuant.
  Ø Mais ses schémas sont extrêmement influents.

• Des cartographies du mélange et du chauffage
  géothermal permeCent de quan)fier ces moteurs.
   Ø Impliquent un allégement confiné aux grandes
     profondeurs (> 2.5 km).

• La circula)on thermohaline pourrait délaisser une
  strate de mi-profondeur (25-30 % du volume total).
   Ø Ce qui réduirait son influence sur les traceurs, la
     venIlaIon, le climat.
You can also read