Spanish wholesale electricity price dynamics - 18 May 2020 - El Periodico de la Energía
←
→
Page content transcription
If your browser does not render page correctly, please read the page content below

Spanish wholesale electricity price dynamics
Kim Keats-Martínez
+34 606 235 149
kkeats@ekonsc.com                                       18 May 2020
Steven Taylor
+34 629 67 92 83
staylor@ekonsc.com

                                                    Members of UNEF (Spanish
                                                      Solar PV Association)
DISCLAIMER

                                                               Copyright © 2020 EKON strategy consulting

                                                                            All rights reserved
Unless prior written consent has been provided, this report and/or presentation (hereinafter “publication) is provided to the legal entity identified on the front cover for
                                                                           its internal use only.
No part of this publication June be reproduced, stored in a retrieval system or transmitted in any form or by any means electronic, mechanical, photocopying, recording
or otherwise without the prior written permission of EKON strategy consulting (EKON). Should you wish to share this publication for a particular project with an affiliate,
                               shareholder or another party, prior written permission is required for which there June be an additional fee.

                                                                                 Important
This publication contains confidential and commercially sensitive information. Should any requests for disclosure of information contained in this document be received
 (whether pursuant to; the Freedom of Information Act 2000, the Freedom of Information Act 2003 (UK), the Freedom of Information Act 2000 (UK), or otherwise), we
     request that we be notified in writing of the details of such request and that we be consulted and our comments taken into account before any action is taken.

                                                                                Disclaimer
  While EKON considers that the information and opinions given in this work are sound, all parties must rely upon their own skill and judgement when making use of it.
   EKON does not make any representation or warranty, expressed or implied, as to the accuracy or completeness of the information contained in this report and/or
 presentation and assumes no responsibility for the accuracy or completeness of such information. EKON will not assume any liability to anyone for any loss or damage
                                                               arising out of the provision of this report.

  The report and/or presentation June contain projections that are based on assumptions that are subject to uncertainties and contingencies. Because of the subjective
      judgements and inherent uncertainties of projections, and because events frequently do not occur as expected, there can be no assurance that the projections
contained herein will be realised and actual results June be different from projected results. Hence the projections supplied are not to be regarded as firm predictions of
 the future, but rather as illustrations of what might happen. Parties are advised to base their actions on an awareness of the range of such projections, and to note that
                                                     the range necessarily broadens in the latter years of the projections.

                                                                                                                                                                          2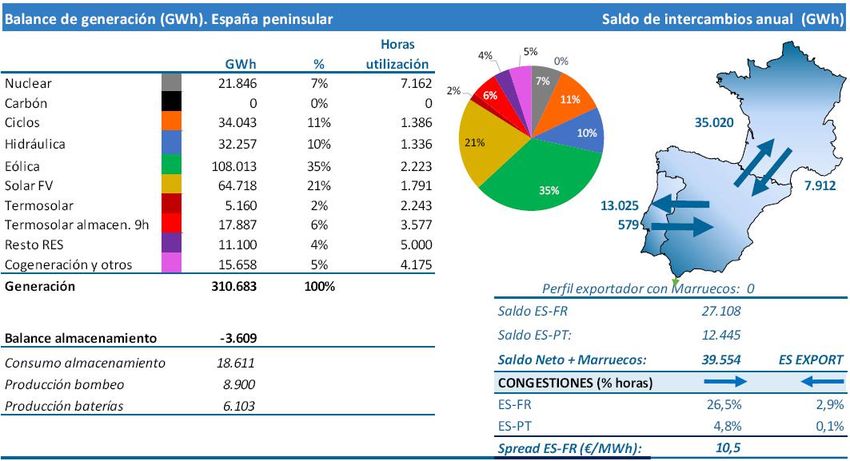
EKON’S SERVICE RANGE IN THE ENERGY SECTOR
Broad range of services to financiers, utilities,
IPPs and governmental agencies.
Team background in energy consulting,
strategic advisory and project development.
Expert witness testimony in arbitration
hearings of renewable arbitrations and
commercial arbitrations between gas buyers
and sellers.
Regulatory and market due diligence reports
that are relied upon by lenders.
Supported successful completion of 52GW
with a transaction value of US$35 billion.
3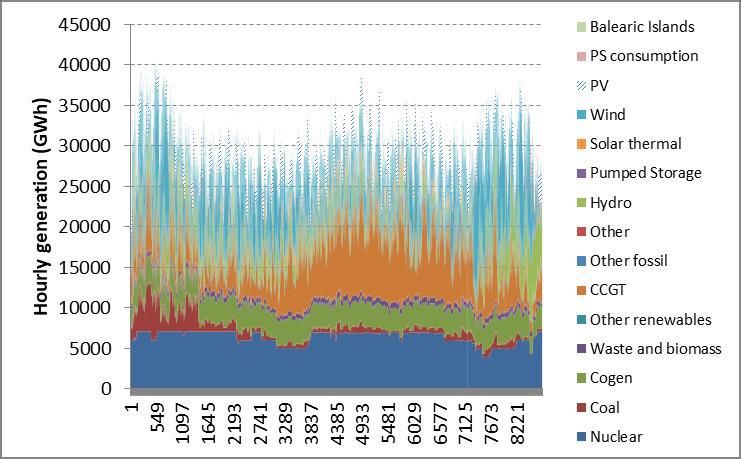
SPANISH ELECTRICITY MARKET ANALYSIS
Spanish Electricity Price Dynamics
Background
Key concepts
Impact of COVID19
Modelling assumptions
Modelling results
Thoughts on PNIEC
Final comments
4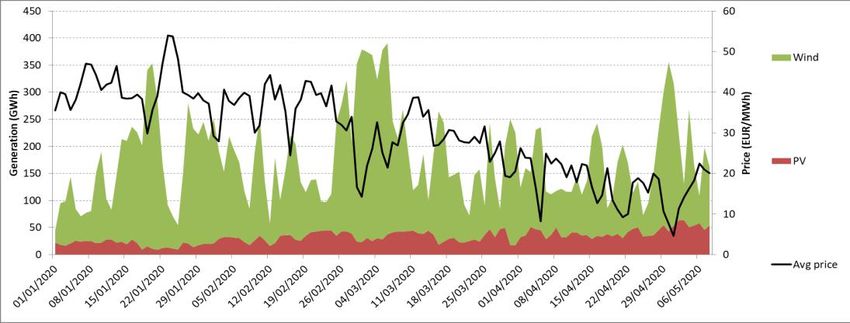
HISTORICAL CAPACITY MIX
We are not building renewables cause the lights are about to go out…
Evolution of installed capacity Capacity mix (2019)
Source: REE and EKON calcs. Source: REE and EKON calcs.
5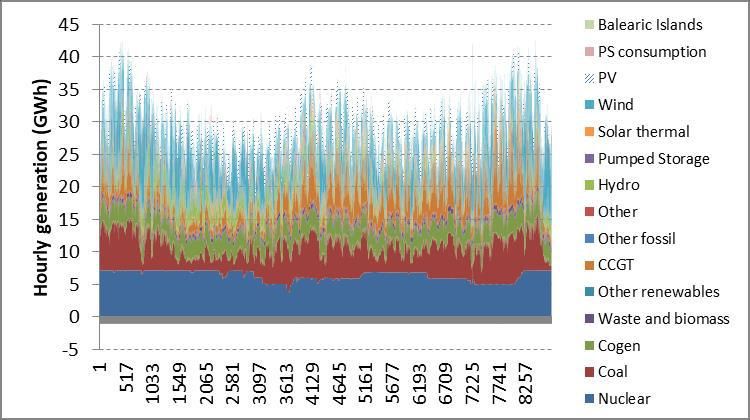
SPANISH ELECTRICITY MARKET ANALYSIS
Spanish Electricity Price Dynamics
Background
Key concepts
Impact of COVID19
Modelling assumptions
Modelling results
Thoughts on PNIEC
Final comments
6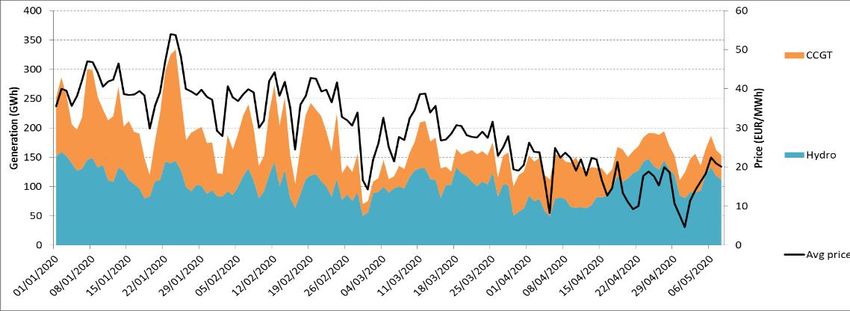
WHAT TO MAKE OF MARKET OUTCOMES?
Hourly data for 2017 and 2019 shows volatility of market prices and generation.
2017
2019
CCGT
Coal
gone
Source: REE ESIOS.
7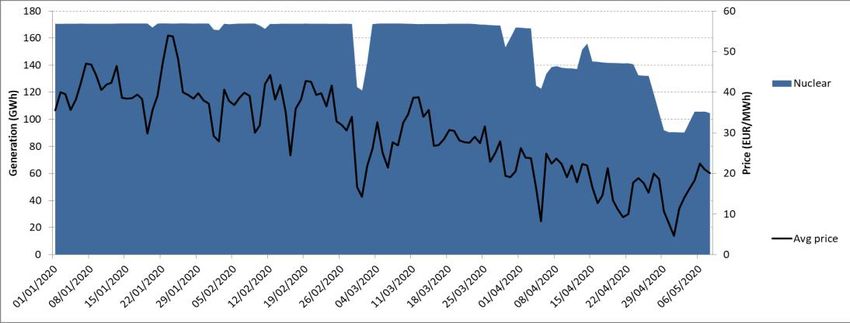
THE CHICKEN (DUCK?) AND EGG PROBLEM…
Market participants make an assessment of profits from the energy market. Renewables energy
sources (“RES”) are price takers but will still affect market outcomes thereby reducing their
remuneration the more they produce.
Without RES With RES
SRMC only
Price (€/MWh) Price (€/MWh)
Merit order
curve
Energy margins
MW
A B C D E F RES A B C D E F
(Additional
supply)
Source: EKON.
Recap https://www.youtube.com/watch?v=pHrUIGTlqt4&feature=youtu.be.
8
PV SATURATION REACHED WHEN REALISED PRICE OF PV = LCOE
PV4
Demand PV3
(MW)
Daily demand
profile Consider simple 24-hour set-up with
gas-fired CCGT. As you add PV
PV2 capacity (PV1, PV2) prices will still be
set by CCGT. After a point, the prices
PV dispatch curves
PV1 drop.
Hour
of day After market reaches saturation
point, there is no commercial
SRMC
PV1,2 incentive to build more PV. (Note
(EUR/MWh) that this point has no “missing
money” problem, which happens
SRMC
CCGT
when deployment is pushed beyond
PV4
this limit .)
PV3
SRMC
PV (0)
Source: EKON.
Recap https://www.youtube.com/watch?v=pHrUIGTlqt4&feature=youtu.be.
9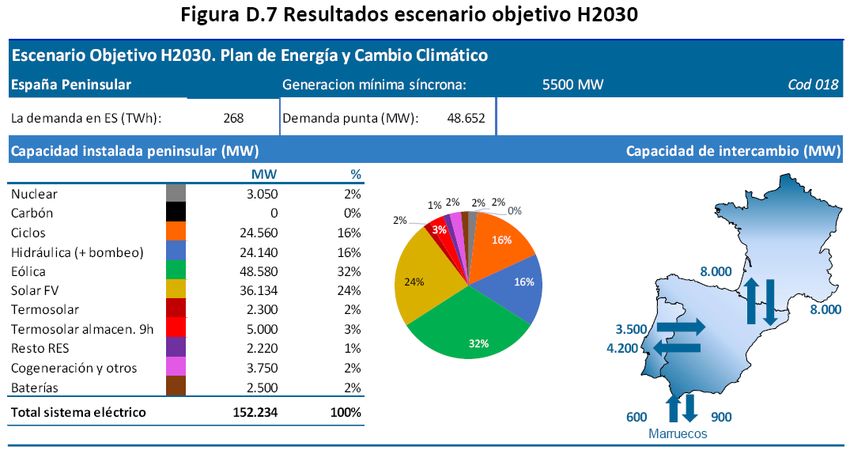
Impact of COVID-19
Background
Key concepts
Impact of COVID19
Demand for electricity
Thermal generation cost and prices
Modelling assumptions
Modelling results
Thoughts on PNIEC
Final comments
10EVOLUTION OF DEMAND IN 2020
Hourly demand profiles (synched by weekday) for Spain. If you see orange this indicates a drop in
demand relative to the same period in 2019.
But note that demand is affected by other things too: February had good weather. Beware weekly
comparison: Easter Sunday was in mid April this year (12 April) and end of April last year (21 April).
Pay attention to moving average/trend. Assuming demand reduction stabilises at say -12% for the
rest of the year, looking at reduction in annual demand of 9%.
IMF WEO April 2020 expects GDP growth of -8% in 2020 and 4.3% in 2021. Expect some recovery of
demand in 2021…
Monday 16 March (lockdown starts 15 March)
-6.3% 0.1% -6.3% -2.9% 1.1% -7.4% -19.7% -10.6% -12.1% Weekly %
-2.6% -5.3% -3.8% -0.9% -1.4% -9.2% -25.1% -12.5% -14.4% changes
Easter Sunday 2020 Easter Sunday 2019
Source: ENTSO-E.
11WHAT HAPPENS WHEN DEMAND FALLS?
If the demand falls and the capacity
PV4
Demand PV5 is equal to that of the starting point,
(MW) there will be more hours with a low
Daily demand
price.
The solution is to decrease the
penetration of PV so that the PV
realised price does not fall below the
Levelised Cost of Electricity (“LCOE”).
Hour (24)
Notice that the distribution of prices
Marginal cost (positive vs zero prices) is the same
PV4
PV4,5
(EUR/MWh)
with CCGT retaining pivotal role!
SRMC CCGT
SRMC PV (0)
Source: EKON.
12Impact of COVID-19
Background
Key concepts
Impact of COVID19
Demand for electricity
Thermal generation cost and prices
Modelling assumptions
Modelling results
Thoughts on PNIEC
Final comments
13EVOLUTION OF GENERATION AND PRICES (1)
Daily dispatch by technology and average daily spot prices for Spain in 2020. If you look carefully
one can see how the market works…
Note the large amount of wind, flexibility of nuclear, and continuing balancing role of gas-fired
CCGT.
Source: REE and ENTSO-E.
14EVOLUTION OF GENERATION AND PRICES (2)
Renewable (especially wind) generation is
inversely correlated with average spot
prices. You can see the same thing at the
hourly level.
Programming of nuclear generation has
proven to be flexible, even if this is less
obvious at the hourly level. There is a price
below which nuclear will reduce dispatch
(~15€/MWh).
CCGT retains balancing role with prices
positively correlated with dispatch. Flexible
hydro always tends to shadow price next
most expensive flexible technology, i.e.
CCGT, so dispatch positively correlated with
prices as well. (Note Q2 is height of annual
hydro generation.)
Source: REE and ENTSO-E.
15WHAT HAPPENS WHEN COST OF CONVENTIONAL GENERATION FALLS?
If the cost of generating with a CCGT
PV4
Demand falls - caused by a decrease in the
(MW) PV6 price of natural gas or the cost of
Daily demand CO2 - prices in all hours of PV
operation will fall.
The New PV cannot survive with the
same number of very low priced
hours, so the penetration of PV must
be reduced so that the PV realised
Hour (24) price does not fall below the LCOE.
You have to "close the curtain": the
Marginal cost percentage of low prices has to drop
PV4
(EUR/MWh) enough for the realised price to
stabilise at the LCOE. Means market
SRMC CCGT 1 can absorb less PV than before!
SRMC CCGT 2 Do we need to reassess 2030 targets
and levels of support?
PV6
SRMC PV (0)
Source: EKON.
16SPANISH ELECTRICITY MARKET ANALYSIS
Spanish Electricity Price Dynamics
Background
Key concepts
Impact of COVID19
Modelling assumptions
Modelling results
Thoughts on PNIEC
Final comments
17PMM IN A NUTSHELL
PMM (Power Market Model) is
Load
designed to replicate the duration
curve
Cost
(€/MMBtu) Cost curves
1 Demand for all fuels 2
operations of the actual power (MW)
(seasonal)
(oil, gas,
coal…)
CCGT
system about which one is
Steam
Steam
Technical and
concerned. Hour Years cost
GT
Thermal
characteristics
efficiency
Available for all plant
types
By including the economic and Capacity
(MW)
generating
capacity and
peak Plant type
environmental constraints demand
facing market participants in Years
7 3
Alternative
the real world, PMM replicates Capacity
costs for
increasing Electricity
Merit
order
how actual decisions are made Premium
(€/kWy)
generating
capacity
Cost
(€/MWh)
by stakeholders when subject
Capacity Capacity
to any slate of operational New entrant,
(MW) (MW)
Cost retrofit,
constraints, regardless of (€/kWy) repowering
costs
whether these constraints are analysis
Load factor
Interconnector
capacity and
physical, economic, or developments
environmental. 6 5
Emissions
And everything in MS EXCEL. (tonnes) CO2, SO2,
and NOX 4
CO2, SO2, emission
Emissions or NOX limits production
limit (tonnes)
Years Output
(MWh)
18OVERVIEW OF SENSITIVITIES
Low Case Central Case High Case NECP growth adjusted for
(Low1_20200507) (Ref1_20200507)
(High1_20200507) COVID19 (-8pp/+4.3pp in
2020/21). Crude oil and
Demand growth COVID+NECP BAU COVID+NECP BAU COVID+NECP Target
international coal price
World Bank World Bank forecasts based on World Bank
Fuel prices WB+30%
(April 2020) (April 2020) (Apr 2020).
CO2 (EUA prices) 25€/tCO2 25€/tCO2 IEA WEO 2018 NPS CO2 prices set at 25EUR/tCO2
or IEA’s WEO 2018 New
Domestic coal surcharge None None Applied Policies Scenario (“NPS”).
The High Case applies
Annual output caps
IED coal output cap None None
applied
transportation surcharge for
domestic coal and a more
Green Cent Tax None Applied to Coal Applied to Coal restrictive view of the
implementation of the
Generation Tax (7%) None Phasing out Phasing out Industrial Emissions Directive
(“IED”).
Most important
Annual hours for
2050 1739 (historical) 1739 (historical) Existing auction (2016-2017)
New PV
Annual hours for projects and 1.5GW of New PV
3000 2500 2166 (historical) in 2020 and 2021 as “firm”.
New Wind
TIC of New Wind and PV Apply annual caps on the
-20% 1000 and 750 1000 and 750 deployment of other
(EUR/KW)
Annual cap on New Wind 5/4GW from 2020, “economic” New Wind and PV
2.0/1.5GW from 2023 2.0/1.5GW from 2023
and PV (from 2020) uncapped from 2031 until 2030 in the Low Case but
Note: Prices real 2020 €. forever in other cases.
19SPANISH ELECTRICITY MARKET ANALYSIS
Spanish Electricity Price Dynamics
Background
Key concepts
Impact of COVID19
Modelling assumptions
Modelling results
Thoughts on PNIEC
Final comments
20MARKET PRICE FORECASTS
Baseload price forecasts
Prices first move in line with commodity
P1 P2 P3
prices (P1) then plateau (P2).
As a lot of thermal capacity retires in the
2030s, a step-up in prices is expected in the
Central and High Cases (P3).
But even in these cases, renewable capacity
eventually catches up and prices drop.
Source: EKON 2020Q2. Prices real 2020 €.
21REALISED PRICE FORECASTS
The PV and Wind Capture Prices track the
market price. But as more renewable
PV Capture Price
capacity is introduced, the Capture Prices
tend to drop below the baseload price.
EKON remains optimistic that profitability of
renewables will be satisfactory But we are
also more pessimistic since we do not
believe that market conditions (grid and
planning constraints, project "bankability",
liquidity of PPAs, etc.) are adequate to
reach the government’s aggressive capacity
goals under the NECP.
Wind Capture Price
Source: EKON 2020Q2. Prices real 2020 €. Dashed line = Baseload prices.
22PV AND WIND CAPTURE PRICE SPREADS
EKON predicts that the PV Capture Price
PV Capture Price Spread
Spread will go from positive to dropping to
between -5% to -12% (on average). The Wind
Capture Price Spread will fall less.
When New PV and New Wind capacity are
deployed until the Capture Prices converge on
LCOE levels, since New Wind is “quasi-
baseload” (since the wind blows both during
the day and at night), then
1. Wind Capture Price Spread = ~0
2. PV Capture Price Spread =
Wind Capture Price Spread
~(LCOE PV – LCOE Wind) / LCOE Wind
Source: EKON 2020Q2.
23SPANISH ELECTRICITY MARKET ANALYSIS
Spanish Electricity Price Dynamics
Background
Key concepts
Impact of COVID19
Modelling assumptions
Modelling results
Thoughts on PNIEC
Final comments
24ACHIEVING THE NECP 2030 TARGETS
Share of renewable generation in EKON 2030 projections
Central Case is 67.4% and 71.8% in the Low
Case (compared to 74% target in NECP).
NECP capacity targets too aggressive since
assume historical hours for renewables,
and massive increase in exports (even to
Portugal).
What if the government pursues aggressive
targets that exceed saturation point?
o Auctions for new capacity only will
undermine merchant market and be
open to legal challenge for
discrimination.
o Better to use market for green
certificates with firm targets and open
to all. (With bonus of no “missing
money” problem even if one exceeds
saturation points.)
Source: Plan Nacional Integrado de Energía y Clima 2021-2030 (“PNIEC”), EKON 2020Q2.
25AND BEWARE PNIEC ASSUMPTIONS
Note increase in
interconnections
Source: PNIEC Annex D.
26CAPACITY MAY NOT NEED TO BE THAT HIGH
Historical
hours
~13% of
generation for
export?
Source: PNIEC Annex D.
27SPANISH ELECTRICITY MARKET ANALYSIS
Spanish Electricity Price Dynamics
Background
Key concepts
Impact of COVID19
Modelling assumptions
Modelling results
Thoughts on PNIEC
Final comments
28FINAL COMMENT
What if government targets capacity that exceeds saturation points? Let’s hope they don’t
discriminate between different cohorts of assets! Setting an aggressive green energy target (GWh)
and backing this up with tradable green certificates would ensure that all investors - old and new -
are protected from the inevitable electricity price crash.
So get informed and if you want to take a view on realised prices for PV or wind, think about these:
o Demand growth
o Fuel prices
o EUA prices
o Taxes (Green Cent Tax, Generation Tax)
o Industrial Emissions Directive (“IED”) and coal closure
o Lifetime limit for existing plants (cogeneration and renewables included)
o Hydrology
o Operational hours for New Wind and PV
o Capex, leverage and cost of capital of New Wind and PV
Especially these!
o Rate of deployment of New Wind and PV (including rooftop)
o Measures to meet PNIEC targets
29You can also read