Glenmede Quantitative U.S. Large Cap Growth Equity First Quarter 2021 Review - Alexander Atanasiu, CFA Portfolio Manager/Analyst

Page created by Katie Swanson
 
CONTINUE READING
Glenmede Quantitative U.S. Large Cap Growth Equity First Quarter 2021 Review - Alexander Atanasiu, CFA Portfolio Manager/Analyst
For Institutional Investor Use Only.

Glenmede Quantitative U.S. Large Cap Growth Equity   Alexander Atanasiu, CFA
First Quarter 2021 Review                            Portfolio Manager/Analyst
In the first quarter, small cap outperformed large cap
                                                                                               Russell Style Performance
                                                                                                               One-year ending
                                                                                                              December 31, 2020

                                  LG – Growth stocks in Russell Top 200 Growth Index                  MG – Growth stocks in Russell Mid Cap Growth Index                    SG – Growth stocks in Russell 2000 Growth Index
                                  LB – Stocks in Russell Top 200 Growth and Value Indexes             MB – Stocks in Russell Mid Cap Growth and Value Indexes               SB – Stocks in Russell 2000 Growth and Value Indexes
                                  LV – Value stocks in Russell Top 200 Value Index                    MV – Value stocks in Russell Mid Cap Value Index                      SV – Value stocks in Russell 2000 Value Index

Sources: Glenmede Investment Research and FactSet
All data as of 3/31/2021, unless otherwise noted. This represents past performance which is not indicative of future results. As with all investments, loss is possible. See Additional Disclosures at the end of this document. For Institutional Investor Use Only.

                                                                                                                                             Very wide dispersion in equity style returns
In the first quarter, small cap outperformed large cap
                                                                                              Russell Style Performance
                                                                                                           Quarter-to-date ending
                                                                                                              March 31, 2021

                                                                                                                                                                                                                23.7%

                                                                                                                                                   15.2%
                                                                                     12.0%                                                                                                  13.3%

                                                                 5.4%                                                          4.9%
                                                                                                                                                                        2.7%

                                            -0.4%
                                                                                                          -4.1%

                                              LG                   LB                  LV                  MG                   MB                   MV                   SG                   SB                  SV

                                  LG – Growth stocks in Russell Top 200 Growth Index                  MG – Growth stocks in Russell Mid Cap Growth Index                    SG – Growth stocks in Russell 2000 Growth Index
                                  LB – Stocks in Russell Top 200 Growth and Value Indexes             MB – Stocks in Russell Mid Cap Growth and Value Indexes               SB – Stocks in Russell 2000 Growth and Value Indexes
                                  LV – Value stocks in Russell Top 200 Value Index                    MV – Value stocks in Russell Mid Cap Value Index                      SV – Value stocks in Russell 2000 Value Index

Sources: Glenmede Investment Research and FactSet
All data as of 3/31/2021, unless otherwise noted. This represents past performance which is not indicative of future results. As with all investments, loss is possible. See Additional Disclosures at the end of this document. For Institutional Investor Use Only.

                                                                                                                                             Very wide dispersion in equity style returns
In March 2021, nine sectors outperformed Russell 1000 Growth Index

                                                                                    Russell 1000 Growth Performance Analysis
                                                                               March 2021                                             Year-to-Date Ending 3/31/2021                                           12 Months Ending 3/31/2021
                                                          Average                   Total             Contribution              Average                  Total             Contribution               Average                Total      Contribution
 Economic Sector                                          Weight                   Return              To Return                Weight                  Return              To Return                 Weight                Return       To Return
 Consumer Discretionary                                            16.4                     2.1                     0.4                  16.8                    -1.0                    -0.1                  16.0             86.4            12.4
 Consumer Staples                                                    4.3                    7.9                     0.3                    4.3                   -0.7                    -0.0                    4.5             31.6            1.7
 Energy                                                              0.1                    7.0                     0.0                    0.1                  19.6                      0.0                    0.1           103.1             0.1
 Financials                                                          1.9                    3.4                     0.1                    1.8                    2.7                     0.0                    2.1             41.4            1.2
 Health Care                                                       13.6                     1.4                     0.2                  13.7                     1.3                     0.2                  14.1              37.5            6.3
 Industrials                                                         4.7                    7.1                     0.3                    4.6                    3.4                     0.2                    5.4             50.8            3.1
 Information Technology                                            44.6                     -0.3                   -0.2                  44.9                    -0.7                    -0.4                  43.3              71.8           29.0
 Materials                                                           0.8                    6.8                     0.1                    0.8                    0.9                     0.0                    0.9             52.9            0.6
 Real Estate                                                         1.6                     7.9                    0.1                    1.6                    7.1                     0.1                    1.9             22.2            0.6
 Communication Services                                            11.8                      3.5                    0.4                  11.5                     8.4                     0.9                  11.4              72.0            7.7
 Utilities                                                           0.0                     3.3                    0.0                    0.0                    1.3                     0.0                    0.0            22.7             0.0
 Total                                                           100.0                      1.7                     1.7                100.0                      0.9                    0.9                 100.0              62.8           62.8

Source: Glenmede Investment Management LP, FactSet All information is as of 3/31/2021, unless otherwise noted, and is subject to change. The views expressed represent the opinions of GIM’s portfolio managers.
Past performance is not indicative of future results. Investing involves risk and as with all investments, loss is possible. See Additional Disclosures at the end of this document. For Institutional Investor Use Only.

                                                                                                                                                           Wide range of sector returns in 2020
In March 2021, stocks with higher valuations and negative earners underperformed

                                                                                       Russell 1000 Growth Performance Analysis
                                                                                  March 2021                                               Year-to-Date Ending 3/31/2021                                  12 Months Ending 3/31/2021

                                                             Average                   Total              Contribution               Average                   Total             Contribution         Average        Total     Contribution
 Price to Earnings                                           Weight                   Return               To Return                 Weight                   Return              To Return           Weight        Return      To Return
 P/E > 25                                                             83.4                      1.4                     1.2                   83.2                     -0.1                    -0.2        77.4         62.6           41.6
 P/E 20 - 25                                                            6.1                     9.6                     0.6                     6.0                   12.9                      0.9         8.9         60.2            8.7
 P/E 15 - 20                                                            3.3                   11.5                      0.4                     3.3                   10.0                      0.4         6.6         60.7            6.6
 P/E 0 - 15                                                             1.3                   10.3                      0.1                     1.2                   12.2                      0.2         2.2         71.3            2.7
 P/E < 0                                                                6.0                    -8.7                    -0.6                     6.2                    -4.4                    -0.3         5.0         89.2            3.2
 Total                                                              100.0                       1.7                     1.7                 100.0                       0.9                     0.9       100.0         62.8           62.8

Source: Glenmede Investment Management LP, FactSet (P/E based on trailing 12-month earnings)
All information is as of 3/31/2021, unless otherwise noted, and is subject to change. The views expressed represent the opinions of GIM’s portfolio managers. Past performance is not
indicative of future results. Investing involves risk and as with all investments, loss is possible. See Additional Disclosures at the end of this document. For Institutional Investor Use Only.

                                                                                                                                    In 2020, Stocks with high valuations or negative earnings outperformed
First quarter attribution summary

                                                                                                                                                                                                         3M         12M
     In First Quarter, multi-factor and industry group models:                                                                                 Portfolio Total Return (gross of fees)                        8.5     61.2
                                                                                                                                                Portfolio Total Return (net)                                  8.3     60.1
      Positive performance
                                                                                                                                                Russell 1000 Growth Index Total Return                        0.9     62.8
                                                                                                                                                 Portfolio Spread (Net)                                       7.4     -2.7
                                                                                                                                                Russell 1000 Growth Performance
     Quantitative Models
                                                                                                                                                 P/E >25                                                  -0.1        62.6
      +3.4% (Value factors +2.5%)                                                                                                                P/E
Sector attribution analysis summary

                                                                Quant U.S. Large Cap Growth (%)                                    Russell 1000 Growth (%)                                                  Attribution analysis (%)
  Sector                                                          Average             Total              Contrib.           Average                Total              Contrib.           Allocation             Selection     Interaction      Total
                                                                   weight            return             to return            weight               return             to return               effect                effect          effect     effect
  Communication Services                                               11.3              2.3                   0.3               11.5                 8.4                   0.9                   0.0                -0.7              0.0      -0.7
  Consumer Discretionary                                               15.2            16.8                    2.4               16.8                -1.0                  -0.1                   0.0                2.9               -0.4     2.5
  Consumer Staples                                                       5.8             1.6                   0.1                4.3                -0.7                   0.0                   0.0                0.1               0.0      0.1
  Energy                                                                   --              --                    --               0.1               19.6                    0.0                   0.0                  --                --     0.0
  Financials                                                             3.2            -0.9                   0.0                1.8                 2.7                   0.0                   0.0                -0.1              0.0      -0.1
  Health Care                                                          13.2              8.0                   1.1               13.7                 1.3                   0.2                   0.0                0.9               -0.1     0.8
  Industrials                                                            3.9            -2.6                  -0.2                4.6                 3.4                   0.2                   0.0                -0.3              0.0      -0.3
  Information Technology                                               43.2            10.2                    4.5               44.9                -0.7                  -0.4                   0.0                4.9               -0.2     4.8
  Materials                                                              2.3           14.4                    0.3                0.8                 0.9                   0.0                   0.0                0.1               0.2      0.3
  Real Estate                                                            1.4             6.5                   0.1                1.6                 7.1                   0.1                   0.0                0.0               0.0      0.0
  Utilities                                                                --              --                    --               0.0                 1.3                   0.0                   0.0                  --                --     0.0
  Unassigned                                                               --              --                    --               0.0              -13.1                    0.0                   0.0                  --                --     0.0
  Cash                                                                   0.5             0.0                   0.0                   --                 --                    --                  0.1                  --                --     0.1
  Total                                                              100.0               8.5                   8.5             100.0                  0.9                   0.9                   0.1                7.9               -0.4     7.6

Source: Glenmede Investment Management LP, FactSet
The Russell 1000 Growth Index is an unmanaged, market value weighted index, which measures performance of the largest 1,000 companies in the U.S. equity market that have higher price/book ratios and
higher forecasted growth values. One cannot invest directly in an index. All data as of 3/31/2021, unless otherwise noted. This represents past performance which is not indicative of future results. As with all
investments, loss is possible. Sector weightings are for informational purposes only and do not represent a recommendation or an offer to buy, hold or sell any sector. For Institutional Investor Use Only.

                                                                                                              Most positive stock selection in technology sector, most negative in consumer services sector
Sharp swings and large dispersion in equity factor returns

                      Factor Performance*                                         1-Month                 3-Month 12-Month                                 3-Year                 5-Year         10-Year   20-Year
                      (Sector Neutral)                                             Return                  Return  Return                                  Return                 Return          Return    Return
                      Dividend Yield                                                3.6                      6.3    16.1                                    -4.7                   -1.8            -0.6      -0.2
                      P/E (Act/Est)                                                 5.1                      8.2    26.2                                    -6.0                   -4.3            -1.8       0.6
                      Price/Book                                                    0.4                      2.1     5.8                                    -1.6                   -0.8             0.0       0.9
                      Price/Sales                                                   4.8                      9.1    29.5                                    -4.9                   -2.9            -1.1       1.6
                      Price/Free Cash Flow                                          4.1                      7.3    16.0                                    -5.2                   -4.5            -1.7       1.0
                      Return on Equity                                              0.7                     -2.6    -15.6                                    2.5                    1.2             0.6       0.3
                      Earnings Growth                                               0.9                     -0.2    -11.9                                    1.0                    0.5             0.6      -0.1
                      Estimate Diffusion                                            1.5                      2.4     -7.2                                    0.8                    0.5             1.3       0.8
                      Market Cap                                                    1.1                     -2.7    -27.6                                    2.8                    2.3             1.4      -0.9
                      Price Momentum 12M                                            -0.3                     1.0     -1.0                                    0.6                    0.3             0.6       0.9
                      Long Price Reversion                                          2.8                      9.3    36.3                                    -5.3                   -3.1            -2.5       0.8

*Russell 1000 Universe
Source: Glenmede Investment Management LP, FactSet
The Russell 1000 Index is an unmanaged, market value weighted index, which measures performance of the largest 1,000 companies in the U.S. equity market. One cannot invest
directly in an index. All data as of 3/31/2021, unless otherwise noted. This represents past performance which is not indicative of future results. As with all investments, loss is possible.
Sector weightings are for informational purposes only and do not represent a recommendation or an offer to buy, hold or sell any sector. For Institutional Investor Use Only.

                                                                                                                                                Valuation metrics outperformed in the first quarter
The strategy has outperformed since style reversion in September

                                   Russell 1000 Growth versus Value 1-Year Spread                                                                                 Russell 1000 Value versus Growth –
                                                                                                                                                                           Quarterly Spreads
                            60%                                                                                                  9/1/20:
                                                                                                                                                                    1979 through First Quarter 2021
                                                                                                                                  47.3%
                                                                                                                                                                    Top Ten                           Bottom Ten
                            40%
Rolling 1-Year Spread (%)

                                                                                                                                                            Rank     Spread    Quarter       Rank      Spread      Quarter
                                                                                                                                                              1         24.9    12/00            1       -19.7      12/99
                            20%
                                                                                                                                                              2         15.0      3/01           2       -13.5        6/20
                                                                                                                                         3/31/21:
                                                                                                                                           9.0%               3         13.2      9/00           3       -12.6        3/09
                             0%
                                                                                                                                                              4         10.5      3/93           4       -12.6        3/20

                            -20%                                                                                                                              5         10.3      3/21           5       -10.1      12/98
                                                                                                                                                              6         10.2      6/02           6        -8.4      12/91
                            -40%                                                                                                                              7         10.0      9/86           7        -8.4        6/90
                                                                                                                                                              8          8.5      9/01           8        -7.8        9/80
                            -60%                                                                                                                              9          7.7      3/84           9        -7.8      12/01
                                1998 2000 2002 2004 2006 2008 2010 2012 2014 2016 2018 2020
                                                                                                                                                             10          7.7      3/81           10       -7.7        3/87

Source: FactSet
All data as of 3/31/2021, unless otherwise noted. There can be no assurance that the same factors would result in the same index contributions
or weightings in the future. Past performance is not indicative of future performance. For Institutional Investor Use Only.

                                                                                                                                                 A style reversion has benefitted our strategy
On average, value versus growth cycles have lasted about 4 years
                                                                                                Duration and Magnitude of Book to Price Value Cycles*: 1946 to Present                                                                 Mid 40's
                                                                                                                                                                                                                                       Late 40's
Relative 12M Returns - Top versus Bottom Quintile

                                                    50                                                                                                                                                                                 Early 50's
                                                                                                                                                                                                                                       Mid 50's
                                                                                                                                                                                                                                       Late 50's
                                                    30                                                                                                                                                                                 Early 60's
                                                                                                                                                                                                                                       Mid 60's
                                                                                                                                                                                                                                       Late 60's
                  ( Book/Price)

                                                    10                                                                                                                                                                                 Early 70's
                                                                                                                                                                                                                                       Mid 70's
                                                                                                                                                                                                                                       Late 70's/Early 80's
                                                    -10                                                                                                                                                                                Late 80's/Early 90's
                                                                                                                                                                                                                                       Mid 90's
                                                                                                                                                                                                                                       Late 90's/Early 00's
                                                    -30
                                                                                                                                                                                                                                       Mid 00's
                                                                                                                                                                                                                                       Late 00's
                                                    -50                                                                                                                                                                                Early 10's
                                                          -42   -36   -30           -24           -18       -12     -6             0         6              12              18             24              30                          Mid 10's
                                                                                                                                                                                                                                       Latest
                                                                                                                     Months Pre/Post Minimum

                                                                                                                          Duration in Months              Relative 12-M Return (%)
                                                                                                                     Average      Min        Max        Average      Min       Max
                                                                            Total Length of Value Cycle                48          17        107
                                                                            Drawdown Periods                           25          10         76          -14.7        -46.8        -2.2
                                                                            Recovery Periods                           22           5         61          30.7          6.2         45.5

                                                                            Latest Drawdown Cycle - 7/20                  40     Months
                                                                            Relative Minimum Return (12M)                -28.8   Percent

Sources: Glenmede Investment Management and FactSet, https://mba.tuck.dartmouth.edu/pages/faculty/ken.french/data_library.html
*Relative Book/Price Performance based on Top versus Bottom 12-Month Quintile Returns of stocks on NYSE, AMEX or NASDAQ (Book to market, equal weight). Value cycles defined as six or more consecutive months of outperformance, followed by negative returns.
All data as of 3/31/2021, unless otherwise noted. The views expressed represent the opinions of the portfolio managers. There can be no assurance that the same factors would result in the same index contributions, weightings or decisions being made in the future.
Past performance is not indicative of future performance. For Institutional Investor Use Only.

                                                                                                                                       There have been 19 Value/Growth cycles since the 1940s
10-Yr Treasury Yield has been rising

                                                                Relative Book/Price Performance (Top vs Bottom Quintile) and Average Yield Curve Spread

                                      $1.4                                         3.0                                                                               $2.0                                      3.0                                                                               $1.4                                         3.0

                                                                                                                                                                                                                                                                                                 $1.3                                         2.5
                                      $1.3                                         2.5                                                                               $1.8                                      2.5

                                                                                          Yield Curve, Avg of 10Y-2Y, 10Y-3M

                                                                                                                                                                                                                                                                                                                                                     Yield Curve, Avg of 10Y-2Y, 10Y-3M
                                                                                                                                                                                                                      Yield Curve, Avg of 10Y-2Y, 10Y-3M
                                                                                                                                                                                                                                                                                                 $1.2                                         2.0
                                      $1.2                                         2.0
Growth of $1 in Relative Book/Price

                                                                                                                                                                                                                                                           Growth of $1 in Relative Book/Price
                                                                                                                               Growth of $1 in Relative Book/Price
                                                                                                                                                                     $1.6                                      2.0                                                                                                                            1.5
                                                                                                                                                                                                                                                                                                 $1.1
                                      $1.1                                         1.5
                                                                                                                                                                                                                                                                                                                                              1.0
                                                                                                                                                                     $1.4                                      1.5                                                                               $1.0
                                      $1.0                                         1.0                                                                                                                                                                                                                                                        0.5
                                                                                                                                                                     $1.2                                      1.0                                                                               $0.9
                                                                                                                                                                                                                                                                                                                                              0.0
                                      $0.9                                         0.5
                                                                                                                                                                                                                                                                                                 $0.8
                                                                                                                                                                     $1.0                                      0.5                                                                                                                            -0.5
                                      $0.8                                         0.0
                                                                                                                                                                                                                                                                                                 $0.7
                                                                                                                                                                                                                                                                                                                                              -1.0
                                      $0.7                                         -0.5                                                                              $0.8                                      0.0
                                                                                                                                                                                                                                                                                                 $0.6                                         -1.5

                                      $0.6                              -1.0                                                                                         $0.6                                      -0.5                                                                              $0.5                                     -2.0
                                          2015 2016 2017 2018 2019 2020                                                                                                  1997 1998 1999 2000 2001 2002                                                                                               1977      1979     1981   1983   1985

                                             Growth of $1 B/P        Yield Curve                                                                                            Growth of $1 B/P     Yield Curve                                                                                                Growth of $1 B/P    Yield Curve

Sources: FactSet and Glenmede Investment Management LP (post 1995 – relative price/book performance is on a sector neutral basis)
All data as of 3/31/2021, unless otherwise noted. The views expressed represent the opinions of the portfolio managers. There can be no assurance that the same factors would result in the same index contributions, weightings or decisions being
made in the future. In addition, the securities mentioned may or may not be currently held in the portfolio and are not a recommendation to buy or sell. Past performance is not indicative of future performance. For Institutional Investor Use Only.

                                                                                                                                                                               Historically, value stocks tend to outperform when yield curve steepens after inversions
Russell 1000 Growth Index vs. Russell 1000 Value Index
                                                                                                                Comparative Valuations as of March 31, 2021
                                                                       Price/Book - Relative Multiple                                                           Dividend Yield - Spread                                                     Free Cash Flow Yield*- Spread
                                                            6                                                                                2.5                                                                                   3
                                                                                               Favors Value                                                                        Favors Value                                                                          Favors Value
                                                       5.5
                                                                                                                                                                                                                                   2
                               Growth/Value Multiple        5                                                                                      2

                                                                                                                                                                                                              Value minus Growth
                                                                                                                       Value minus Growth
                                                       4.5                                                      4.49                                                                                                               1                                                     0.99
                                                            4                                                                                1.5                                      Median:                                                                              Median:
                                                                                                                                                                                       1.22                                        0                                        -0.13
                                                       3.5                                                                                                                                           1.24
                                                            3                    Median:                                                           1
                                                                                  2.30                                                                                                                                             -1
                                                       2.5
                                                            2                                                                                0.5                                                                                   -2
                                                       1.5                                     Favors Growth                                                                       Favors Growth                                                                         Favors Growth
                                                            1                                                                                      0                                                                               -3
                                                                93 95 97 99 01 03 05 07 09 11 13 15 17 19                                               93 95 97 99 01 03 05 07 09 11 13 15 17 19                                       93 95 97 99 01 03 05 07 09 11 13 15 17 19
                                                                                                                                                                                                                                        Gray -25/75th percentiles
                                                                                                                                                                                                                                        Gold - 5/95th percentiles
                                                                       P/E FWD 4Q - Relative Multiple                                                        Price/Sales - Relative Multiple
                                                            3.5                                                                                   4.5
                                                                                              Favors Value                                         4                                Favors Value            Valuation                             Current       Percentile Rank
                                                                3
                                                                                                                                                                                                            Metric                                Relative 10-Year 20-Year Since '93

                                                                                                                          Growth/Value Multiple
                                                                                                                                                  3.5
                                    Growth/Value Multiple

                                                            2.5                                                                                                                                             Price/Book                              4.49     90%     95%      96%
                                                                                                                                                   3                                                        Dividend Yield                          1.24     75%     58%      54%
                                                                2                                                                                 2.5                                                       P/E (FWD)                               1.73     94%     95%      90%
                                                                                                                                                                                                     2.44
                                                                                                  Median:       1.73                                                                       Median:          Price/Sales                             2.44     92%     95%      92%
                                                            1.5                                    1.35                                            2                                        1.61            FCF Yield*                              0.53     91%     86%      78%
                                                                                                                                                  1.5                                                                                             *Excludes Financials
                                                                1
                                                                                                                                                   1
                                                            0.5
                                                                                              Favors Growth                                       0.5
                                                                                                                                                                                   Favors Growth
                                                                0                                                                                  0
                                                                    93 95 97 99 01 03 05 07 09 11 13 15 17 19                                           93 95 97 99 01 03 05 07 09 11 13 15 17 19

Gray – 25/75th percentiles
Yellow – 5/95th percentiles
Sources: FactSet and Glenmede Investment Management LP (Free Cash Flow Yield includes dividends, excludes financial companies)
All data is from 1/1/1993 through 3/31/2021, unless otherwise noted. The views expressed represent the opinions of the portfolio managers. There can be no assurance that the same factors would result in the same index contributions, weightings or
decisions being made in the future. In addition, the securities mentioned may or may not be currently held in the portfolio and are not a recommendation to buy or sell. Past performance is not indicative of future performance. For Institutional Investor Use Only.

                                                                                                                                                                                  Relative valuation spreads are near highest levels since 1993
Glenmede U.S. equity outlook

Expectations for real U.S. GDP of 5% to 8% for 2021 and 3% to 5% for 2022

Positive
   Accommodative fiscal and monetary policies
   Mass vaccinations and medical advances on COVID-19
   Consumer and business sentiment
   Low interest rates
   Steepening yield curve

Risks
   Resurgence of COVID-19 Pandemic, variants
   Rising inflation
   Excessive fiscal spending
   International relations (China, Russia)

Our Industry group leading indicators
    Overweightings in Financials, Communication Services and Utilities
    Underweightings in Consumer Discretionary, Industrials and Energy

                                                                                                                    Expect rebound in economic growth and capital markets in second half of 2020 and 2021

 Sources: Glenmede Investment Research and FactSet (based on Annual Bottoms-up Estimates)
 This represents the opinions and expectations of the portfolio managers. There can be no assurance that these opinions will be correct or expectations achieved.

                                                                                                               Rising expectations for stronger earnings growth in non-technology companies through 2022
Diversified portfolio

                                                                                                            Large                    Russell 1000 Growth                        Russell 1000 Index                       S&P 500 Index
                                                                                                            Cap                   Market Cap             Equal             Market Cap              Equal                     Market Cap
                                                                                                           Growth                  Weighted             Weighted            Weighted              Weighted                    Weighted
               Market
                           Market Cap ($Bil)                                                                247.9                     701.2                 58.0                420.5                41.7                      468.5
                           Beta vs. S&P 500 Index                                                            0.98                      1.05                 1.03                 1.01                1.07                      1.04
               Valuation
                       Dividend Yield                                                                        0.9                       0.8                  0.7                  1.3                 1.4                         1.4
                       Price/Earnings (ltm)                                                                  28.0                      38.1                 34.2                29.8                 26.2                       29.9
                       Price to Earnings (FY1 Est)                                                           22.1                      29.9                 26.4                22.6                 20.5                       22.5
                       Price/Sales                                                                           4.1                       6.0                  4.5                  3.4                 2.6                         3.4
                       FCF Yield No Financials                                                               3.6                       2.2                  2.3                  2.2                 2.5                         2.3
                       EPS Estimate %Chg (3m)                                                                17.4                      23.6                 19.6                -51.4                -2.0                       15.3
                           EPS Estimate Diffusion FY1 (3m)                                                     77                       73                   59                   69                   61                       71
                           Hist 5Yr EPS Growth                                                               20.6                      21.0                 15.7                 13.8                 9.9                       13.7
                           Hist 5Yr Dividend Growth                                                          13.1                      12.0                 10.8                 9.4                  7.2                        9.4
               Fundamentals
                     Return on Equity                                                                        34.5                      31.8                 11.5                 16.7                 8.3                       19.3
                           Operating Margin                                                                  22.6                      22.7                 14.6                 20.8                15.7                       22.0
                           LT Debt/Capital                                                                   42.5                      45.2                 48.0                 45.6                45.5                       46.0

Source: FactSet (P/E ratios exclude negative earnings)
All data as of 3/31/2021, unless otherwise noted. This represents past performance which is not indicative of future results. See Additional Disclosures at the end of this document. For Institutional Investor Use Only.

                                                                                                                                                                      Well positioned for 2021
Relative P/E

                                                                          Quant U.S. Large Cap Growth and Russell 1000 Growth
                                                                                       Relative P/E (Fiscal Year 1)
                                                       0%

                                                       -5%
                    Relative P/E Premium (Discount)

                                                      -10%

                                                      -15%                                                                                                                                 -13.9%

                                                      -20%

                                                      -25%
                                                                                                                                                                                           -26.2%
                                                      -30%

                                                      -35%

                                                      -40%

                                                      -45%
                                                          2003   2006                   2008                     2010                    2013                    2015   2017     2020

                                                                                            Median                                Relative P/E Premium (Discount)

Sources: Glenmede Investment Research and FactSet
All data as of 3/31/2021, unless otherwise noted. This represents past performance which is not indicative of future results. For Institutional Investor Use Only.

                                                                                                                                   Strategy reflects valuation discount of about 26% versus benchmark
Team contacts

Institutions, Consultants,             Advisors
Platforms and Sub-Advisory
                                       Jason Laird
                                       Business Development Officer
Jeffrey W. Coron, CIMA
                                       Direct: 215-419-6902
Director of Institutional Sales
                                       Email: jason.laird@glenmede.com
Direct: 215-419-6627
Email: jeffrey.coron@glenmede.com
                                       Kevin Heckman, CFA
                                       Business Development Officer
Client Service                         Direct: 215-419-6193
                                       Email: kevin.heckman@glenmede.com
Kent E. Weaver, CFA                    Jarrett Naiden, CIMA
Director of Sales and Client Service   Business Development Associate
Direct: 215-419-6687                   Direct: 215-419-6793
Email: kent.weaver@glenmede.com        Email: jarrett.naiden@glenmede.com
Additional
information
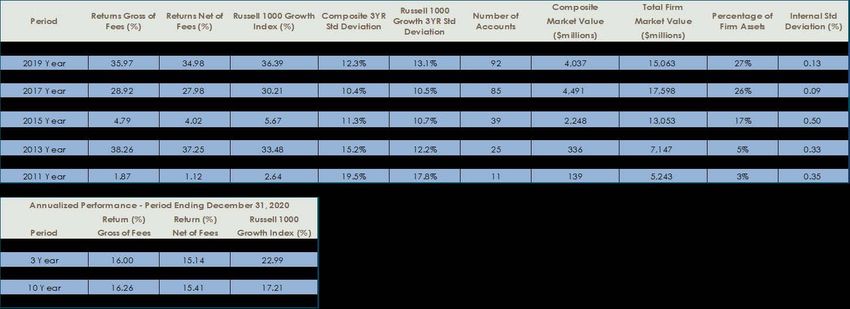
Composite performance presentation
Quantitative U.S. Large Cap Growth Equity Composite                                                                                                                                       January 1, 2003 through December 31, 2021

Past performance is not indicative of future performance.
Glenmede Investment Management, LP (the “Firm” or GIM) claims compliance with the Global Investment Performance Standards (GIPS®) and has prepared and presented this report in compliance with the GIPS standards. Glenmede Investment
Management, LP has been independently verified for the period of 01/01/1993 to 06/30/2020. The verification reports are available upon request. A firm that claims compliance with the GIPS standards must establish policies and procedures for
complying with all the applicable requirements of the GIPS standards. Verification provides assurance on whether the firm’s policies and procedures related to composite and pooled fund maintenance, as well as the calculation, presentation, and
distribution of performance, have been designed in compliance with the GIPS standards and have been implemented on a firm-wide basis. Verification does not provide assurance on the accuracy of any specific performance report.

Glenmede Investment Management, LP, a registered Investment Advisor, is an affiliate of the Glenmede Trust Company, NA (GTC). Effective January 1, 2007, the Investment Product Management Group of GTC became Glenmede Investment
Management, LP. All performance prior to January 1, 2007, shown here as the performance of GIM, was previously reported as the performance of the Investment Product Management Group of the Glenmede Trust Company. “Firm” assets are defined
as all assets managed by the Glenmede Investment Management, LP. All returns are calculated in US Dollars. A list of composite descriptions and a list of broad distribution pooled funds are available upon request.

The Quantitative U.S. Large Cap Growth Equity Composite objective is to provide maximum long-term return with reasonable risk to principal, by investing in domestic stocks of the Russell 1000 Growth universe.
Composite performance presentation

Quantitative U.S. Large Cap Growth Equity Composite

The composite was created on 04/01/2005 and has a start date of 01/01/2003. The composite is comprised all the Glenmede Investment Management, LP Large Cap Growth non-restricted, discretionary, actively managed accounts over $500,000.
Prior to 01/01/2016, the minimum was $1 million. Accounts are included in the composite beginning with the first full month of performance through the last full month of performance. Accounts falling below the minimum or experiencing net cash
flows of 30% or greater of beginning market value are excluded from the composite for that month. Performance results are calculated on a total return basis and include all realized and unrealized capital gains and losses as well as dividends and
interest. Portfolios in the composite presented record transactions based on trade date. Portfolio performance calculations are time-weighted to account for periodic contributions and withdrawals. Composite returns consist of size-weighted portfolio
returns using beginning of period values to weight portfolio returns. Monthly linking of interim performance results is used to calculate year-to-date and annual returns. All of the composite’s valuations and returns are computed and stated in U.S.
Dollars. Policies for valuing portfolios, calculating performance and preparing GIPS reports are available upon request. The gross of fee returns reflect composite performance results that include transaction costs. Net of fee returns reflect composite
performance results that have been adjusted to reflect a deduction for investment management fees at the highest model rate of 0.75% reflected on the performance presentation.

Internal Standard Deviation measures the consistency of a composite’s performance results with respect to the individual portfolio returns within that composite. The dispersion of the gross returns of each composite is calculated by the asset-
weighted deviation method. Only portfolios that have been managed for the full period have been included in the presented dispersion calculations of each composite. For periods with five or fewer portfolios, disclosure of dispersion and the number of
accounts is not presented. The three-year annualized ex-post standard deviation measures the variability of the gross composite and index returns over the preceding 36-month period.

The Russell 1000 Growth Index is an unmanaged, market value weighted index, which measures performance of the largest 1,000 companies in the U.S. equity market that have higher price/book ratios and higher forecasted growth values. One cannot
invest directly in an index.

GIPS® is a registered trademark of CFA Institute. CFA Institute does not endorse or promote this organization, nor does it warrant the accuracy or quality of the content contained herein.
Disclosures
All materials presented are illustrative and for discussion purposes with professional or sophisticated investors. This presentation contains confidential and proprietary information of Glenmede
Investment Management, LP (“GIM”) and should be shared only with those persons assisting a prospect or investor with the selection of managers or investment strategies who agree to keep it
confidential. These materials should not be circulated to others with the express approval of GIM.

Nothing in this document alters the terms and conditions of the relationship between GIM and its client, which are governed by the Investment Management Agreement or other similar documentation.

This document has no regard to the specific investment objectives, financial situation or particular needs of any recipient and is not a solicitation or offer to buy or sell securities. Though all factual
information herein was gathered in good faith and is believed to be accurate, no representation or warranty is provided in relation to the accuracy or reliability, nor is this document intended to be a
complete statement or summary of the markets, securities, risks or developments referred to. This material should not be regarded by recipients as a substitute for the exercise of their own judgement.
Opinions or objectives expressed herein are the current opinions or objectives as of the dates indicated, and may differ from those expressed by other persons or business units affiliated with GIM,
which may use different assumptions or criteria. GIM is under no obligation to update opinions as they change.

References to the manager’s investment process and objectives, including but not limited to investment screens, portfolio constraints and risk control are intended to provide the recipient with an idea
of the portfolio manager’s goals. There is not a guarantee of such goals will not be changed, or that the current goals can be achieved. All investment has risk.

All performance results reported are historical. PAST PERFORMANCE IS NOT INDICATIVE OF FUTURE RESULTS. Unless otherwise indicated, performance numbers included herein are reported gross
of management fees. You will be charged management fees and management and other fees reduce returns. To see the performance of the relevant composite net of a standardized set of fees, ask
your GIM contact for a GIPS Compliant Presentation. Performance of individual accounts during the indicated period may be lower or higher than the performance in the composite.

Price to Earnings (P/E): ratio of stock price to earnings. 3-Year EPS Growth: historical earnings per share growth over the last3 years. Return on Equity (ROE): net income divided by equity. Free Cash
Flow Yield: an indicator that compares free cash flow and market cap. It is a representation of the income (free cash flow) created by an investment. A yield of 12 percent means that a company is
generating 12 percent of its Market Capitalization in free cash flow yearly. Dividend Yield: a dividend expressed as a percentage of a current share price.

The Russell 1000 Growth Index is an unmanaged, market value weighted index, which measures performance of the largest 1,000 companies in the U.S. equity market that have higher price/book ratios
and higher forecasted growth values. The Russell 1000 Index is an unmanaged, market value weighted index, which measures performance of the largest 1,000 companies in the U.S. equity market. The
Russell Top 200 Growth Index offers measures the performance of the especially large cap segment of the US equity universe represented by stocks in the largest 200 by market cap. The Russell Top
200 Value Index measures the performance of the especially large cap segment of the US equity universe represented by stocks in the largest 200 by market cap that exhibit value characteristics. The
Russell Midcap Growth Index measures the performance of the midcap growth segment of the US equity universe. It includes those Russell Midcap Index companies with higher price-to-book ratios and
higher forecasted growth values. The Russell Midcap Value Index measures the performance of the midcap value segment of the US equity universe. It includes those Russell Midcap Index companies
with lower price-to-book ratios and lower forecasted growth values. The Russell 2000 Growth Index measures the performance of the small cap growth segment of the US equity universe. It includes
those Russell 2000 companies with higher price-to-value ratios and higher forecasted growth values. The Russell 2000 Value Index measures the performance of small-cap value segment of the US
equity universe. It includes those Russell 2000 companies with lower price-to-book ratios and lower forecasted growth values. One cannot invest directly in an index.
Team contacts

Institutions, Consultants,             Advisors
Platforms and Sub-Advisory
                                       Jason Laird
                                       Business Development Officer
Jeffrey W. Coron, CIMA
                                       Direct: 215-419-6902
Director of Institutional Sales
                                       Email: jason.laird@glenmede.com
Direct: 215-419-6627
Email: jeffrey.coron@glenmede.com
                                       Kevin Heckman, CFA
                                       Business Development Officer
Client Service                         Direct: 215-419-6193
                                       Email: kevin.heckman@glenmede.com
Kent E. Weaver, CFA                    Jarrett Naiden, CIMA
Director of Sales and Client Service   Business Development Associate
Direct: 215-419-6687                   Direct: 215-419-6793
Email: kent.weaver@glenmede.com        Email: jarrett.naiden@glenmede.com
You can also read